1000
First evidence of a link between topology and neurophysiological properties of brain sub-networks.
Anita Monteverdi1,2, Fulvia Palesi2, Claudia AM Gandini Wheeler-Kingshott1,2,3, and Egidio D'Angelo1,2
1Brain Connectivity Center, IRCCS Mondino Foundation, Pavia, Italy, 2Brain and Behavioural Sciences, University of Pavia, Pavia, Italy, 3NMR Research Unit, Queen Square Multiple Sclerosis Centre, Department of Neuroinflammation, UCL Queen Square Institute of Neurology, UCL, London, United Kingdom
1Brain Connectivity Center, IRCCS Mondino Foundation, Pavia, Italy, 2Brain and Behavioural Sciences, University of Pavia, Pavia, Italy, 3NMR Research Unit, Queen Square Multiple Sclerosis Centre, Department of Neuroinflammation, UCL Queen Square Institute of Neurology, UCL, London, United Kingdom
Synopsis
A comprehensive assessment of multiple resting-state networks is still lacking and the characterization of their excitatory/inhibitory (E/I) balance is an open field of research. In this exploratory work we performed a first characterization of the E/I balance in resting-state networks (visual, somatomotor, attention, limbic, frontoparietal, DMN) both in healthy and neurodegenerative conditions (Alzheimer’s Disease, Frontotemporal Dementia, Amyotrophic Lateral Sclerosis) taking advantage of a Virtual Brain based approach. Our results provided a new strategy to simultaneously characterize multiple networks at single-subject level, deepening their E/I balance and opening new perspectives for biomarkers research.
Introduction
Resting-state functional connectivity (FC) has been increasingly considered as an imaging biomarker, especially for neurodegenerative diseases. A comprehensive assessment of FC changes in multiple networks has been rarely performed1, in favor of investigating specific networks, like default mode network (DMN) in Alzheimer’s disease (AD)2. Moreover, even less is known about excitatory/inhibitory (E/I) balance characterizing different FC networks but this information is extremely important, especially aiming to provide new insights in neurodegenerative mechanisms determining FC alterations. To date, only few studies have explored brain sub-networks in neurodegenerative conditions other than AD, like Frontotemporal Dementia (FTD) or Amyotrophic Lateral Sclerosis (ALS)3. In this exploratory study we characterized multiple resting-state networks using The Virtual Brain (TVB4,5), which is a brain dynamic modeling platform that can provide personalized E/I balance parametrization6. We assessed possible correlations between E/I parameters and each network FC and sparsity properties both in health and pathology (AD,FTD,ALS), opening new perspectives for biomarkers research.Methods
Subjects: 20 subjects underwent MRI examination using a 3T Siemens Skyra scanner: 5 healthy controls (HC) (3 females, 54±7y), 5 AD (2 females, 72±7y), 5 FTD (1 female, 67±6y) and 5 ALS (3 females, 72±6y). The protocol included resting-state fMRI (rs-fMRI) (T2∗-weighted GRE-EPI, TR/TE=3010/20ms; voxel=2.5x2.5x2.5mm3 isotropic, 120 volumes), diffusion-weighted imaging (SE-EPI, TR/TE=10000/97ms, voxel=2x2x2mm3 isotropic, 64 diffusion-weighted directions, b=1200s/mm2, 10 b0-images), and 3DT1-weighted volume (MPRAGE, TR/TE/TI=2.3/2.95/900ms, voxel=1.1x1.1x1.2mm3).Preprocessing and tractography: Diffusion-weighted and rs-fMRI images were preprocessed and whole-brain Anatomically-Constrained Tractography7 was performed estimating fibers orientation distribution with multi-tissue constrained spherical deconvolution and using probabilistic tractography8.
Structural connectivity (SC) and experimental FC (expFC) matrices: An ad-hoc atlas was created combining 93 cerebral (AAL9) (including cortical/subcortical structures) and 31 cerebellar (SUIT10) labels. For each subject, the parcellation of whole-brain tractography led to SC matrix containing the normalized number of streamlines as edges and cortical/subcortical labels as nodes. The time-course of BOLD signals was extracted from rs-fMRI data for each node and the expFC matrix was computed for each subject correlating time-courses between nodes with a Fisher-z transformed coefficient thresholded at 0.120611. From these matrices, six subnetworks known to support specific functions (Fig.1) were selected according to the Buckner12 and Yeo13 atlases. Intra-network FC (intraFC) was computed averaging expFC node strengths within each network. Sparsity was defined as the fraction of the total number of zero-elements over the total number of subnetwork nodes.
TVB simulation: single-subject analysis was conducted as described in Fig.2. The Wong-Wang model14 was chosen to simulate brain dynamics in each of the six selected subnetworks. A series of parameters were tuned in order to gain a description of long-range coupling strength (G), excitatory (JNMDA) and inhibitory (Ji) coupling and recurrent excitation (w+). In each subnetwork the simulated FC (simFC) was computed and parameters were adjusted iteratively within a specific range of values14 until the highest Pearson correlation coefficient (PCC) between expFC and simFC was achieved.
Statistics (SPSS v21): Non-parametric tests were used to assess PCC and TVB-parameter differences between all subnetworks. IntraFC and sparsity differences were assessed with one-way ANOVA. A multiple regression analysis was performed to investigate the relationship between TVB-parameters and subnetworks intraFC and sparsity.
Results
PCC between expFC and simFC differed between subnetworks, presenting lower values in visual, attention and limbic networks (Fig.3). TVB-parameter differences between functional subnetworks suggested the presence of a specific network-dependent E/I balance (Fig.4). However, in the attention, limbic, frontoparietal and DMN subnetworks the interquartile range of G and Ji was equal to zero, indicating that the range of values considered for parameters search may need to be revisited for network-specific TVB-parameters tuning. IntraFC and sparsity were different between subnetworks and contributed significantly to explain the variance of TVB-parameters in a backward regression (Fig.5).Discussion
The lower PCC values found in visual, attention and limbic subnetworks suggest a worsening of model fitting performance to the experimental data. Multiple factors may concur in determining this lower PCC, from non-optimal parameters tuning to the need of a regional specific model. In some of these networks, an interquartile range equal to zero has been observed for G and Ji, which is not physiological because heterogeneity of E/I balance between subjects is expected. Interestingly, a correlation has been found between TVB-parameters and subnetworks intraFC and sparsity, suggesting that differences of subnetworks’ properties can influence TVB-parameters’ optimization and consequently PCC estimation. Future work may wish to deepen this link between subnetwork topology and E/I balance taking advantage of graph theory approaches. A separate aspect that may affect model fitting to experimental data is the fact that currently TVB uses the same neural mass model for all nodes. This may be less of an issue when considering whole-brain dynamics, but may become a more important factor when studying subnetworks, emphasizing the need of ad-hoc neural mass models capturing characteristic microcircuit properties (e.g. cerebellar network15).The results achieved so far provide a new framework to characterize multiple brain subnetworks at single-subject level, taking into account brain structure and function, enriched by E/I balance assessment. This exploration included both healthy and pathological conditions and will provide new means to answering pathology-specific questions if applied to a larger cohort of subjects, paving the way to a novel approach to biomarkers research.Acknowledgements
This work was performed at the IRCCS Mondino Foundation and was supported by the Italian Ministry of Health (RC2020). This research received funding by H2020 Research and Innovation Action Grants Human Brain Project 785907 and 945539 (SGA2 and SGA3) and by the MNL Project “Local Neuronal Microcircuits” of the Centro Fermi (Rome, Italy) to ED and FP. CGWK received funding from the UK MS Society (#77), Wings for Life (#169111), Horizon2020 (CDS-QUAMRI, #634541), BRC (#BRC704/CAP/CGW).References
- Castellazzi G, Palesi F, Casali S, Vitali P, Wheeler-Kingshott CAM, Sinforiani E, D’Angelo E (2014) A comprehensive assessment of resting state networks: Bidirectional modification of functional integrity in cerebro-cerebellar networks in dementia. Front Neurosci 8:1–18.
- Jalilianhasanpour R, Beheshtian E, Sherbaf G, Sahraian S, Sair HI (2019). Functional Connectivity in Neurodegenerative Disorders: Alzheimer's Disease and Frontotemporal Dementia. Top Magn Reson Imaging. 28(6):317-324.
- Hohenfeld C, Werner CJ, Reetz K (2018) Resting-state connectivity in neurodegenerative disorders: Is there potential for an imaging biomarker? NeuroImage Clin 18:849–870
- Sanz-Leon P, Knock SA, Spiegler A, Jirsa VK (2015) Mathematical framework for large-scale brain network modeling in The Virtual Brain. Neuroimage 111:385–430
- Sanz-Leon P, Knock SA, Woodman MM, Domide L, Mersmann J, Mcintosh AR, Jirsa V (2013) The virtual brain: A simulator of primate brain network dynamics. Front Neuroinform 7.
- Zimmermann J, Perry A, Breakspear M, Schirner M, Sachdev P, Wen W, Kochan NA, Mapstone M, Ritter P, McIntosh AR, Solodkin A (2018) Differentiation of Alzheimer’s disease based on local and global parameters in personalized Virtual Brain models. NeuroImage Clin 19:240–251.
- Smith RE, Tournier JD, Calamante F, Connelly A (2012) Anatomically-constrained tractography: Improved diffusion MRI streamlines tractography through effective use of anatomical information. Neuroimage 62:1924–1938
- Tournier JD, Calamante F, Connelly A (2012) MRtrix: Diffusion tractography in crossing fiber regions. Int J Imaging Syst Technol 22:53–66.
- Tzourio-Mazoyer, N., Landeau, B., Papathanassiou, D., Crivello, F., Etard, O., Delcroix, N., et al. (2002). Automated anatomical labeling of activations in SPM using a macroscopic anatomical parcellation of the MNI MRI single-subject brain. Neuroimage 15, 273–289.
- Diedrichsen J, Balsters JH, Flavell J, Cussans E, Ramnani N (2009) A probabilistic MR atlas of the human cerebellum. Neuroimage 46:39–46
- Palesi F, Lorenzi RM, Casellato C, Ritter P, Jirsa V, Wheeler-kingshott CAMG, Angelo ED (2020) The Importance of Cerebellar Connectivity on Simulated Brain Dynamics. Front Cell Neurosci 14:1–11.
- Buckner, R. L., Krienen, F. M., Castellanos, A., Diaz, J. C., & Yeo, B. T. T. (2011). The organization of the human cerebellum estimated by intrinsic functional connectivity. Journal of Neurophysiology, 106(5), 2322–2345.
- Yeo, B. T. T., Krienen, F. M., Sepulcre, J., Sabuncu, M. R., Lashkari, D., Hollinshead, M., et al. (2011). The organization of the human cerebral cortex estimated by intrinsic functional connectivity. Journal of Neurophysiology, 106(3), 1125–1165.
- Deco G, Ponce-Alvarez A, Hagmann P, Romani GL, Mantini D, Corbetta M (2014) How local excitation-inhibition ratio impacts the whole brain dynamics. J Neurosci 34:7886–7898.
- Lorenzi RM, Geminiani A., Wheeler-Kingshott CAM, Palesi F. Casellato C., D’Angelo E. Biologically-driven cerebellar neural mass model for improving BOLD signals simulations ISMRM 2020
Figures
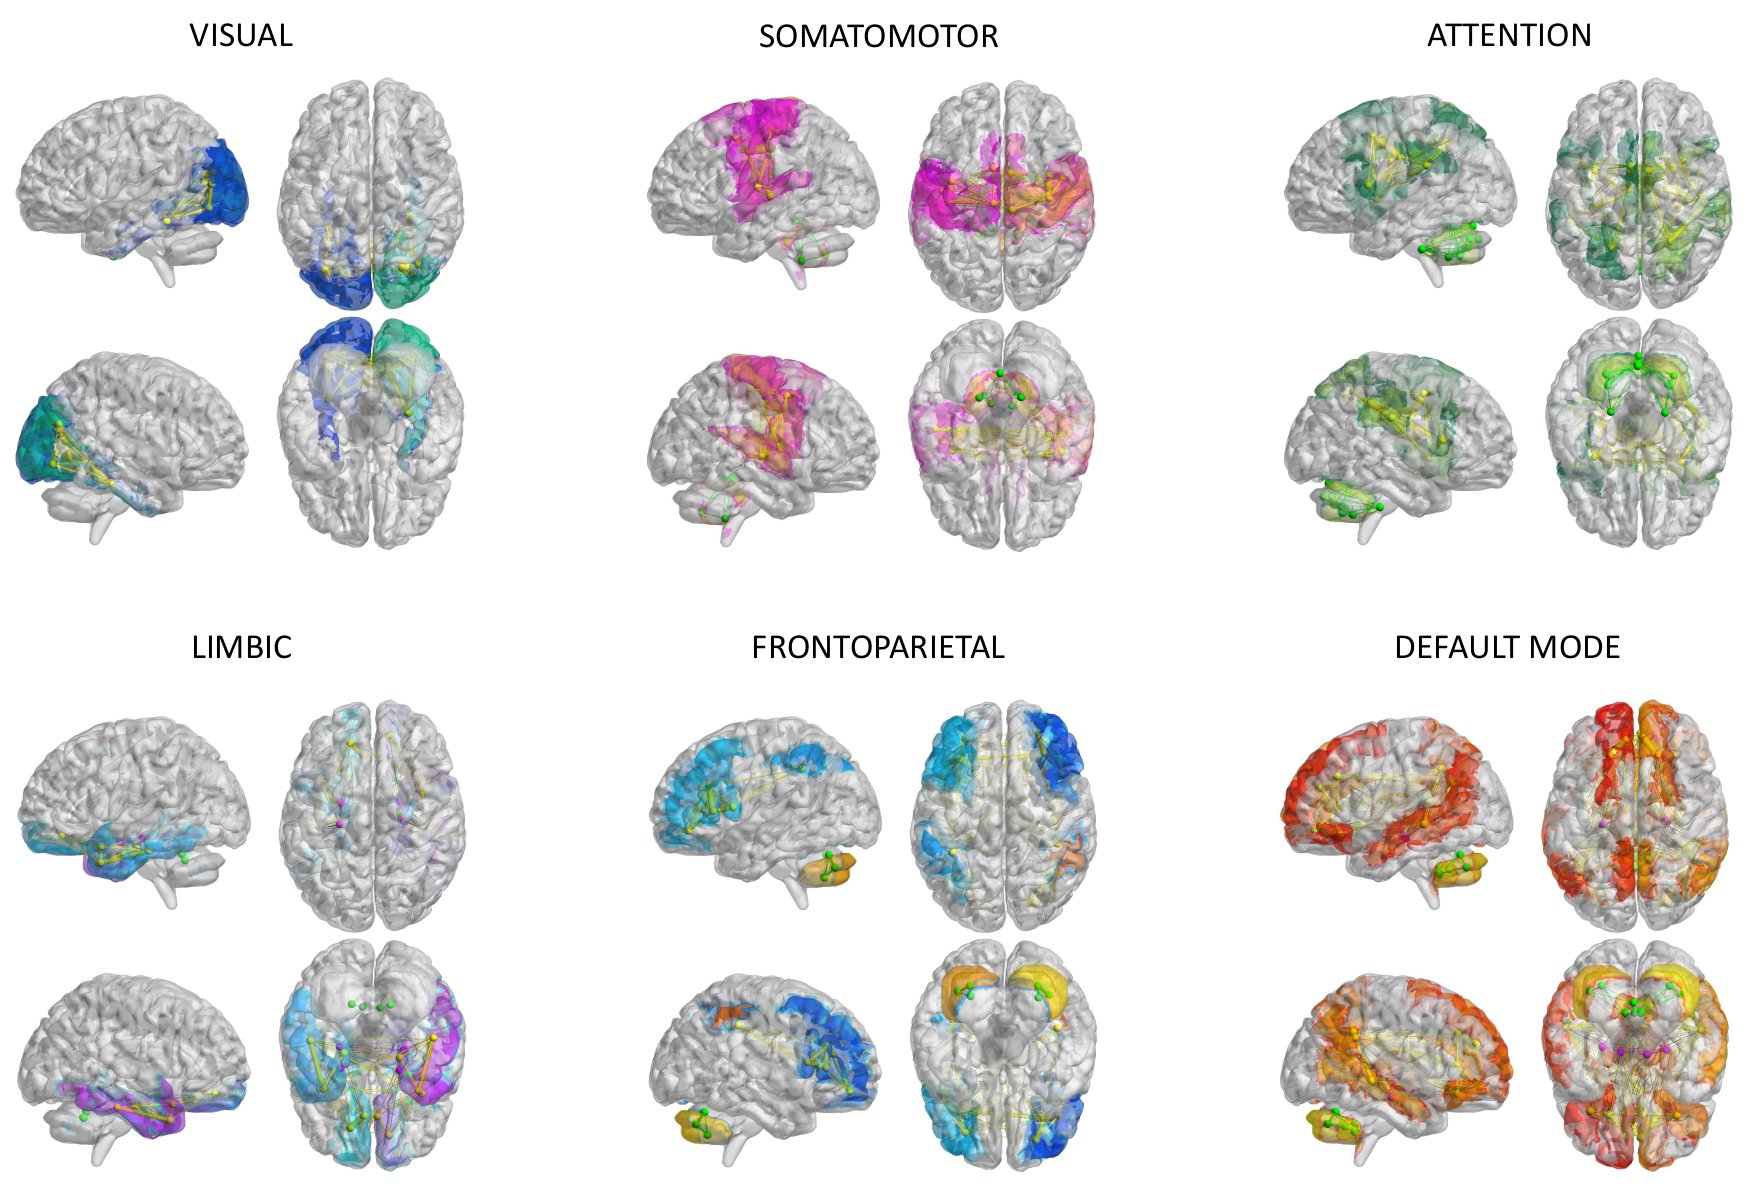
Fig.1| The six subnetworks considered for modeling: visual, somatomotor, attention, limbic, frontoparietal, default mode network (DMN). These subnetworks were extracted from structural connectivity matrices of each subject choosing a subset of nodes and connections according to Buckner and Yeo atlases. Nodes and edges considered for each subnetwork are differently colored.
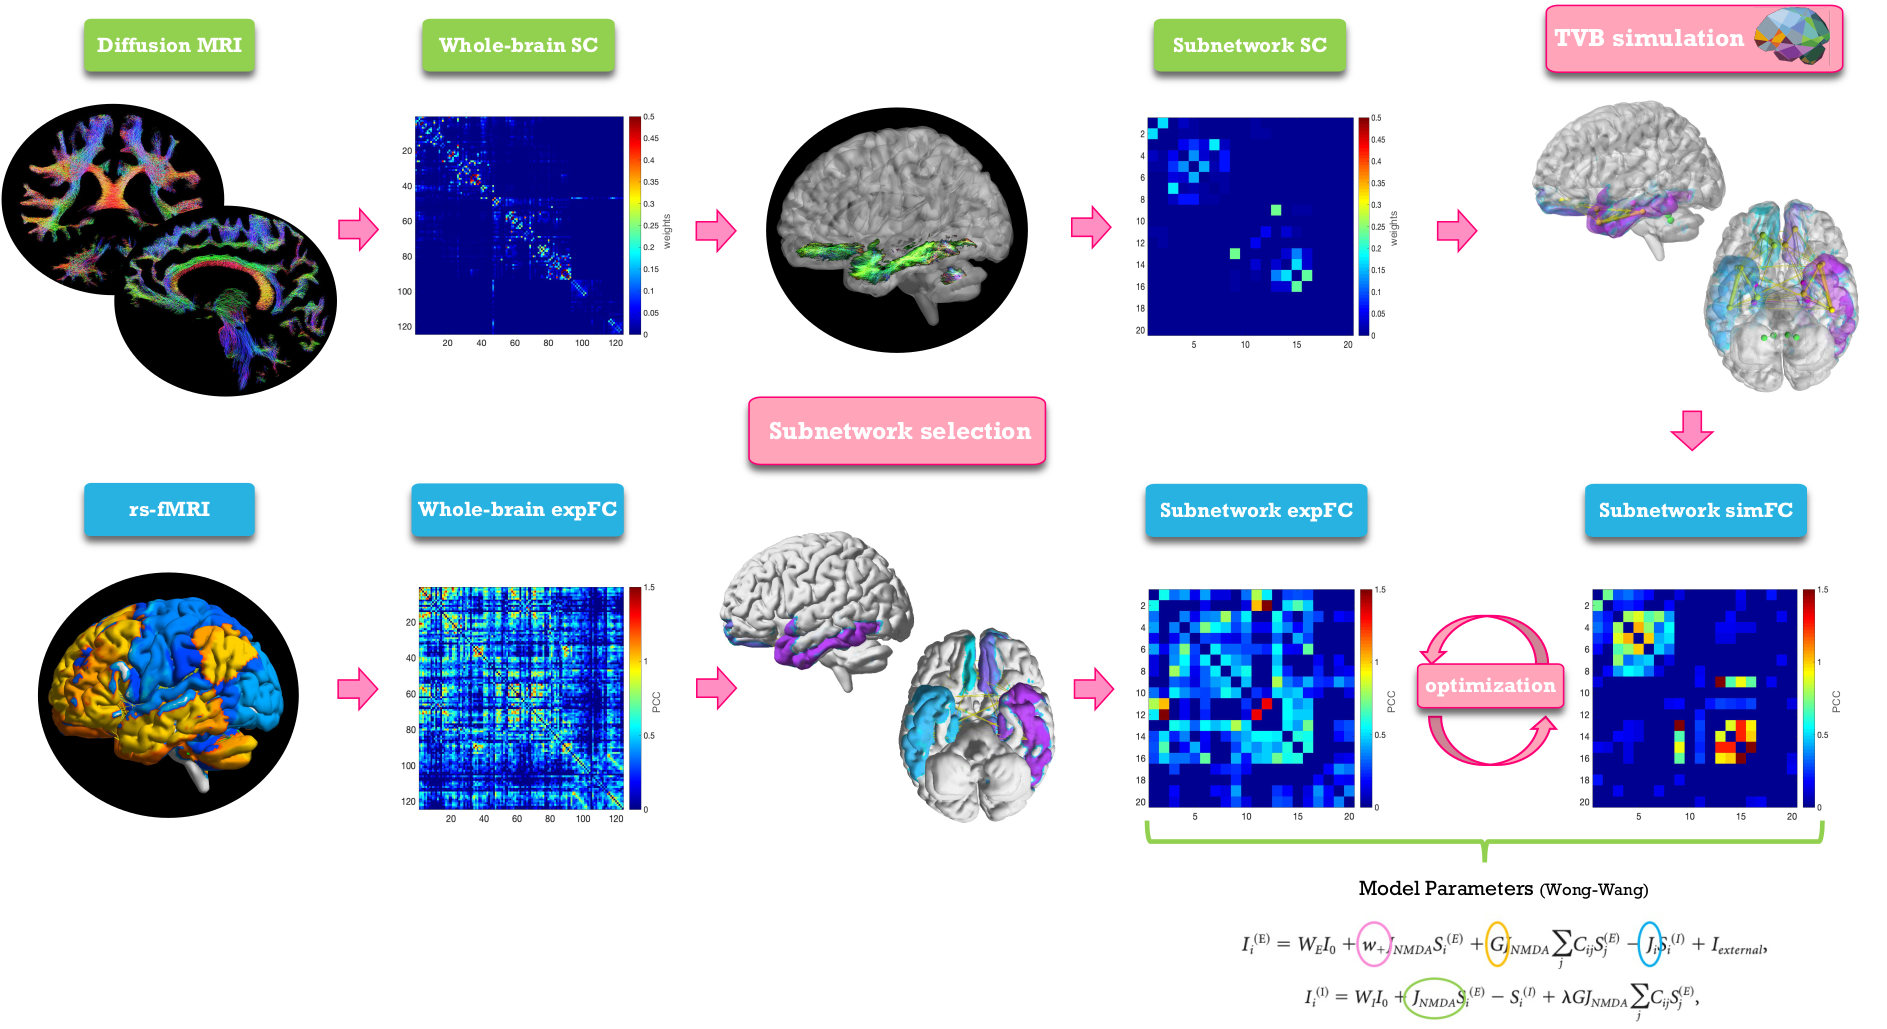
Fig.2| Analysis workflow. From top left, clockwise: diffusion-weighted images after preprocessing and tractography, whole-brain structural connectivity (SC) matrix, extraction of a subnetwork choosing a subset of nodes and edges, The Virtual Brain simulation performed for the subnetwork, reconstruction of a simulated functional connectivity matrix (simFC) of the subnetwork, optimization of the simFC using a model inversion with the experimental FC (expFC) of the subnetwork as target.
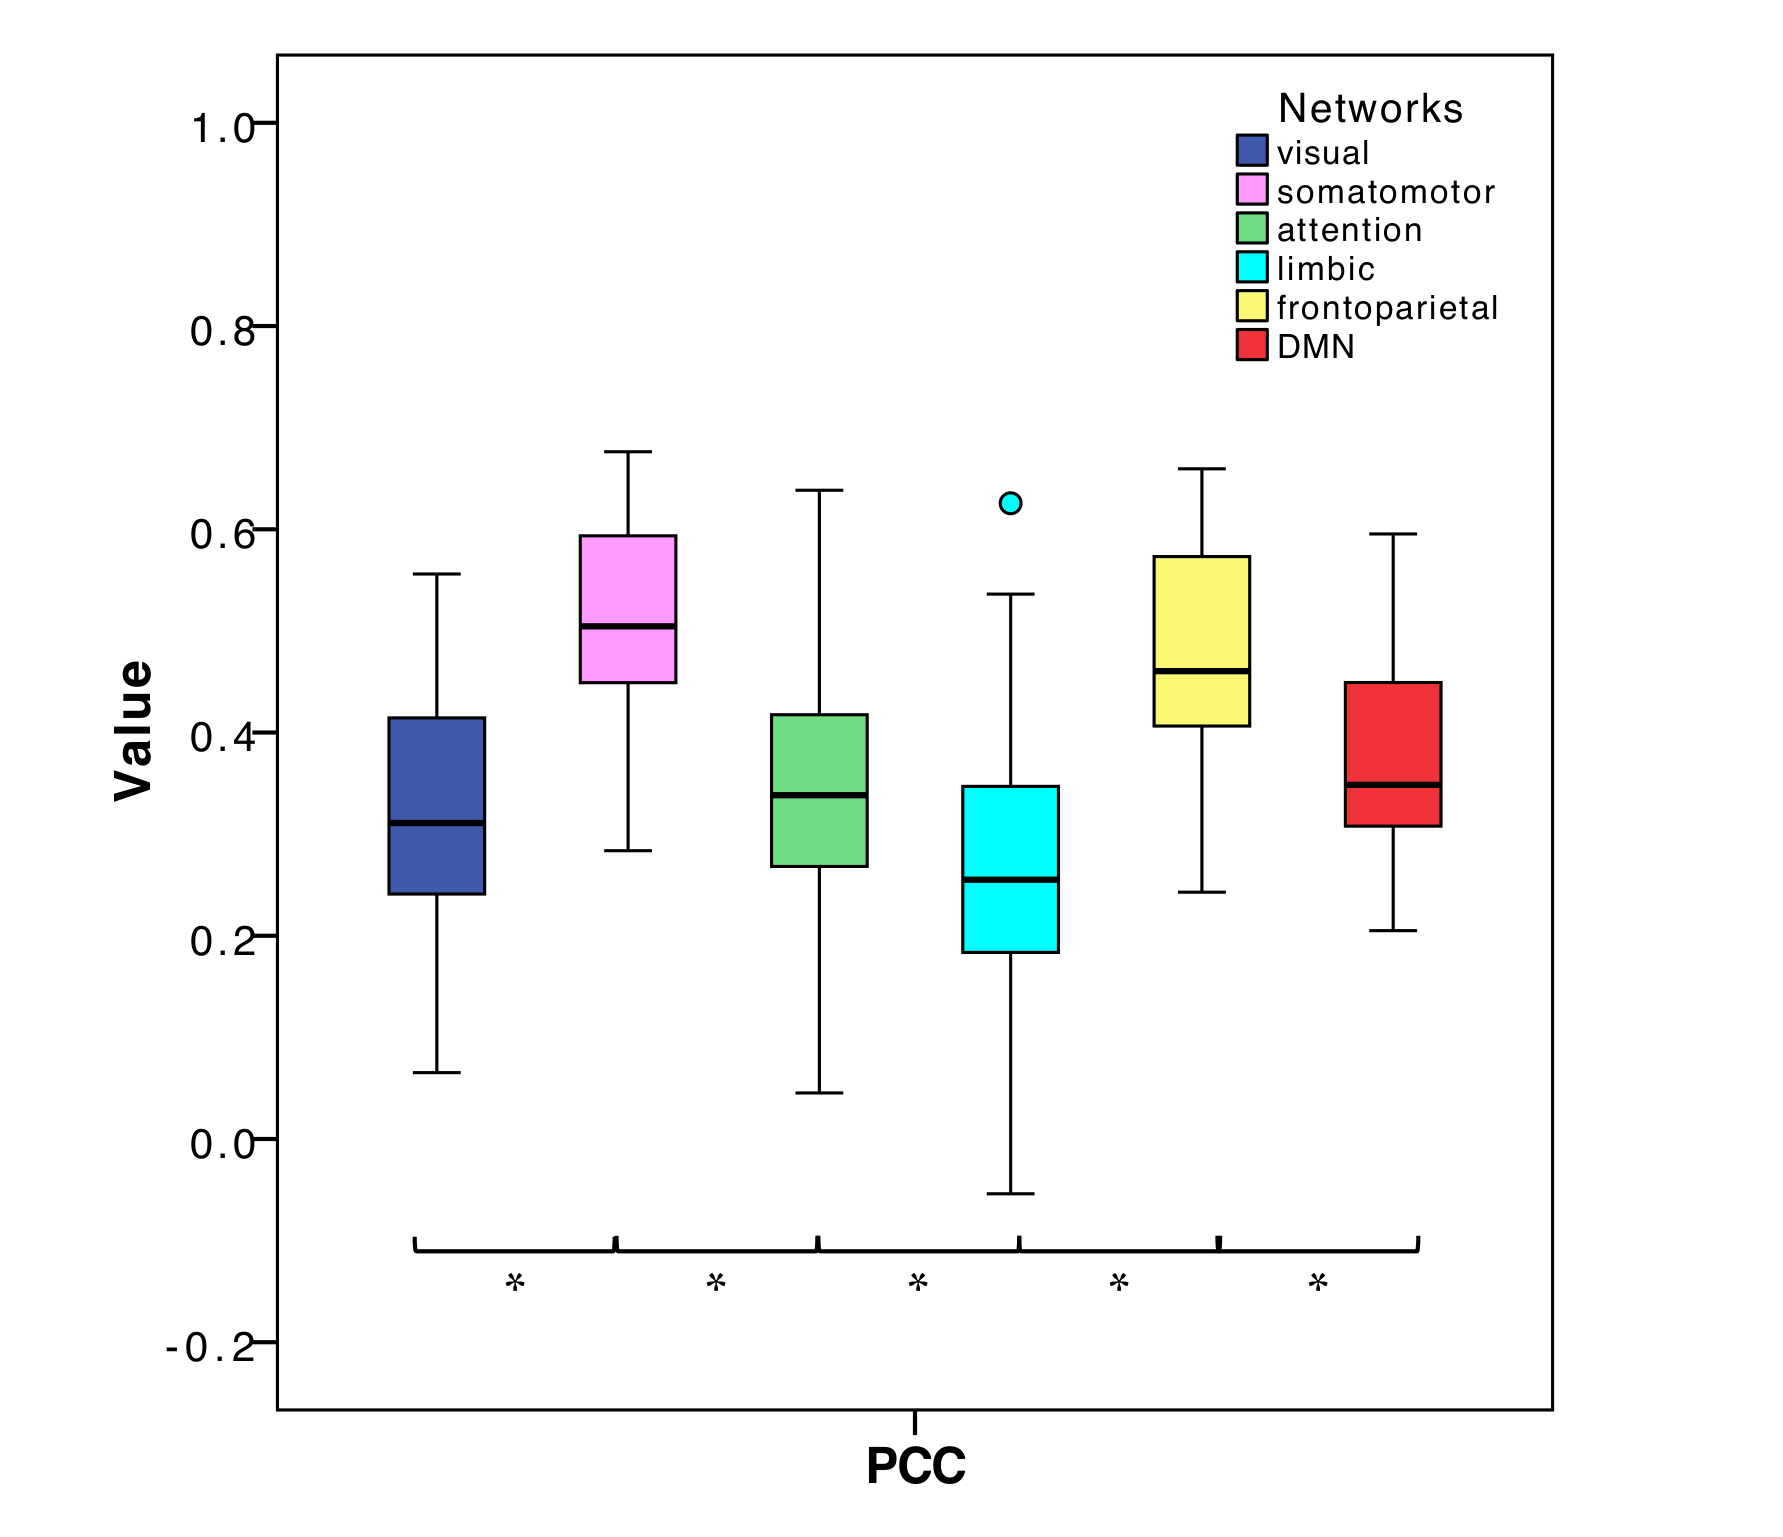
Fig.3| Boxplots of Pearson Correlation Coefficient (PCC) between experimental and simulated subnetworks functional connectivity for all subnetworks. Asterisks represent significant differences (ANOVA, p<0.05).
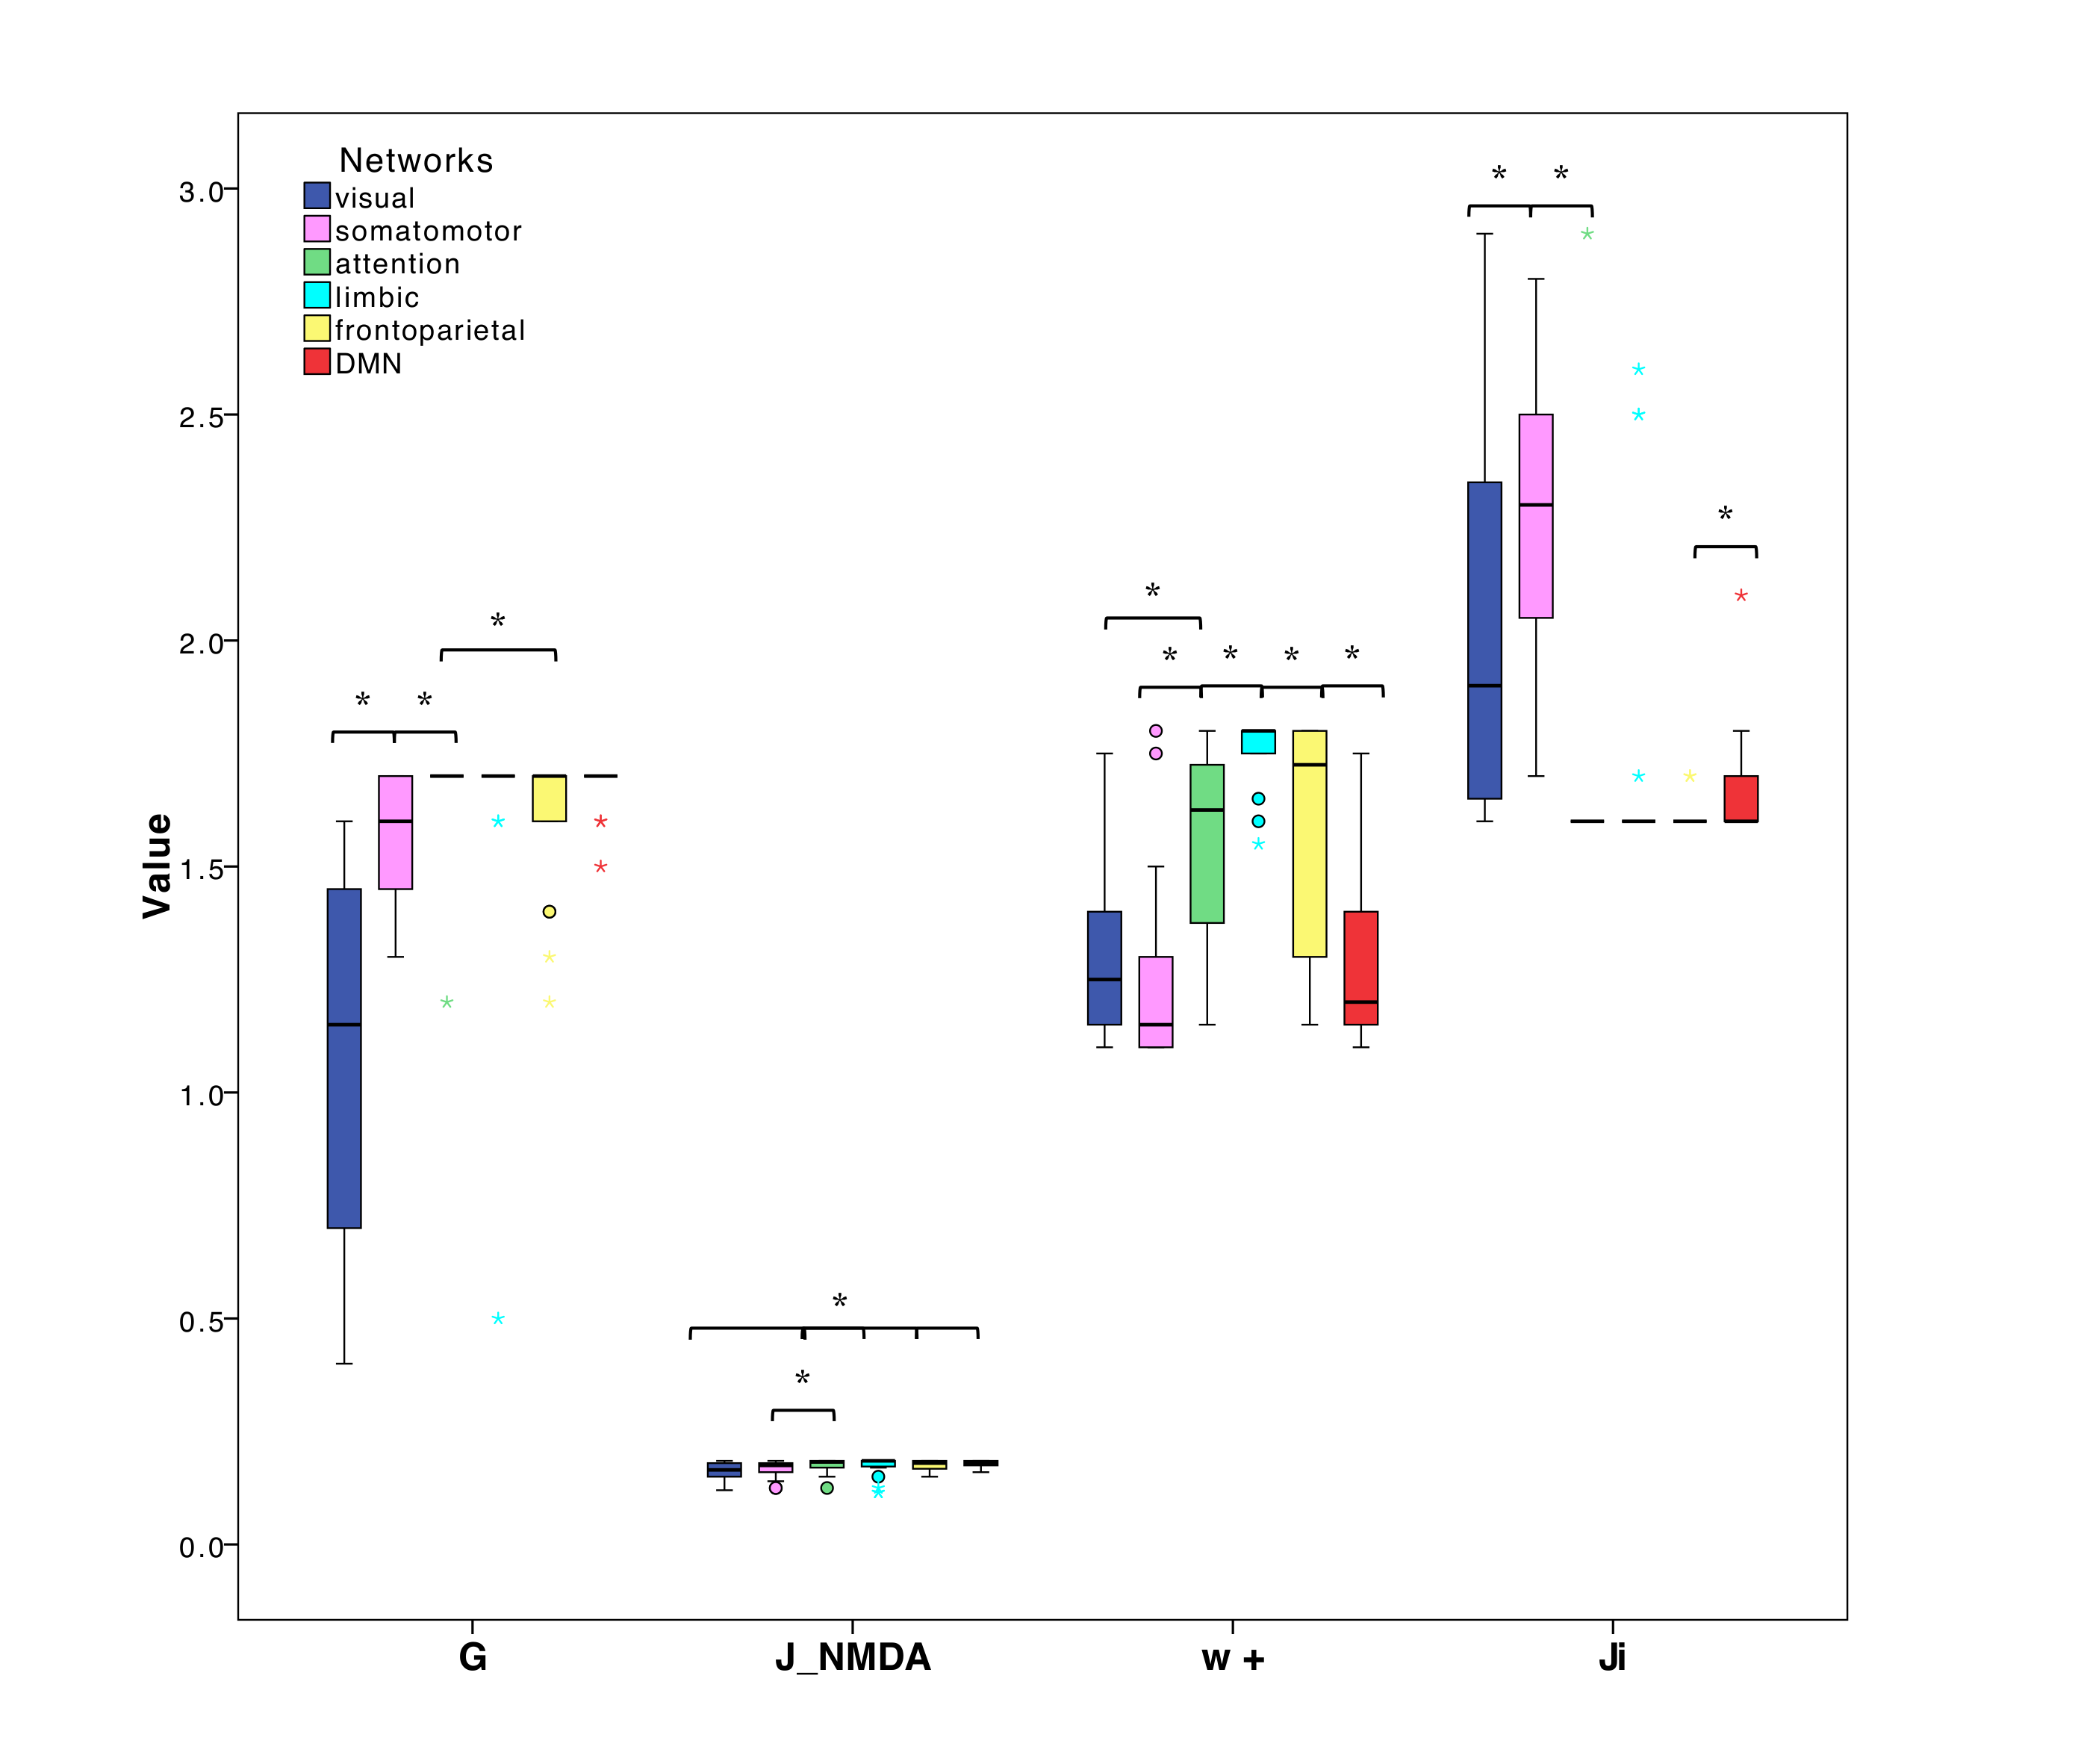
Fig.4| Boxplots of optimal TVB-parameters (G=global coupling J_NMDA=excitatory coupling w+=local excitatory recurrence Ji=inhibitory coupling) among subnetworks. Asterisks represent significant differences (Kruskall Wallis, p<0.05). Each subnetwork is characterized by its own specific excitatory/inhibitory balance.
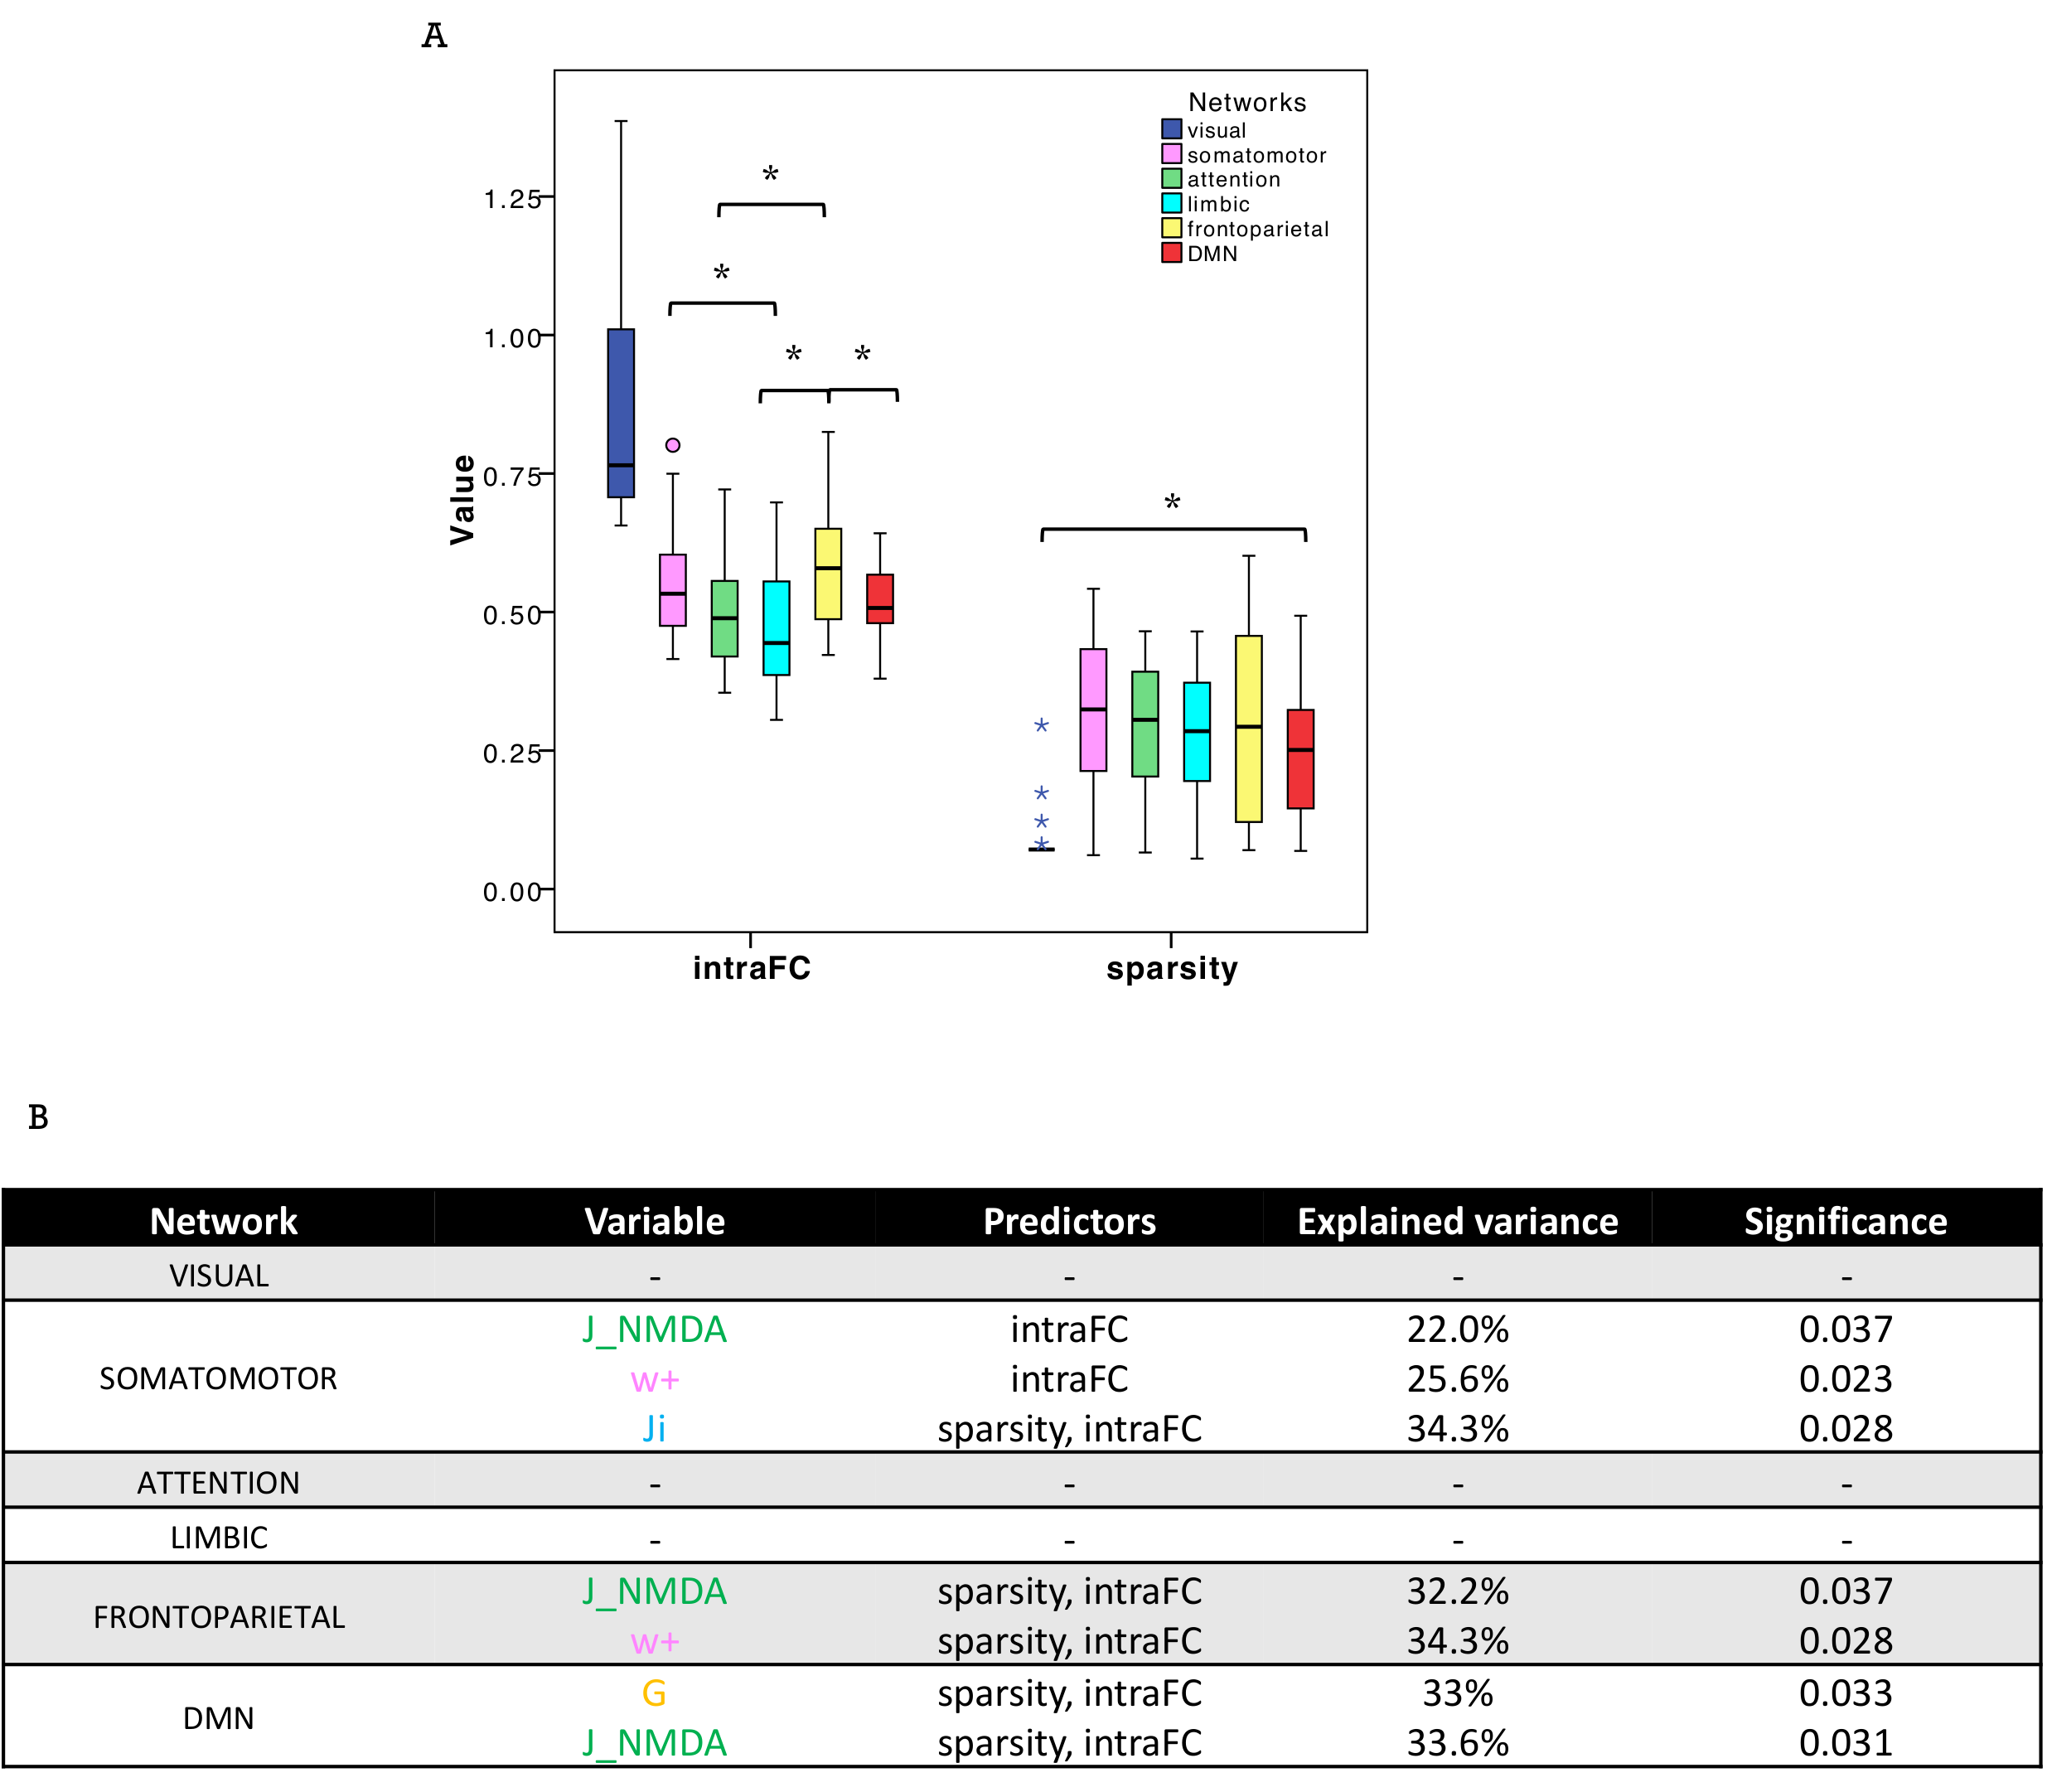
Fig.5| A) Boxplots of intra-network functional connectivity (intraFC) and sparsity computed for each network. Asterisks represent significant differences (ANOVA, p<0.05). B) In backward regressions the combination of intraFC and sparsity significantly (p<0.05) explained the variation (R2 index) of TVB parameters in single subnetworks.
DOI: https://doi.org/10.58530/2022/1000