0998
A novel method for characterizing dynamic resting state functional connectivity in Alzheimer's Disease1Department of Biostatistics, University of Washington, Seattle, WA, United States, 2Department of Radiology, University of Washington, Seattle, WA, United States
Synopsis
With advances in experimental therapeutics for Alzheimer's Disease (AD) the need for an accurate, non-invasive and widely available AD biomarker is more pressing than ever. Resting-state functional connectivity in default mode network is a candidate biomarker that is gaining traction in the field. However, the traditional stationary measurement of the default mode network connectivity cannot capture complicated dynamic patterns of functional connectivity that exist in the brain. Here, we have proposed a novel, reliable technique, based on Dynamic Condtional Correlation model, to quantify the dynamic functional connectivity in the brain and evaluated its sensitivity to cerebrospinal fluid biomarkers in AD.
Introduction
To be able to apply treatments in earlier stages of Alzheimer’s disease (AD), there is a need for non-invasive and widely available biomarkers that can identify the initiation of the disease (i.e. Aβ positivity) even while clinical symptoms are not yet present. Such a biomarker would provide the opportunity to stop or delay the disease progression before irreversible damage has been done. Many studies have reported alteration in intrinsic functional connectivity of the default mode network (DMN) in AD. However, the diagnosis accuracy of these measurements has not been sufficient for a useful biomarker in AD [1]. We hypothesize that it is partly due to the fact that most of these studies have focused on the stationary measures of functional connectivity, which ignores the complicated dynamic patterns of network configuration that exist in the brain. To address this shortcoming, here we propose a novel, reliable technique to quantify dynamic functional connectivity in the DMN that is sensitive to the subject’s cerebrospinal fluid (CSF) Aβ biomarkers of AD.Methods
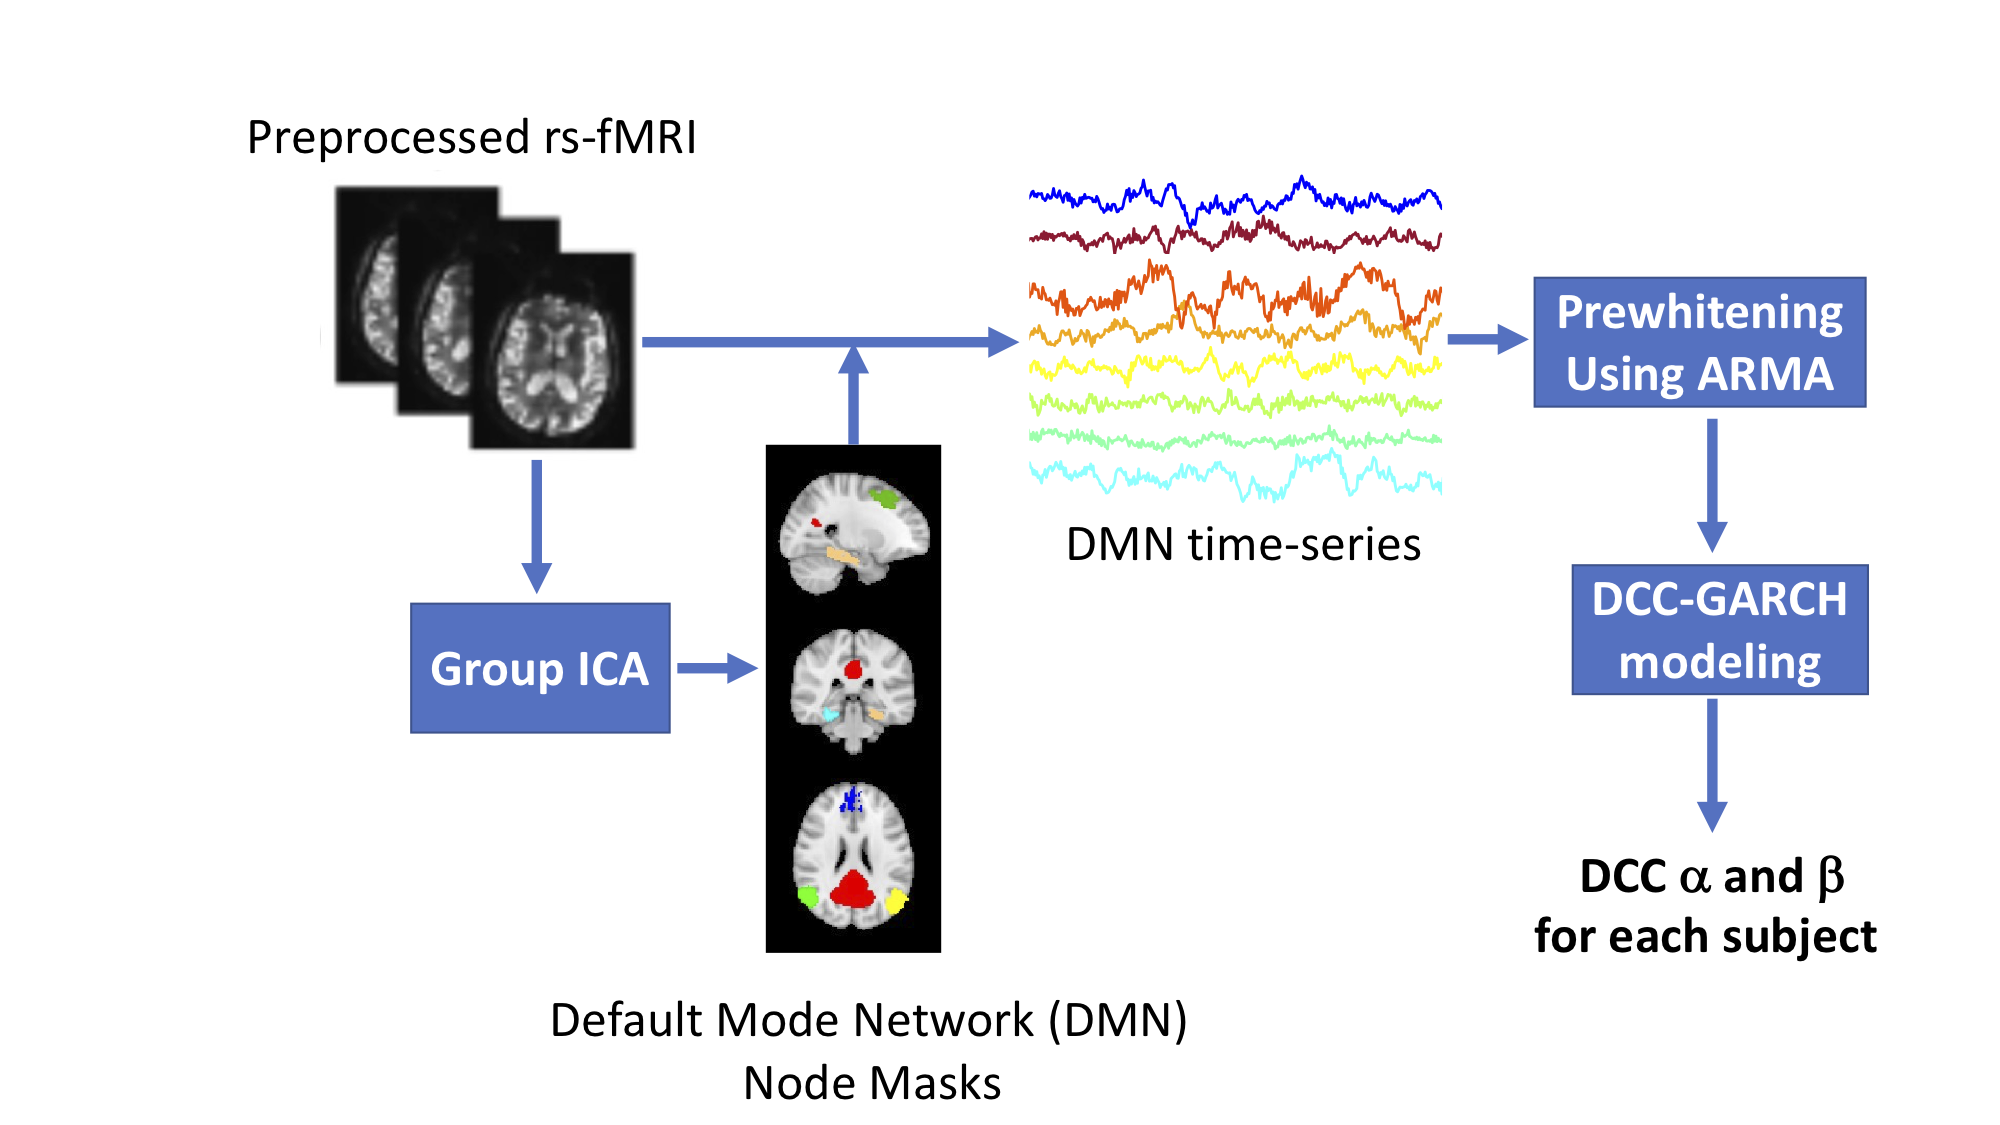
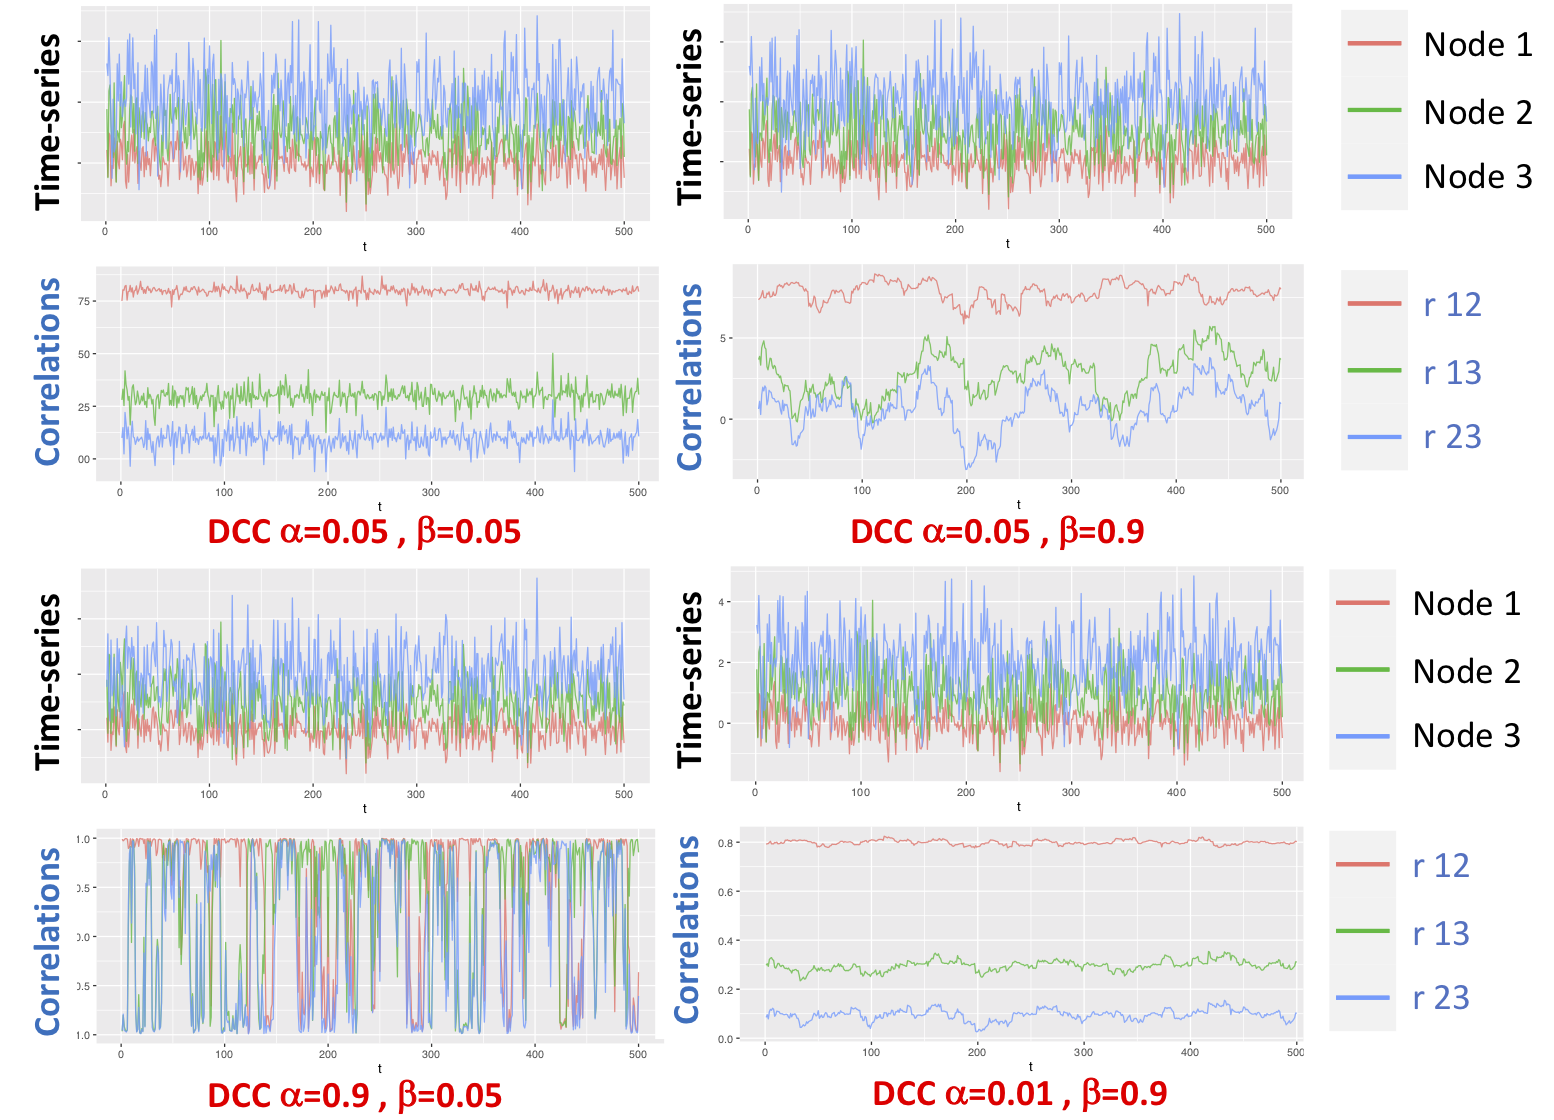
Data: 87 subjects (mean age= 74 yr, range = 54-91 yr) were recruited for this study. CSF was collected from all subjects via lumbar puncture and processed on a Millipore Milliplex MAP Human Aβ Panel. Subjects included 66 cognitively normal (38 women), 16 mild cognitive impairment (7 women), and 5 AD dementia (3 women) patients. We scanned all subjects on a 3T (Philips Achieva) scanner using a 32-channel head coil. Resting state fMRI (rs-fMRI) data was collected using a 2D Multi Echo EPI sequence (3.5 mm isotropic voxels, TR/TEs = 2,500/9.5, 27.5, 45.5 ms). Each rs-fMRI run acquired 240 time points of data (10 min). A structural T1-weighted 3D MPRAGE with 0.8 mm isotropic voxels was also obtained for co-registration. rs-fMRI data was preprocessed using TEDANA [2], motion corrected and spatially normalized to MNI space. In this study, we focused on the following DMN nodes: posterior cingulate cortex, medial prefrontal cortex, left and right angular gyrus, left and right dorsal medial prefrontal cortex, and left and right parahippocampal cortex. We created a mask for each of these nodes using a standard group-level ICA analysis performed across all subjects. Using these masks, the corresponding time-series were extracted for each node. Each time-series was pre-whitened using a data-driven ARMA model. For each times-series, the ARMA order was determined based on the Bayesian information criteria (BIC) [3]. We fit the ARMA model to each time-series separately and keep the residuals from this model as the pre-whitened data. The dynamic functional connectivity was then quantified using the Dynamic Condtional Correlation (DCC)-GARCH Model (Figure 1).DCC-GARCH model: is a flexible tool to model the temporal variation in the second moment of a multivariate time-series [4]. More specifically, DCC-GARCH model allows the correlation matrix to depend on time and describe a plausible mechanism for the temporal variation of the correlation matrix. The two major parameters of the model (referred to as α and β in this abstract) provide a straightforward representation of how fast the correlations variate, and how volatile the correlations can be. α represents how the correlation matrix show dynamic variations as a response to new stimulates, and β represents how stable the correlation matrix is over time. The simulation presented in Figure 2, shows how these parameters represent different correlational structures of dynamic time-series data (Figure 2).
Results
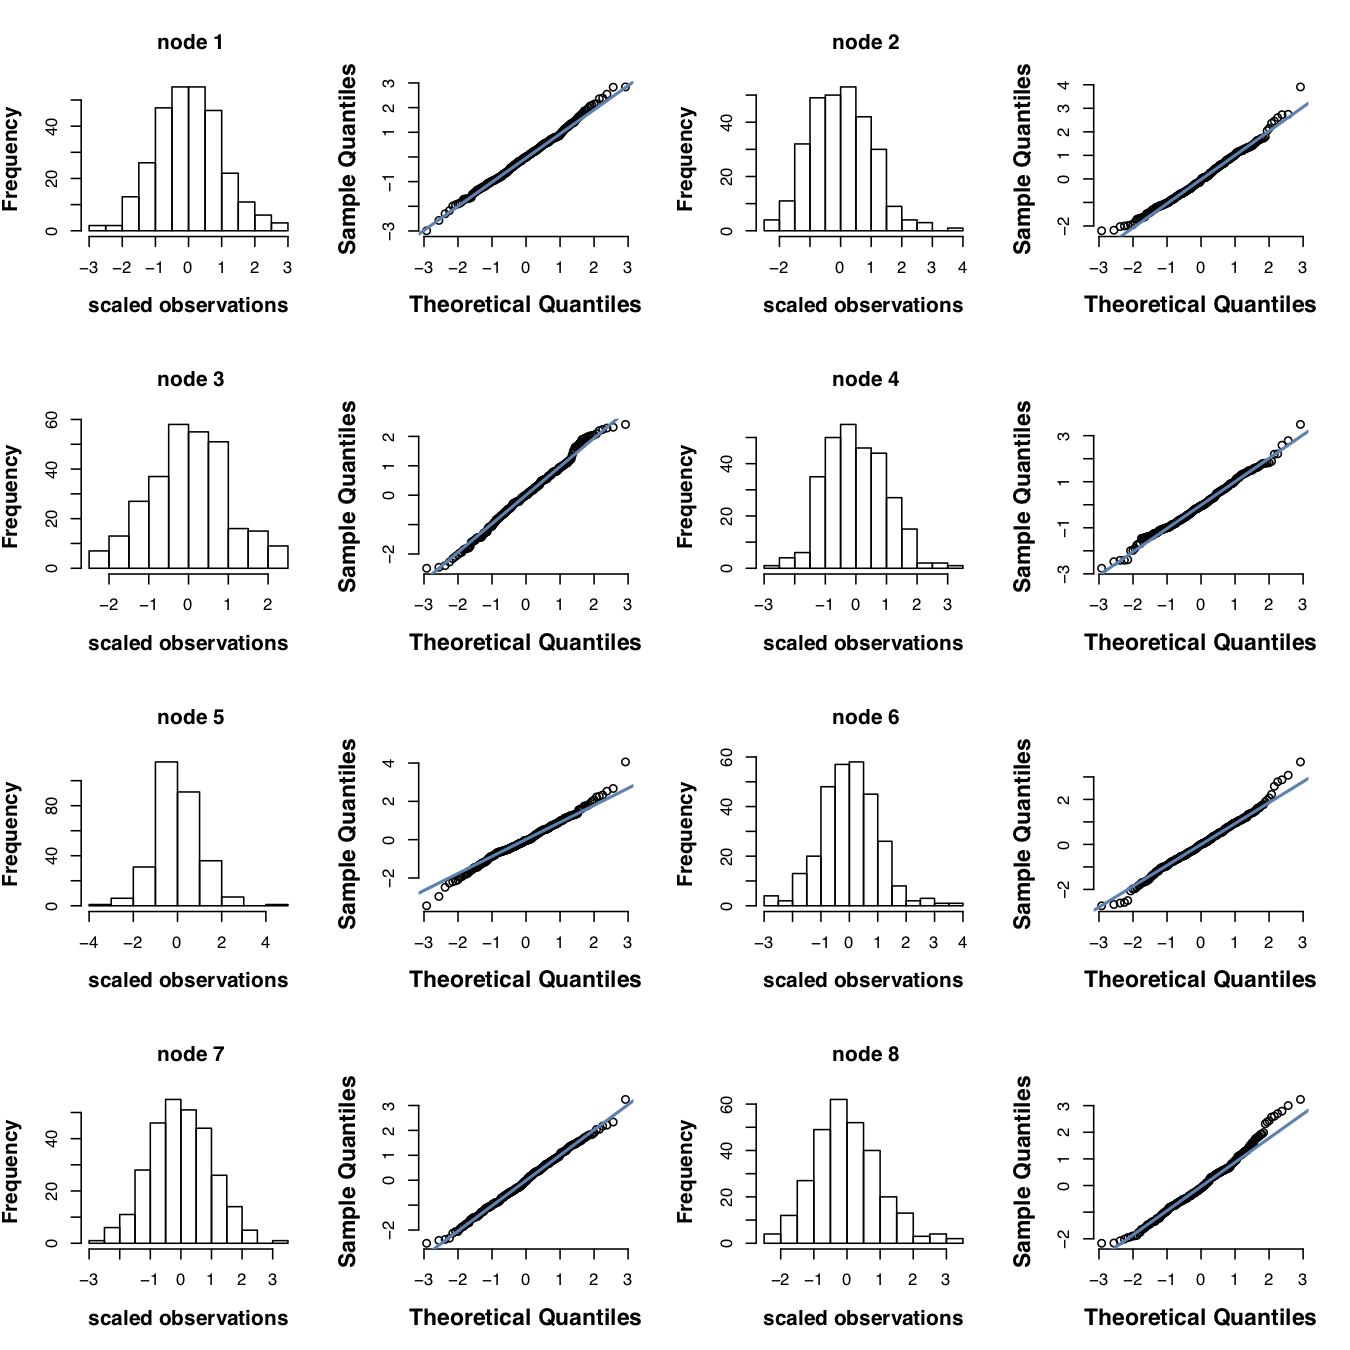
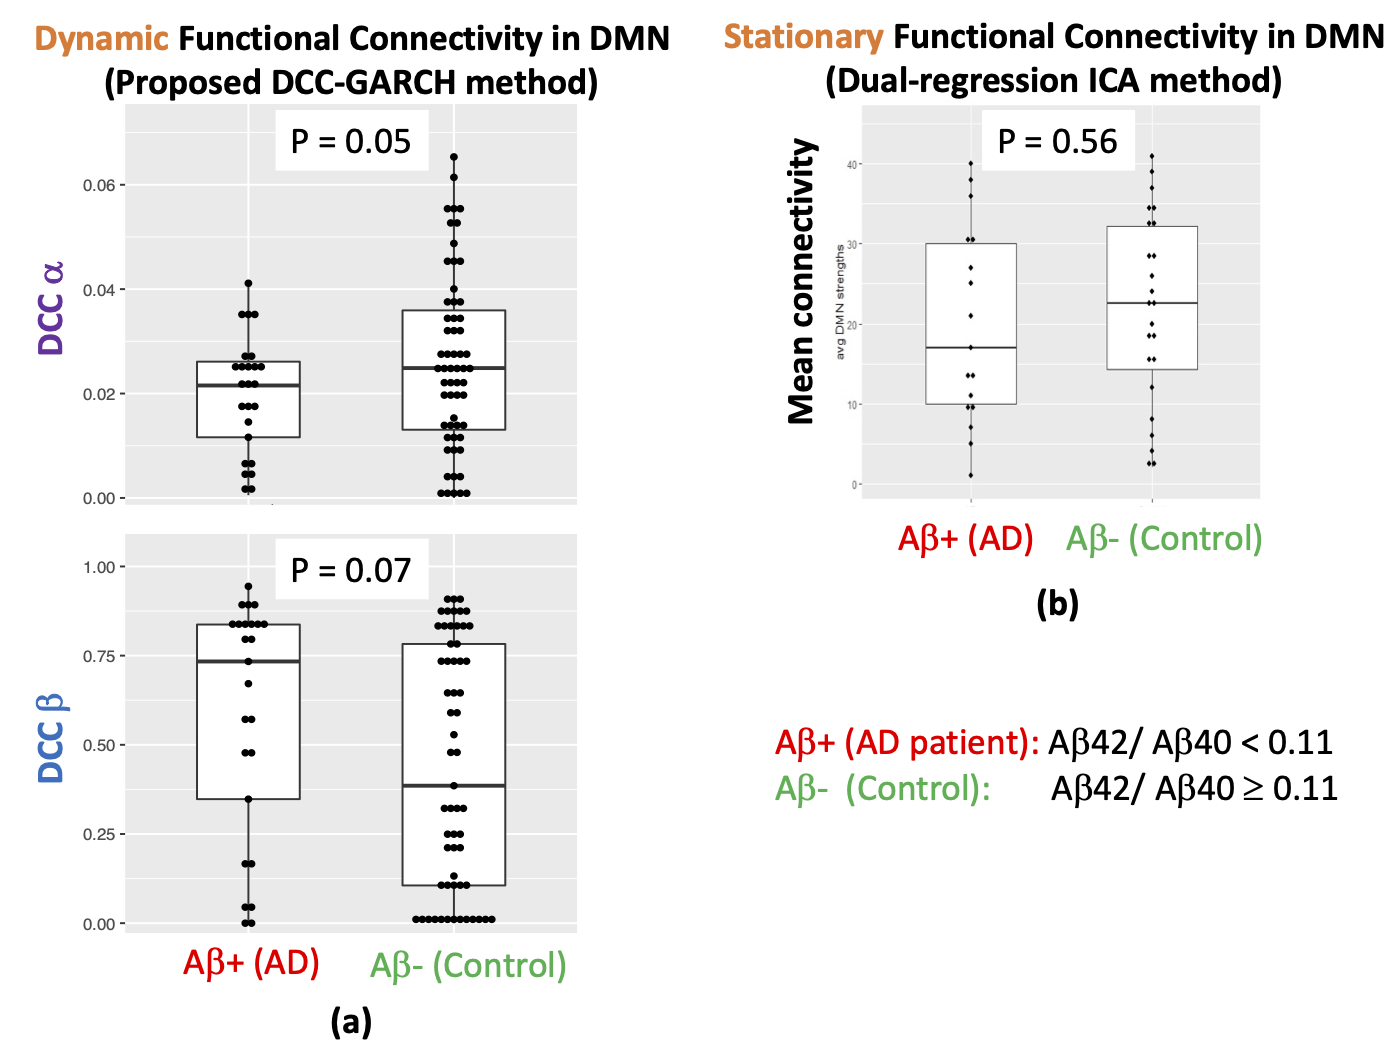
We inspected the distribution of the observations to choose the distributional assumption in the DCC model (Figure 3) and used normal distribution assumption for the error terms when fitting the DCC model. For each subject we quantified the dynamic functional connectivity of DMN using the DCC model and calculated the α and β parameters. We divided the subjects into two group based on their CSF Aβ42/40 ratio which is the most accurate CSF biomarker for Aβ positivity in clinical AD [5]. The internally determined [6] cut-off threshold of 0.11 was used for dividing subjects into Aβ+ (AD) and Aβ- (control) groups. p-value of two sample t-test was then calculated for evaluating the group difference in α and β parameter estimates. For comparison, we also measured the mean stationary measure of DMN connectivity for each subject using the dual regression ICA method [7] (Figure 4).Discussion
In this study we proposed a novel method based on the DCC-GARCH model to quantify dynamic functional connectivity. We used the proposed method to quantify the dynamic functional connectivity in the DMN and investigated its sensitivity to Aβ status of the subjects, determined by their CSF Aβ measurements. Unlike conventional stationary measures of the DMN functional connectivity, the proposed method was sensitive to the CSF Aβ status of the subjects. Our results show that AD patients (i.e. Aβ+ subjects) have lower α and higher β values (i.e. less dynamic and more invariant connectivity in the DMN over time) compared with controls (Aβ- subjects). These preliminary findings need to be confirmed in larger cohorts.Conclusion
This study suggests that dynamic functional connectivity in the DMN, quantified using the proposed method, may provide a sensitive, non-invasive biomarker to differentiate between Aβ+ and Aβ- subjects and improve our ability to detect and apply treatments in earlier stages of AD.Acknowledgements
This work is supported by the University of Washington Alzheimer’s Disease Research center pilot project award, Weill Neurohub, and NIH grants P50 AG047366 and 1K01AG071798-01.References
[1] Teipel SJ, Metzger CD, Brosseron F, Buerger K, Brueggen K, Catak C, Diesing D, Dobisch L, Fliebach K, Franke C, Heneka MT, Kilimann I, Kofler B, Menne F, Peters O, Polcher A, Priller J, Schneider A, Spottke A, Spruth EJ, Thelen M, Thyrian RJ, Wagner M, Düzel E, Jessen F, Dyrba M; DELCODE study group. Multicenter Resting State Functional Connectivity in Prodromal and Dementia Stages of Alzheimer's Disease. J Alzheimers Dis. 2018;64(3):801-813.
[2] Kundu, P., Inati, S. J., Evans, J. W., Luh, W. M., and Bandettini, P. A. (2012). Differentiating BOLD and non-BOLD signals in fMRI time series using multi-echo EPI. Neuroimage 60, 1759–1770.
[3] Clifford M Hurvich and Chih-Ling Tsai. Regression and time series model selection in small samples. Biometrika, 76(2):297–307, 1989.
[4] Robert Engle. Dynamic conditional correlation: A simple class of multivariate generalized autoregressive conditional heteroskedasticity models. Journal of Business & Economic Statistics, 20(3):339–350, 2002.
[5] Lewczuk P, Matzen A, Blennow K, Parnetti L, Molinuevo JL, Eusebi P, Kornhuber J, Morris JC, Fagan AM. Cerebrospinal Fluid Aβ42/40 Corresponds Better than Aβ42 to Amyloid PET in Alzheimer's Disease. J Alzheimers Dis. 2017;55(2):813-822.
[6] Forlenza OV, Radanovic M, Talib LL, Aprahamian I, Diniz BS, Zetterberg H, Gattaz WF. Cerebrospinal fluid biomarkers in Alzheimer's disease: Diagnostic accuracy and prediction of dementia. Alzheimers Dement (Amst). 2015;1(4):455-63.
[7]
Filippini, N., MacIntosh, B. J., et al. (2009)
Distinct patterns of brain activity in young carriers of the APOE-epsilon4
allele. Proc Natl Acad Sci U S A 106,
7209-14.
Figures