0997
Predictive modelling and center effects: towards a robust functional connectivity-based neuromarker of pain sensitivity1Laboratory of Predictive Neuroimaging, Institute for Diagnostic and Interventional Radiology and Neuroradiology, University Hospital Essen, Essen, Germany, 2Klinik für Neurologie, University Hospital Essen, Essen, Germany, 3Department of Neurology, University of Szeged, Szeged, Hungary, 4Institut für Klinische Neurowissenschaften und Medizinische Psychologie, Heinrich Heine Universität, Düsseldorf, Germany, 5Neurozentrum, Bezirksklinikum Mainkofen, Deggendorf, Germany
Synopsis
Center effects significantly limit the generalizability of brain imaging-based biomarker candidates. Although our previously published resting state functional connectivity-based predictive signature for pain sensitivity (the RPN-signature) showed remarkable out-of-center generalizability, it remained unclear which connectivity features are the most generalizable across study centers.
Here, we re-trained the RPN-signature on multi-center data and found that it outperforms the single-center model in all three centers (explained variance: 26-38% vs. 16%-19%). Our results highlight that neurobiological interpretation of feature importance in predictive modelling is constrained both by center-specific artifacts and by certain characteristics (e.g. regularization) of the applied machine learning algorithm.
Introduction
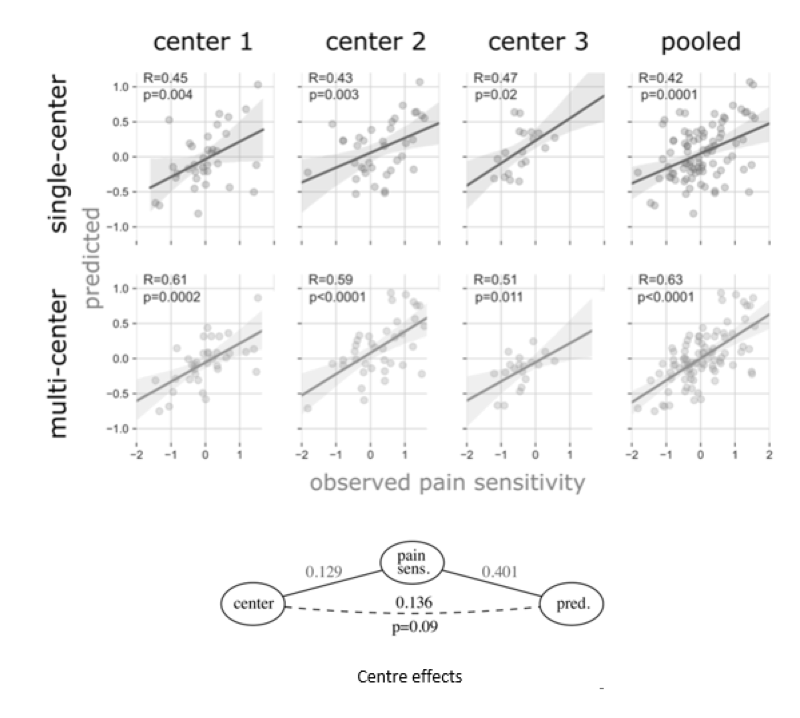
Large sample sizes pave the way for many important discoveries in neuroscience1. A common way to increase sample size is to pool data from multiple study centers. However, center-effects may undermine the robustness of predictive models2. Model training performed solely on data of a single study center might capture strongly center-specific characteristics and, therefore, display a poor out-of-center generalizability. In a previous work3, we have identified the ‘Resting state Pain sensitivity Network’ (RPN) signature; a predictive model of individual pain sensitivity, based on resting state functional connectivity as measured with magnetic resonance imaging (rsfcMRI). The RPN-signature was trained on data from a single imaging center4,5 and externally validated on data of two other centers. While the RPN-signature showed a remarkable out-of-center generalizability, it remained unclear which predictive features of the RPN-signature are the most generalizable across study centers. To address these questions, we re-trained the RPN-signature on multi-center data and contrasted the architecture of the multi- and the single-center models to identify brain connectivities that are robustly associated with pain sensitivity, regardless of study center.Methods
We re-analyzed functional connectivity data of three studies involving a total of N = 116 healthy young volunteers recruited in three separate studies, as described previously3. The individual-level functional connectivity data was fed into a machine learning pipeline with feature selection and Elastic net regression, incorporated into a nested cross validation framework, using folds that are balanced across centers.Outer cross-validation predictions were collected and contrasted to the observed pain sensitivity values by calculating the mean absolute and mean squared errors, the explained variance and Pearson’s correlation coefficient. P-values for the correlation coefficients were calculated with permutation tests. Center-bias (i.e. between-center differences in the target variable being predicted by center differences, rather than neurobiologically relevant features) has been evaluated with our recently proposed partial confounder test, as implemented in the python package ‘mlconfound’2.Results
The unbiased estimates of predictive performance showed that the multi-center model robustly outperformed its previously reported3 single-center sibling (pooled explained variance: 38.2% vs. 16.4%). The multi-center model’s predictions were more accurate in each study center, including data from center 1, on which the single-center model was trained. Predictions of both models are depicted on Figure 1. Partial confounder testing2 revealed that the predictions of the multi-center model were not significantly biased for the study center (p=0.09). Nine connections and 31 regions were overlapping between the single-center and multi-center signature (Figure 2).Discussion
Here we report an objective, unbiased brain-based measure of pain sensitivity, based on multi-center functional brain connectivity data acquired during pain-free resting-state.While overlapping characteristics of the two models are promising candidates for generalizable predictors of pain sensitivity, investigating the differences between the two models also highlight several important considerations for interpreting predictive models.
Several differences may be attributed to imaging artifacts; e.g. susceptibility artefacts in the prefrontal areas6, motion artefacts at tissue boundaries (likely e.g. in the parietal operculum/posterior middle temporal gyrus) and at spatially distant connections7 and lower signal-to-noise values in the subcortical areas8.
An additional source of differences is probably to be found in methodological aspects.
As the model is built on a large number of collinear features, the single model coefficients may be sensible to small stochastic perturbations in the input data, especially with L1 model regularization. As the reported predictive model, therefore, may highlight only the tip of the iceberg, we raise caution for interpreting the predictive connections of the investigated models as a comprehensive representation of the neural mechanisms shaping individual pain sensitivity.
Acknowledgements
This research was supported by the Deutsche Forschungsgemeinschaft (DFG, German Research Foundation) – Projektnummer 316803389 – SFB 1280 and TRR 289 Treatment Expectation - Projektnummer 422744262.References
1. Elliott, L. T. et al. Genome-wide association studies of brain imaging phenotypes in UK Biobank. Nature 562, 210–216 (2018).
2. Spisak, T. Statistical quantification of confounding bias in predictive modelling. 12–14 (2021).
3. Spisak, T. et al. Pain-free resting-state functional brain connectivity predicts individual pain sensitivity. Nat. Commun. 11, (2020).
4. Zunhammer, M. et al. Combined glutamate and glutamine levels in pain-processing brain regions are associated with individual pain sensitivity. Pain 157, 2248–2256 (2016).
5. Neumann, L. et al. Network properties and regional brain morphology of the insular cortex correlate with individual pain thresholds. Hum. Brain Mapp. 1–13 (2021). doi:10.1002/hbm.25588
6. Stenger, V. A. Technical considerations for BOLD fMRI of the orbitofrontal cortex. The orbitofrontal cortex 423–446 (2006).
7. Spisák, T. et al. Voxel-Wise Motion Artifacts in Population-Level Whole-Brain Connectivity Analysis of Resting-State fMRI. PLoS One 9, e104947 (2014).
8. Maugeri, L. et al. Assessing denoising strategies to increase signal to noise ratio in spinal cord and in brain cortical and subcortical regions. J. Instrum. 13, (2018).
Figures
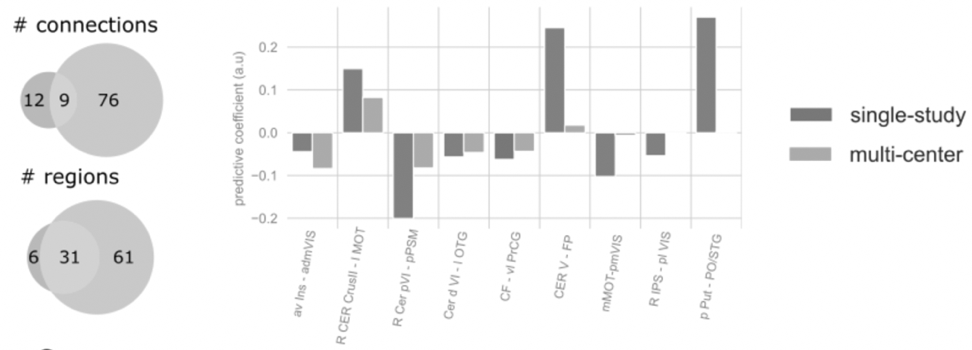
Overlap between the single-center and multi-center signatures.
Abbreviations: Cer: cerebellum; roman numbers: cerebellar lobes; mean GM: mean grey matter signal; PSM: pre/supplementary motor cortex; OTG: occipitotemporal gyrus; PrCG: precentral gyrus; FP: frontal pole; IPS: intraparietal sulcus; Put: putamen; PO: parietal operculum; STG: superior temporal gyrus. Prefix: L: left, R: right, a: anterior, p: posterior, v: ventral, d: dorsal, l: lateral, m: medial.