0996
Characterizing spectral and temporal effects of heart rate variability on resting-state BOLD signals using wavelet transform coherence1Department of Neurology, University of California, Davis, Davis, CA, United States, 2Department of Radiology, Harvard Medical School, Boston, MA, United States, 3Massachusetts General Hospital, Athinoula A. Martinos Center for Biomedical Imaging, Boston, MA, United States, 4Department of Biomedical Engineering, University of California, Davis, Davis, CA, United States
Synopsis
Heart rate variability (HRV), which is reflective of autonomic regulation, induces vascular effects in low (0.05-0.15Hz) and high (0.15-0.4Hz) frequency bands that can influence the blood oxygen level dependent (BOLD) signal of resting-state functional magnetic resonance imaging (rsfMRI). In this study, we utilized a wavelet transform coherence analysis to identify spectral and temporal differences in phased-locked behavior between HRV and resting-state network (RSN) time courses. Subjects differed in the frequency band with greatest time-averaged coherence and percentage of time with significant coherence of HRV and RSN signals.
Introduction
The blood oxygen level dependent (BOLD) signal of resting-state functional magnetic resonance imaging (rsfMRI) is modulated by local neuronal activity and systematic autonomic dynamics, such as heart rate variability (HRV), which induce vascular effects1. HRV, defined as changes in instantaneous heart rate (HR), is reflective of autonomic regulation and is commonly divided into lower (0.05-0.15Hz) and higher (0.15-4Hz) frequency fluctuations in HR2. Although nuisance regression of cardiac signals is often performed in preprocessing of functional connectivity analyses, altered autonomic states may drive spatial, temporal, and spectral differences in the covariance of cardiac and brain network dynamics that are not addressed in regression. In this study, we employ the wavelet transform coherence (WTC) method to characterize how the coherence of HRV with resting-state network (RSN) fluctuations varies, spectrally and temporally, across participants.Methods
Three healthy subjects (aged 26±3years, 1 female) were scanned using a 3T Siemens Magnetom Skyra scanner with a 32-channel receive head coil. A 10-minute rsfMRI scan, where the subject was instructed to close their eyes and remain awake, was acquired using a gradient-echo simultaneous multi-slice EPI sequence (TR/TE=500/26.8ms, multi-band=6, GRAPPA acceleration=2, flip angle=60°, FOV=260mm, matrix=88x88x48, 48 slices, slice thickness=3mm, resolution=2.4x2.4x4.0mm3). After brain extraction3 and motion correction4, functional images were registered to their corresponding whole-brain high-resolution T1-weighted structural image (resolution=1.0x1.0x1.0mm3), which was then normalized to the MNI-152 brain template4. No physiological denoising was performed. The average HR per repetition time (TR) was calculated from pulse oximetry measurements sampled at 200Hz from the fingertip during the resting-state scan5.Each subject’s functional data was decomposed into 30 spatial components using independent component analysis6. The default mode network (DMN), frontoparietal network (FPN), and visual network (VN) were identified as the components with highest spatial overlap (dice coefficient) with the respective RSN template7. White matter (WM) and cerebrospinal fluid (CSF) regions, which are more vascularly influenced, were identified through structural segmentation8. The rsfMRI time courses of RSNs and WM/CSF regions, and HR time courses were demeaned and variance normalized.
Continuous wavelet transformation of each time series to time-frequency space was performed using the Morlet wavelet with frequency ω0=6 for which the Fourier period is approximately equal to the wavelet scale. Wavelet transform coherence (WTC) analysis was then performed to evaluate the coherence between each region’s time course (DMN, FPN, VN, WM, CSF) and HR as a function of time and frequency9,10. WTC measures phase-locked behavior between two time series as an R2 value between 0 and 1. A Monte Carlo approach with 300 bootstrapped time series was used to test statistical significance of WTC magnitude.
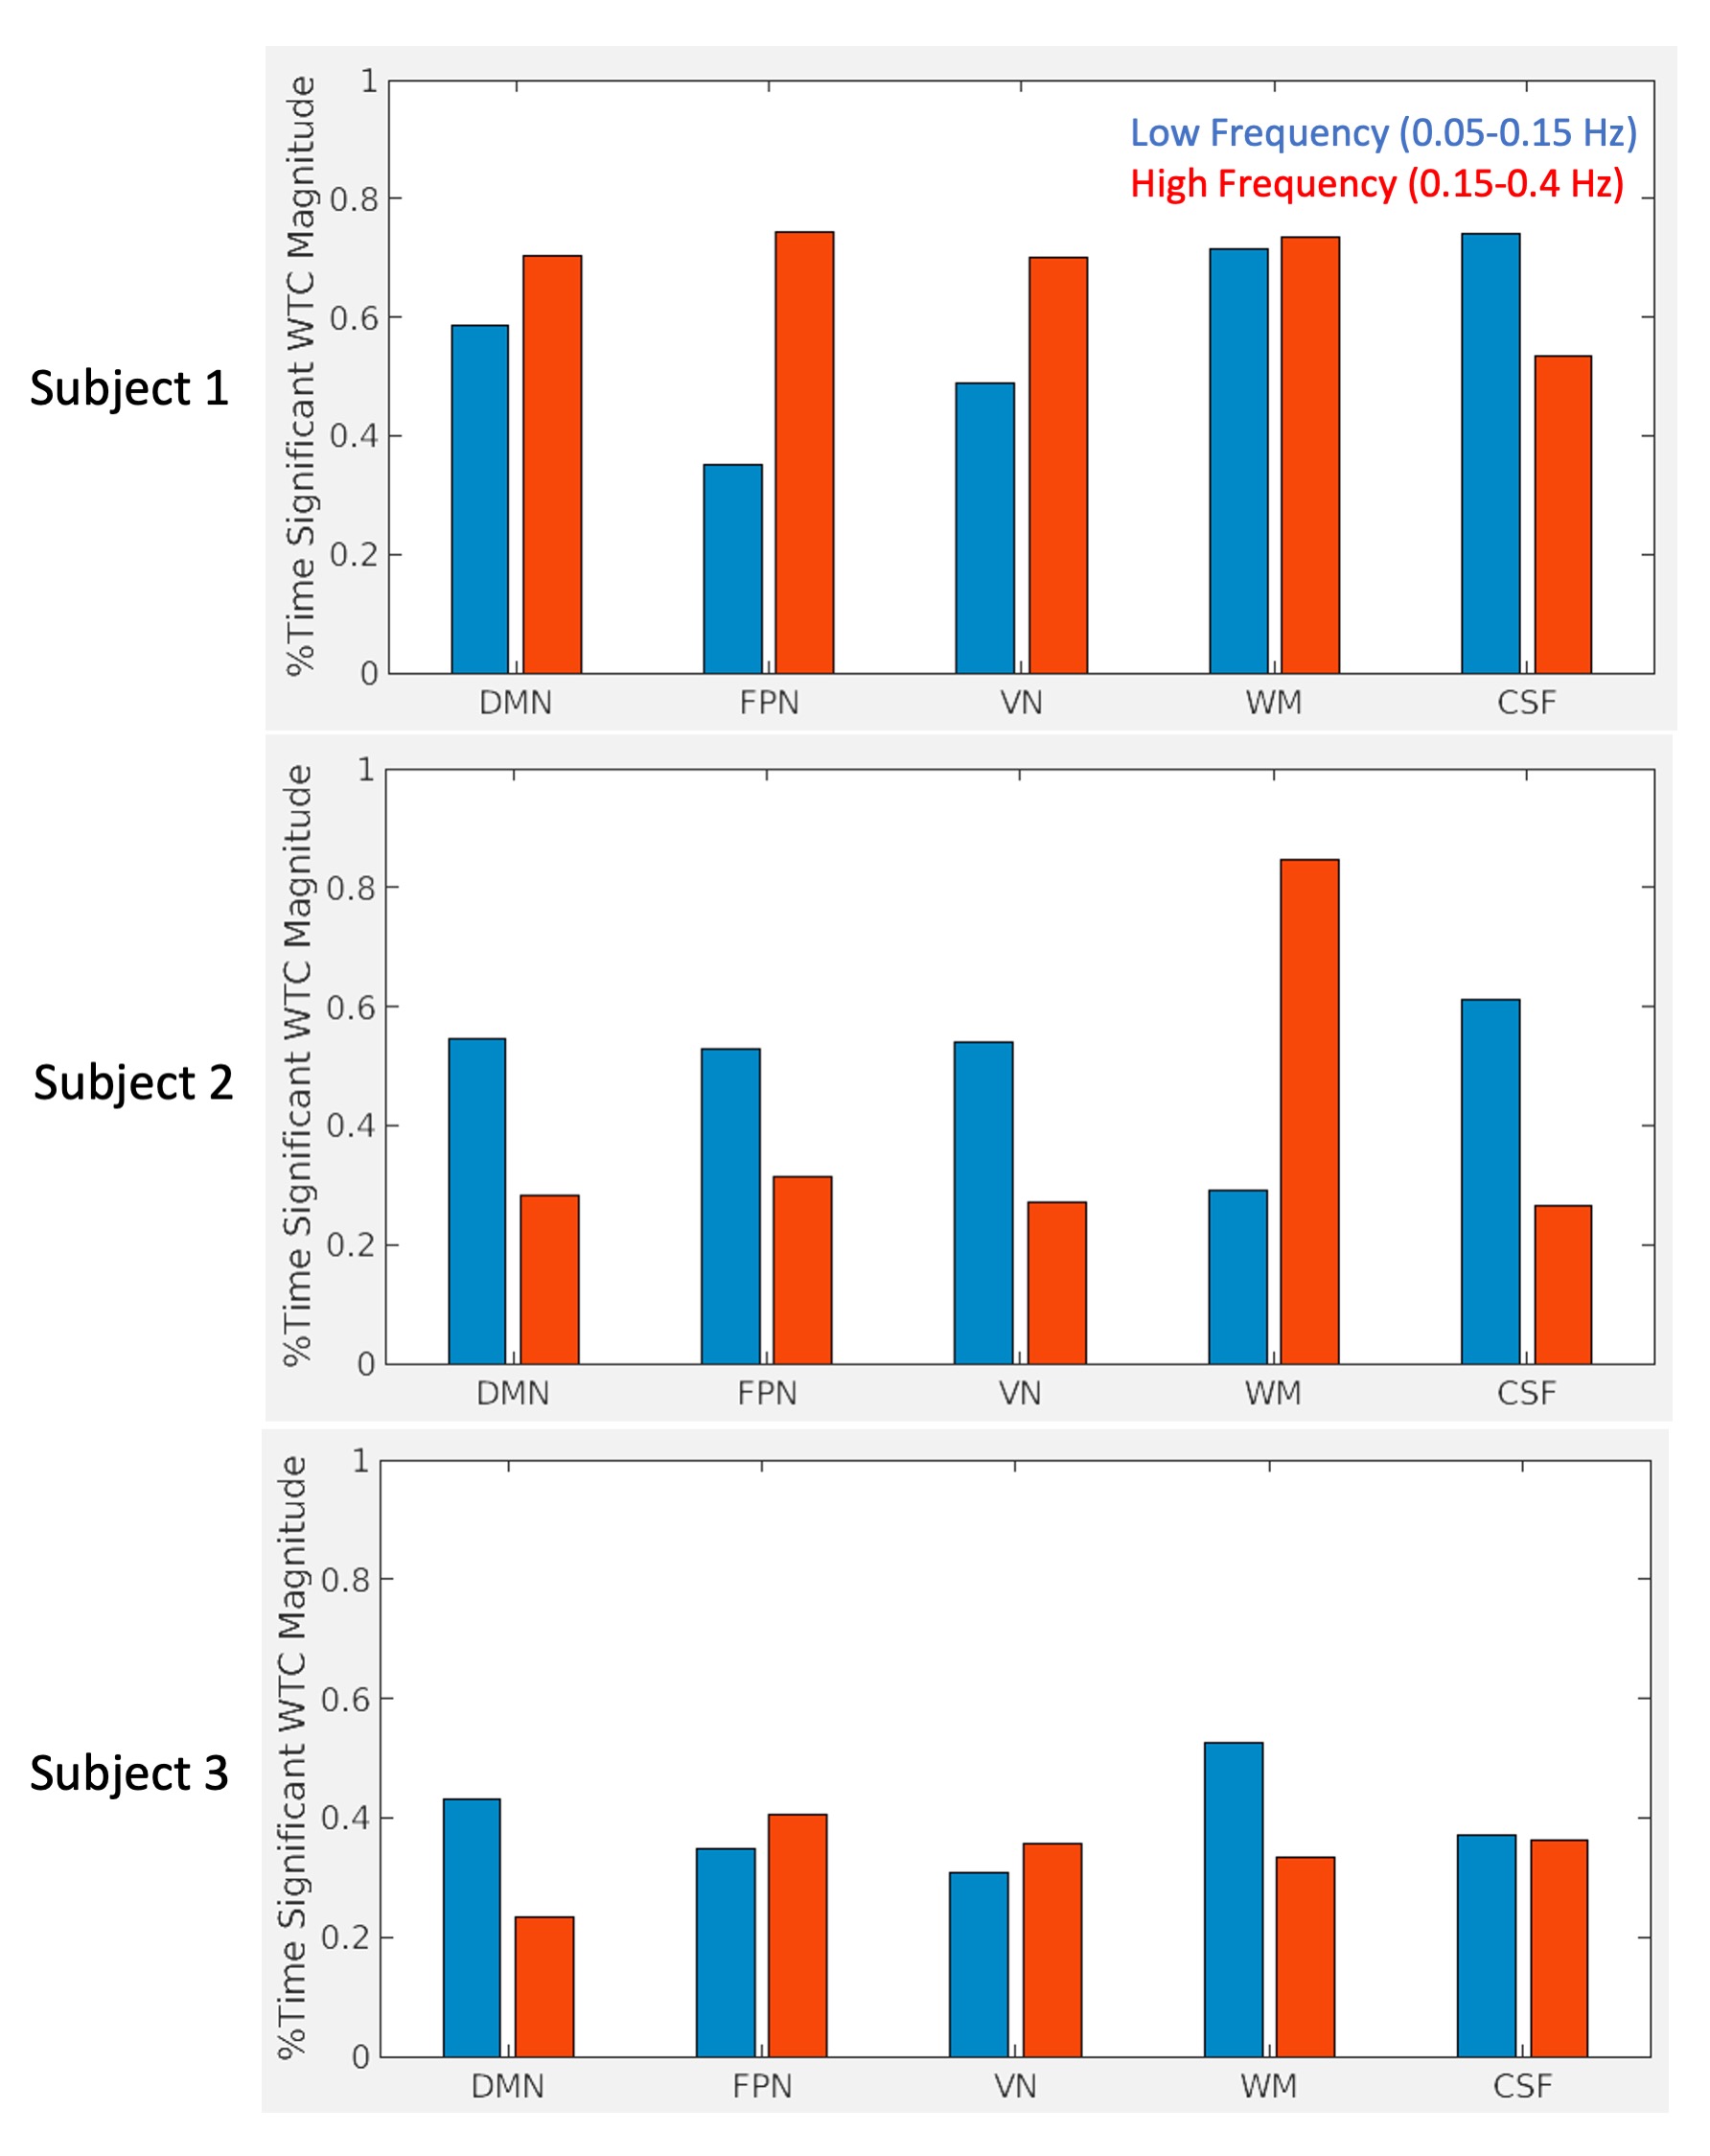
To evaluate overall spectral trends, WTC magnitude was averaged across all time points for each frequency of the wavelet scale. To quantify temporal dynamics of observed spectral trends, the percentage of timepoints with significant (>95%) WTC magnitude was compared between low (0.05-1.5Hz) and high (0.15-0.4Hz) frequencies of HRV.
Results
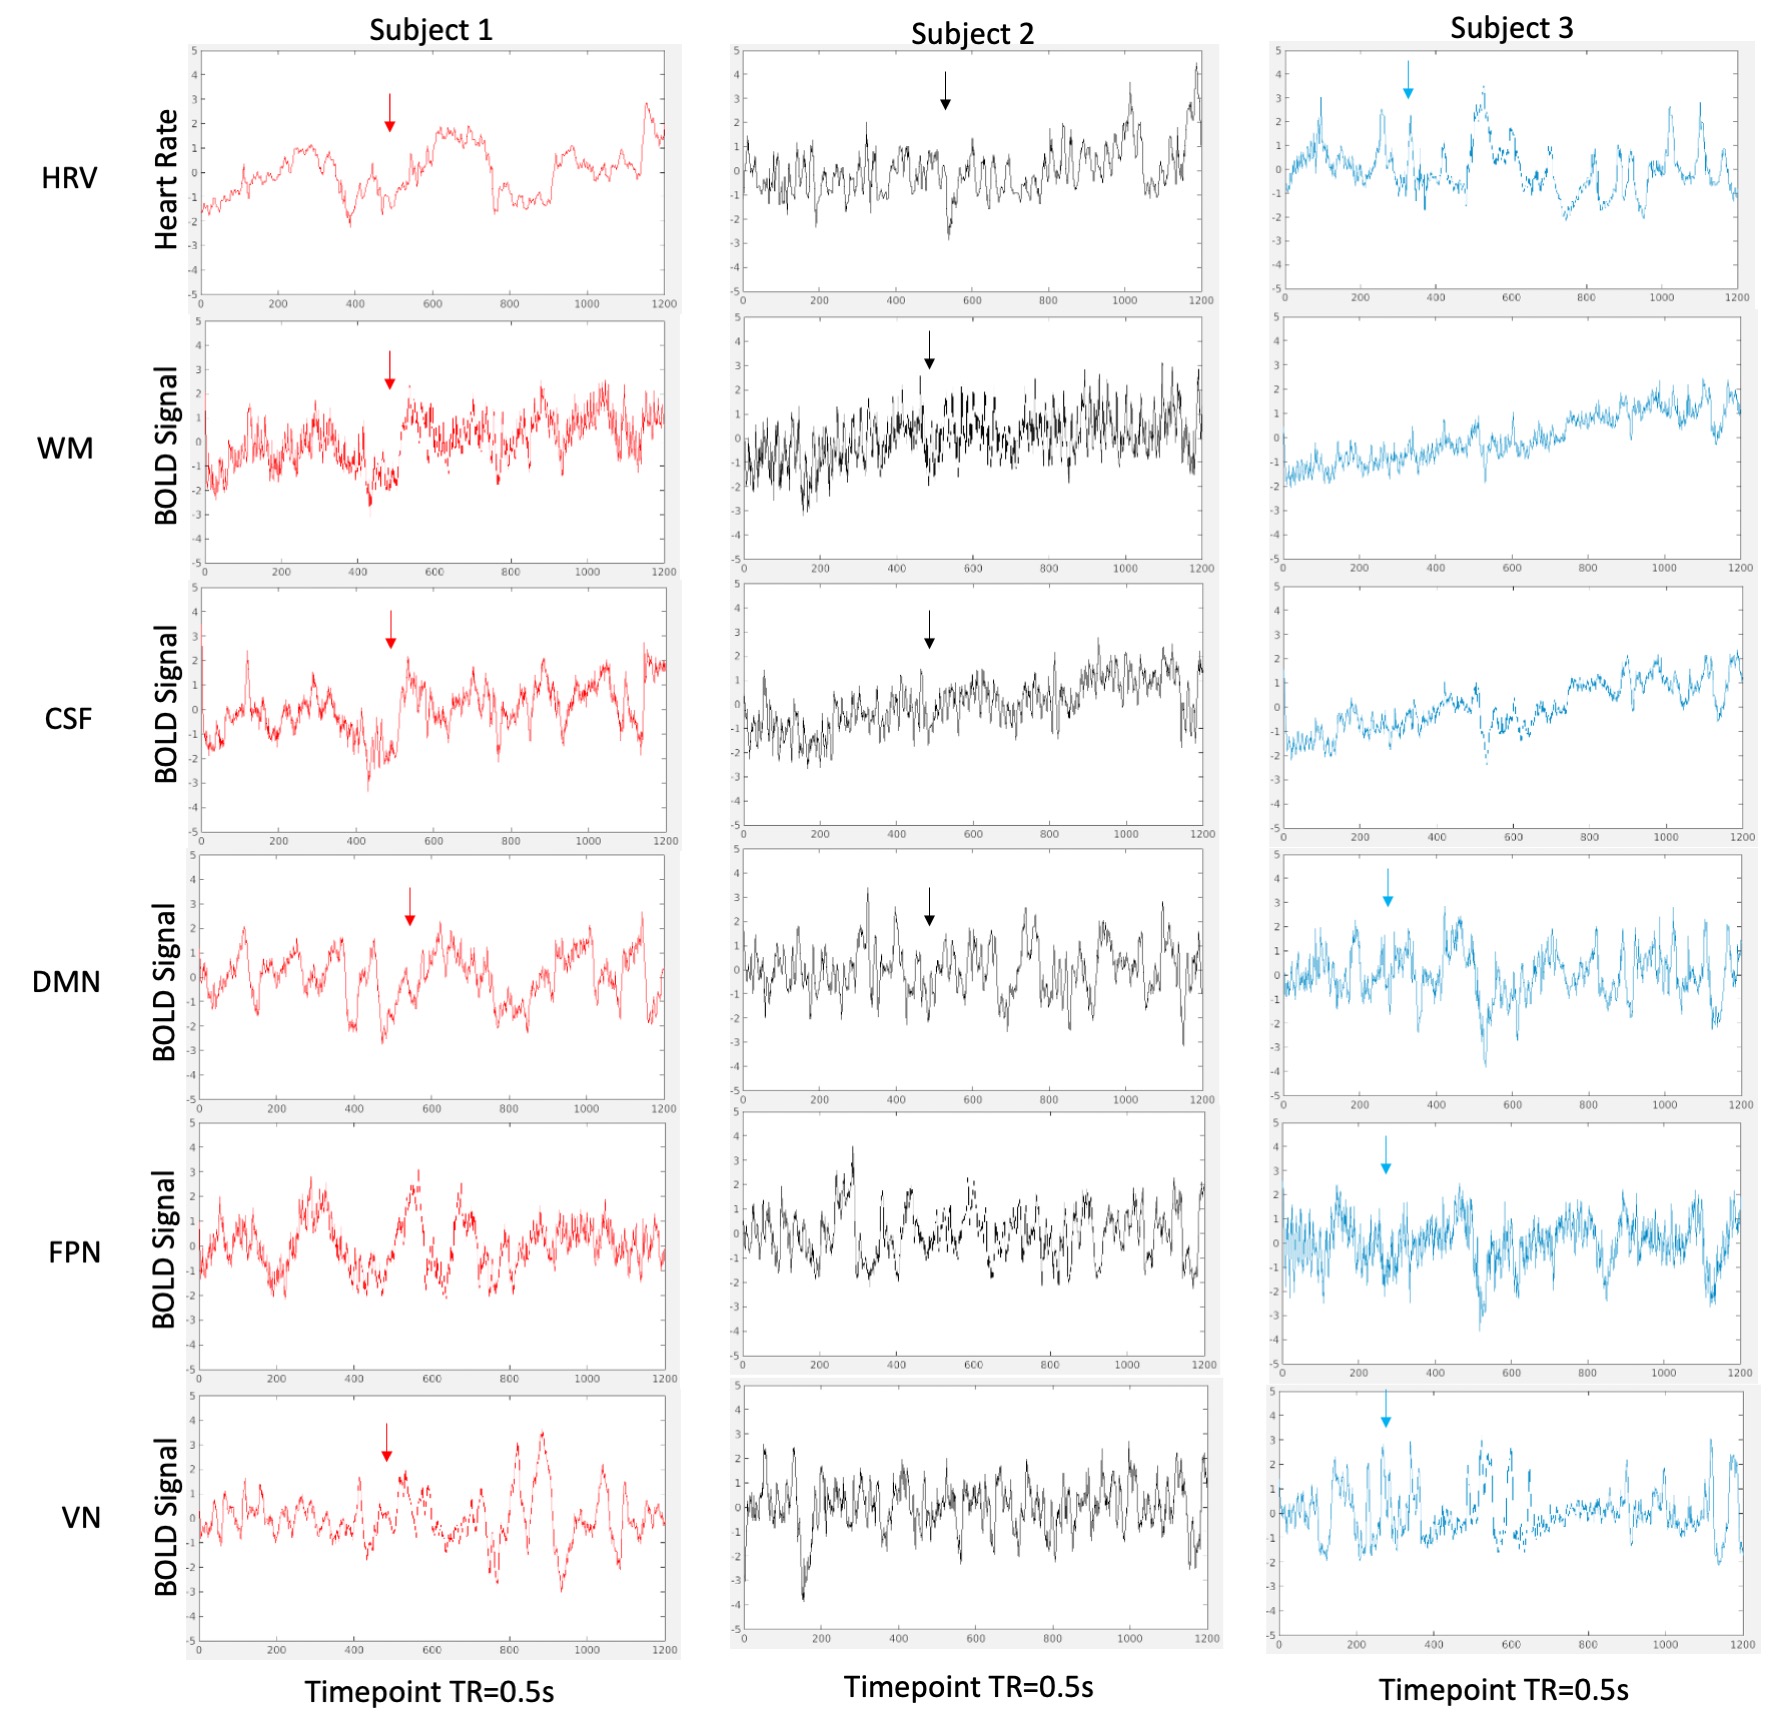
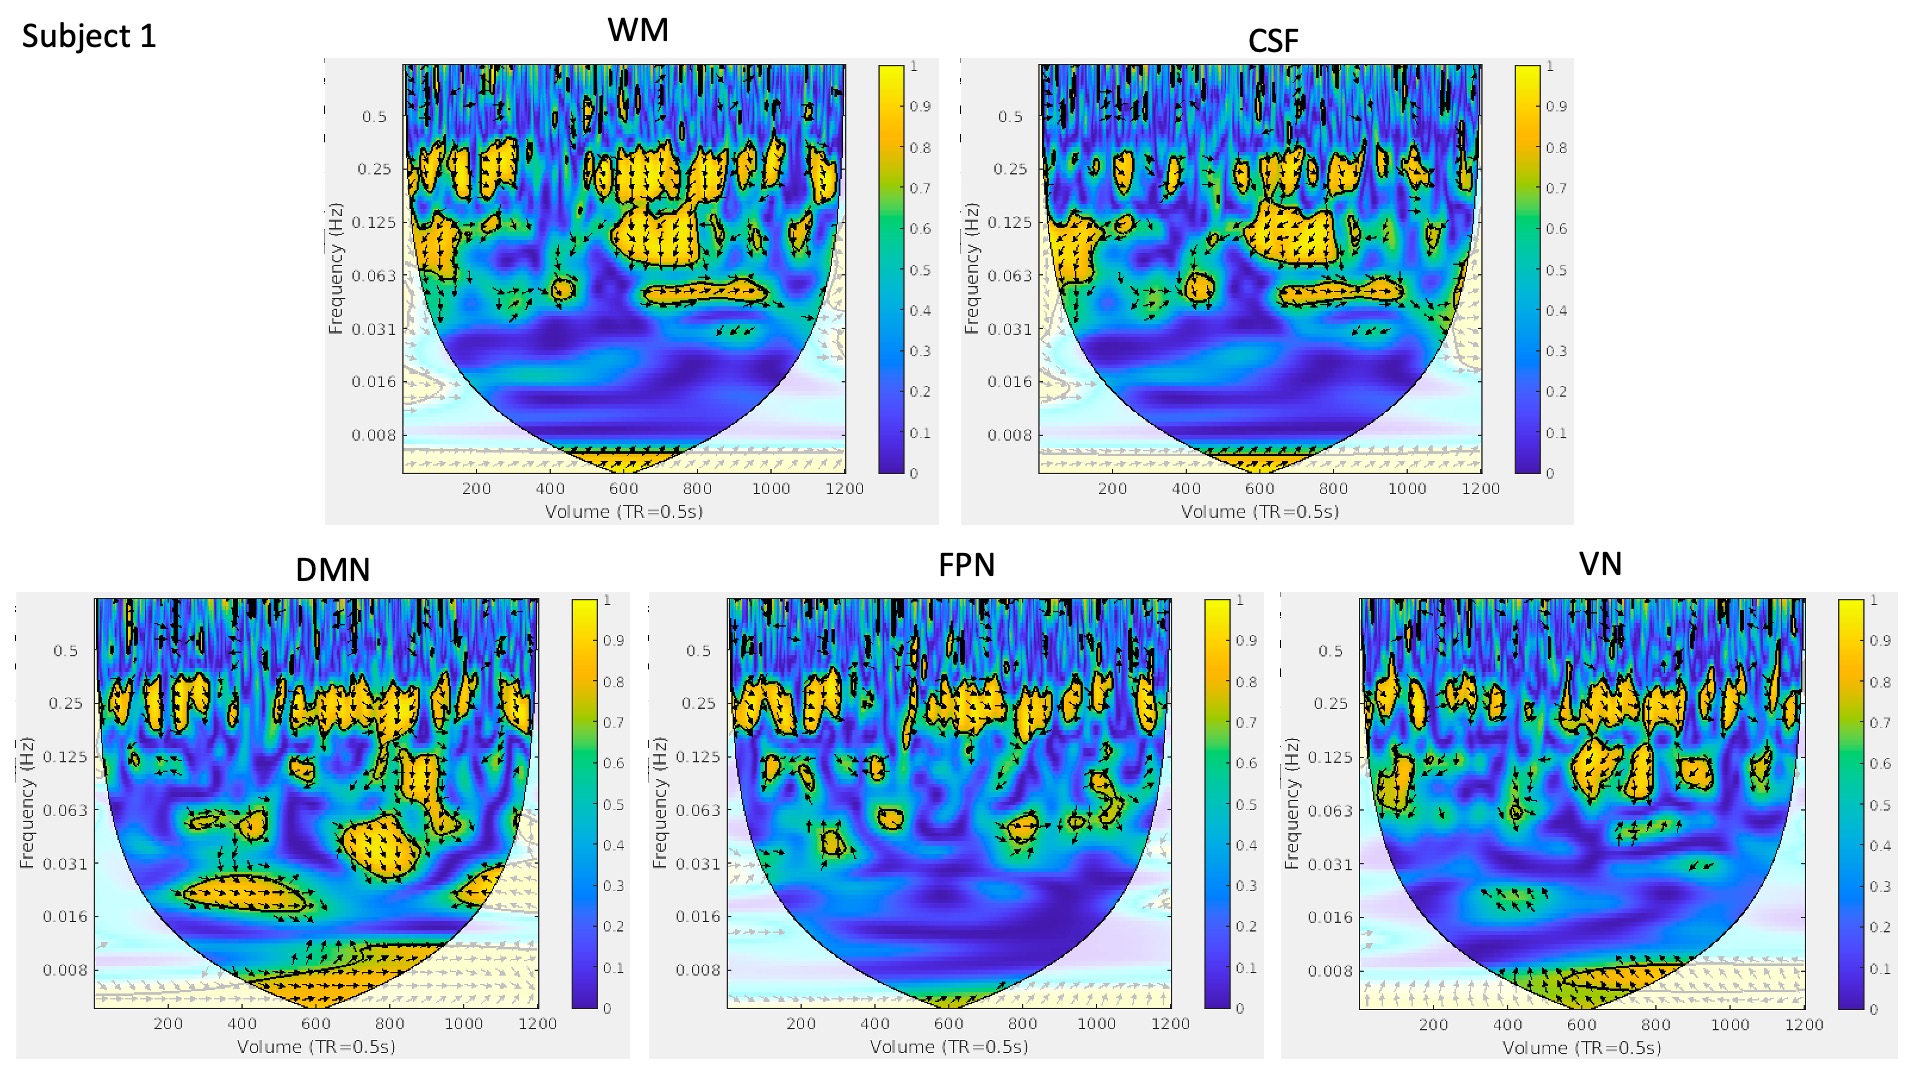
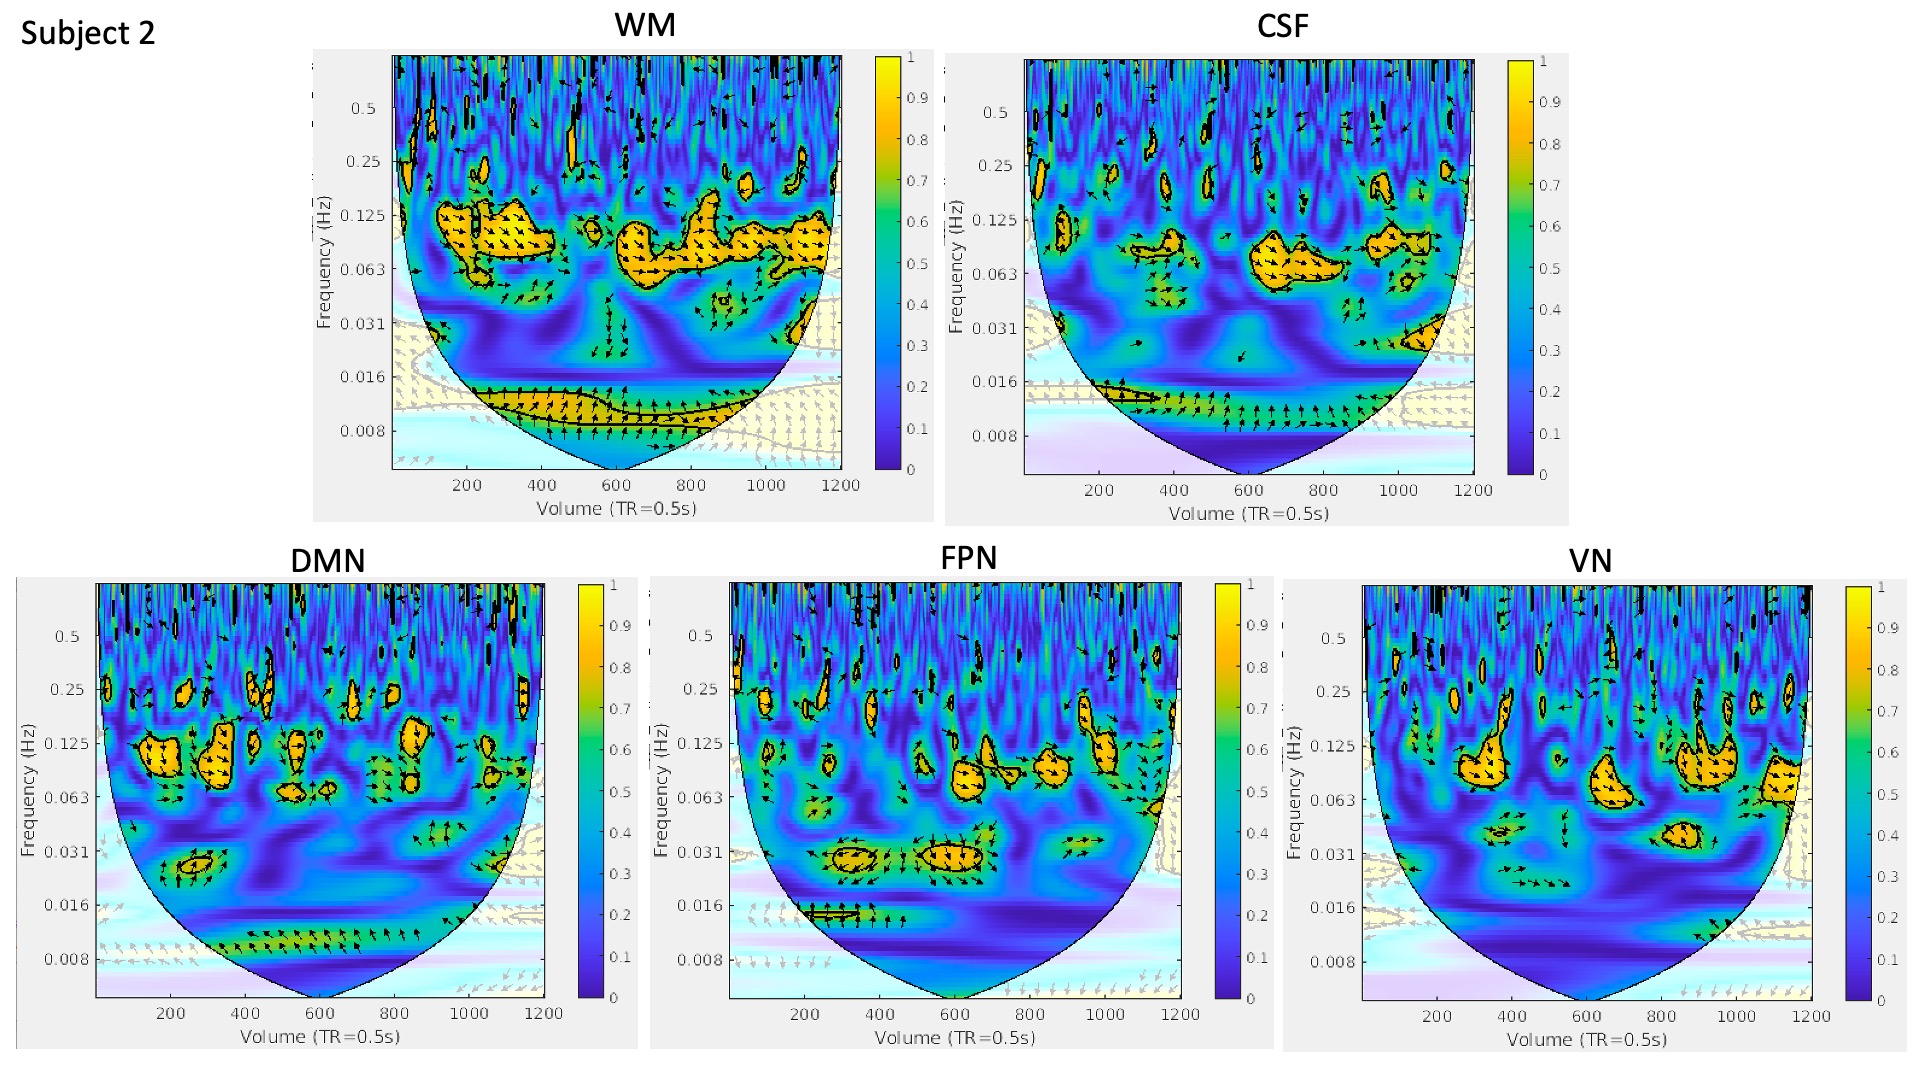
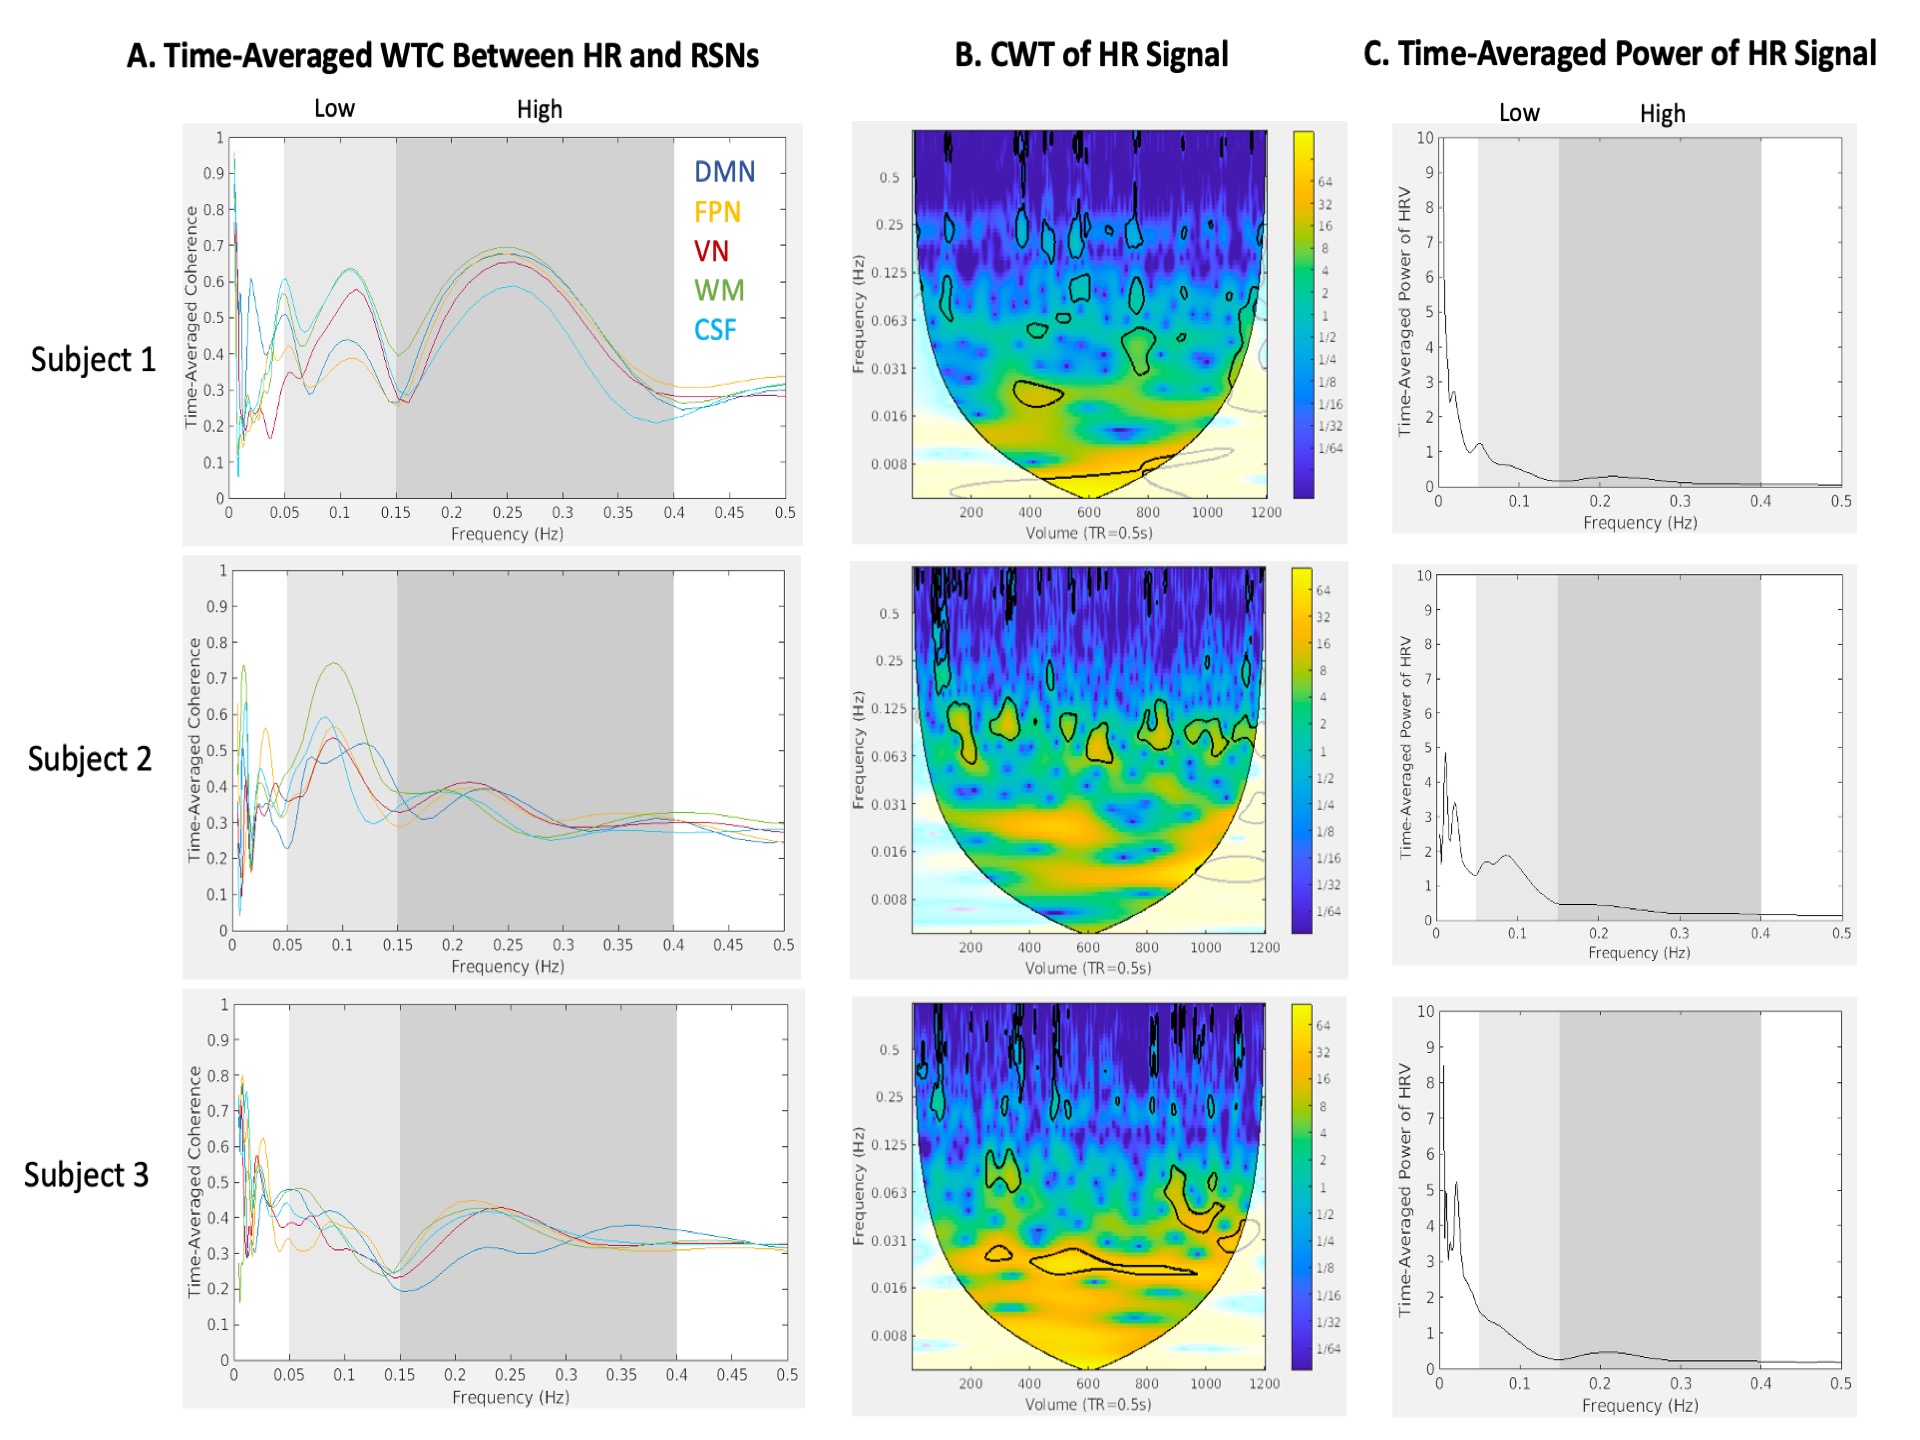
Visual similarity was apparent between HR and network time courses for all subjects. However, the frequency content and temporal distribution of frequency content of HRV and coherence between HRV and regional BOLD dynamics differed between subjects (Figure 1). WTC plots highlight two strong frequency bands of coherence present for a large portion of scan duration in all regions (Figures 2,3).WTC analysis revealed two frequency bands of high time-averaged coherence magnitude between HR and rsfMRI signals, which match the common high and low frequency fluctuations of HRV (Figure 4A). However, the distribution of coherence magnitude between frequency bands differed between subjects. Subject 1 showed robust peaks in time-averaged coherence magnitude at both high and low frequency bands, with increased time-averaged coherence magnitude with HRV in the higher frequency band for all RSNs. Subject 2 also showed peaks in time-averaged coherence magnitude at both frequency bands, but increased time-averaged coherence magnitude in the lower frequency band, where there was notably higher HR power (Figures 4B,C), for all RSNs. For Subject 3, the frequency band with greater time-averaged coherence magnitude differed between networks. The power distribution of HRV shows higher power in the lower frequency band than in the higher frequency band for all subjects (Figures 4B,C).
Moreover, the percentage of scan duration demonstrating significant phase-locked behavior differed between frequency bands across subjects (Figure 5). For all RSN signals, Subject 1 showed significant coherence with HRV for a greater percentage of time in the higher frequency band, while Subject 2 showed significant coherence with HRV for a greater percentage of time in the lower frequency band. The frequency band exhibiting greater percentage of time with significant coherence varied between RSNs for Subject 3.
Discussion
The coherence of HRV and RSN signals is significant in two major frequency bands of HRV: low frequency (0.05-0.15Hz) and high frequency (0.15-0.4Hz). The frequency band with greater time-averaged coherence and greater percentage of time with significant coherence varies between subjects and is not explained solely by HRV power distribution.Conclusion
The effect of HRV on RSN signals varies spectrally and temporally between subjects. WTC provides a valuable visualization of these signal coherences in time and frequency dimensions to define these differences. A joint analysis with alternative autonomic dynamics (e.g. respiration) may help delineate HR-specific influences on BOLD signals.Acknowledgements
This study was supported by NIH R00-NS102884.References
1. Attarpour, A., Ward, J., Chen, J.J., Vascular origins of low-frequency oscillations in the cerebrospinal fluid signal in resting-state fMRI: Interpretation using photoplethysmography. Human Brain Mapping. 2021;42(8):2602-2622.
2. Rajendra Acharya, U., Paul Joseph, K., Kannathal, N. et al. Heart rate variability: a review. Med Bio Eng Comput. 2006;44:1031–1051.
3. Jenkinson, M., Pechaud, M., and Smith, S. BET2: MR-based estimation of brain, skull and scalp surfaces. In Eleventh Annual Meeting of the Organization for Human Brain Mapping, 2005.
4. Jenkinson, M., Bannister, P., Brady, J. M. and Smith, S. M. Improved Optimisation for the Robust and Accurate Linear Registration and Motion Correction of Brain Images. NeuroImage. 2002;17(2), 825-841.
5. Kasper, L., et al. The PhysIO Toolbox for Modeling Physiological Noise in fMRI Data. Journal of Neuroscience Methods. 2017;276:56-72.
6. Beckmann, C.F., Smith, S.M., Probabilistic Independent Component Analysis for Functional Magnetic Resonance Imaging. IEEE Transactions on Medical Imaging. 2004;23(2):137-152.
7. Yeo BT, Krienen FM, Sepulcre J, et al. The organization of the human cerebral cortex estimated by intrinsic functional connectivity. J Neurophysiol. 2011;106(3):1125-1165.
8. Zhang, Y. and Brady, M. and Smith, S. Segmentation of brain MR images through a hidden Markov random field model and the expectation-maximization algorithm. IEEE Trans Med Imag, 2001;20(1):45-57.
9. Chang C., Glover G.H. Time-frequency dynamics of resting-state brain connectivity measured with fMRI. NeuroImage. 2010;50(1):81-98.
10. Grinsted, A., J. C. Moore, S. Jevrejeva (2004), Application of the cross wavelet transform and wavelet coherence to geophysical time series, Nonlin. Process. Geophys., 11, 561566.
Figures