0995
Comparing sliding window correlation and instantaneous phase coherence in fMRI dynamic functional connectivity analysis1Institute for Systems and Robotics, Instituto Superior Técnico, University of Lisbon, Lisbon, Portugal, 2Learning Health, Hospital da Luz, Lisbon, Portugal, 3Neurology Department, Hospital da Luz, Lisbon, Portugal, 4Life and Health Sciences Research Institute, University of Minho, Braga, Portugal
Synopsis
Sliding window Pearson correlation (SW) is the most commonly used approach for estimating dynamic functional connectivity (dFC). However, instantaneous phase coherence (PC) has gained popularity as it yields frame-by-frame dFC estimates. This work aimed to compare both metrics by analysing the mean lifetime, probability of occurrence and spatial similarity of dFC states with the canonical resting-state networks (RSNs). We found that the state lifetimes increase in SW compared to PC and with window length, worsening the detection of RSNs for smaller datasets. These findings indicate that the temporal blurring induced by SW compromises the ability to detect faster network dynamics.
Introduction
Dynamic functional connectivity (dFC) analysis of resting-state fMRI (rs-fMRI) data allows studying time-varying patterns of brain connectivity and detecting recurrent dFC states that resemble canonical resting-state networks (RSNs)1. Sliding window Pearson correlation (SW) has been the most commonly used approach for estimating dFC2. It provides a straightforward and robust method, but relies on the choice of a window length limiting its temporal resolution and statistical validity3. Instead, instantaneous phase coherence (PC) measures can be computed to obtain frame-by-frame dFC estimates, maximizing temporal resolution and hence potentially allowing the study of finer brain network dynamics4-6. These methods have previously been compared in terms of dFC temporal, topological and anatomical perspectives5,6. However, the resulting dFC states were not analysed. Moreover, PC was measured as the absolute value of the sine of the instantaneous phase difference, which has recently been shown to be unable to capture temporal transitions from positive to negative associations5. In this recent work5, the cosine of the instantaneous phase difference was shown to overcome this issue and outperform other PC methods. Here, we use this definition of PC and compare it with SW in terms of the temporal and spatial properties of dFC states.Methods
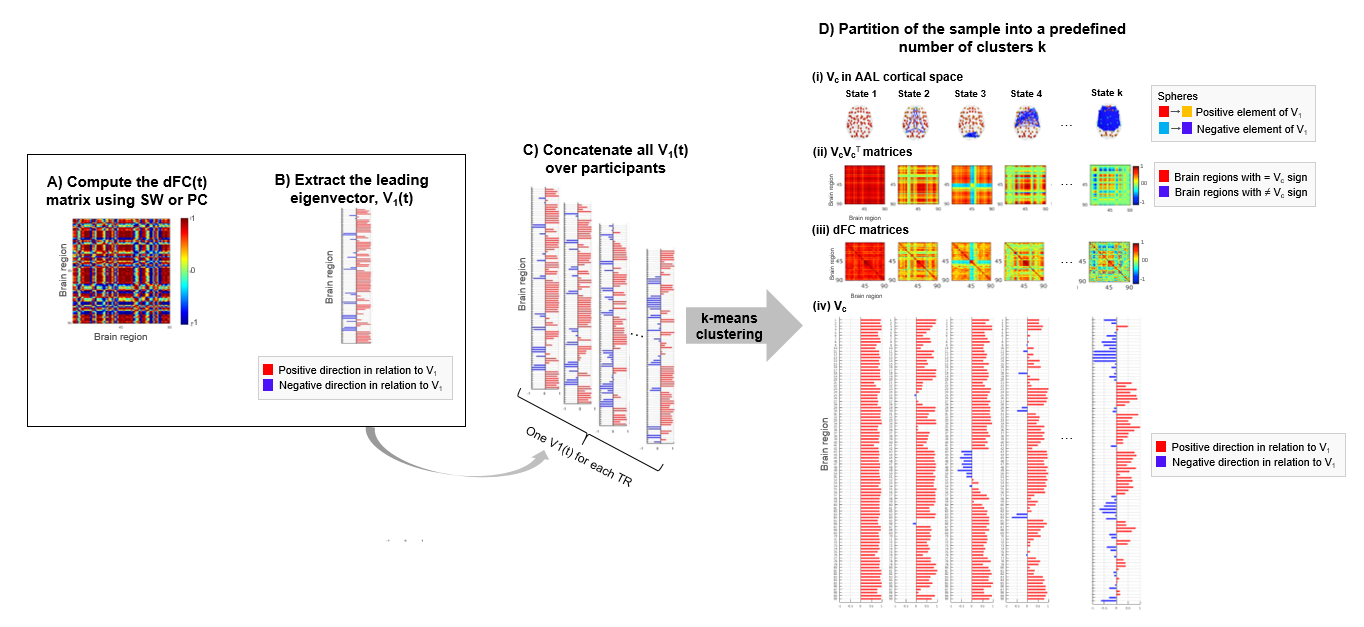
We used two resting-state fMRI datasets: a large dataset from the HCP database (HCP) and a smaller validation dataset from a local study (MIG_N2Treat). The HCP-dataset includes 99 healthy adults (54 females, 20-35 years old)7. rs-fMRI data were acquired on a 3T Siemens system using gradient-echo 2D-EPI (TR/TE=720/33ms, in-plane GRAPPA-2, 2.0mm isotropic resolution, 1250-volumes, 15-minutes, eyes open)8,9. The MIG_N2Treat-dataset includes 8 female patients with episodic migraine without aura and 6 healthy controls (31.4±8.5 years old). rs-fMRI data were acquired on a 3T Siemens MRI system using gradient-echo 2D-EPI (TR/TE=1260/30ms, in-plane GRAPPA-2, SMS-3, 60 slices, 2.2mm isotropic resolution, 333-volumes, 7-minutes, eyes open). Both datasets included a minimal preprocessing pipeline comprising distortion and motion correction and registration to MNI. The MIG_N2Treat-dataset included additional spatial smoothing (3mm FWHM), ICA denoising and nuisance regression (rigid-body motion parameters, motion outliers, and average white matter and cerebrospinal fluid signals). The pre-processed rs-fMRI data were parcellated using 90 Automated-Anatomical Labelling (AAL) atlas regions10 and band-pass filtered (0.01-0.1Hz) using a second-order Butterworth band-pass filter. dFC was estimated with: 1) SW using three window sizes (25TR, 35TR, 45TR) and constant step (1TR), and 2) PC defined as the cosine of the instantaneous phase difference4,5. Afterwards, the leading eigenvector dynamic analysis (LEiDA) was applied4: the dominant patterns of dFC matrices were captured by the leading eigenvectors at each TR (explaining more than 50% signal variance on average for both SW and PC), and k-means clustering was performed to identify dFC states for k between 3 and 15 (Fig. 1). For each k and dFC state, we computed: mean lifetime (MLT); probability of occurrence (PO); and spatial similarity with the canonical RSNs (Pearson correlation coefficients between the cluster centroid vector and the vectors corresponding to the canonical RSNs in AAL space11: visual (VN), somatomotor (SMN), ventral attention (VAN), dorsal attention (DAN), limbic (LN), frontoparietal (FPN) and default mode (DMN) networks).Results
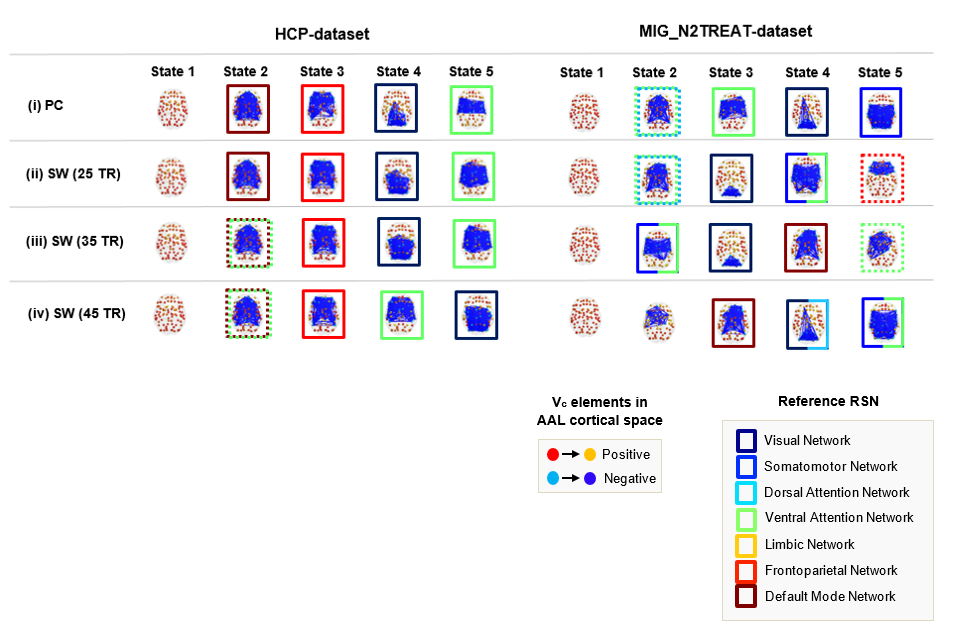
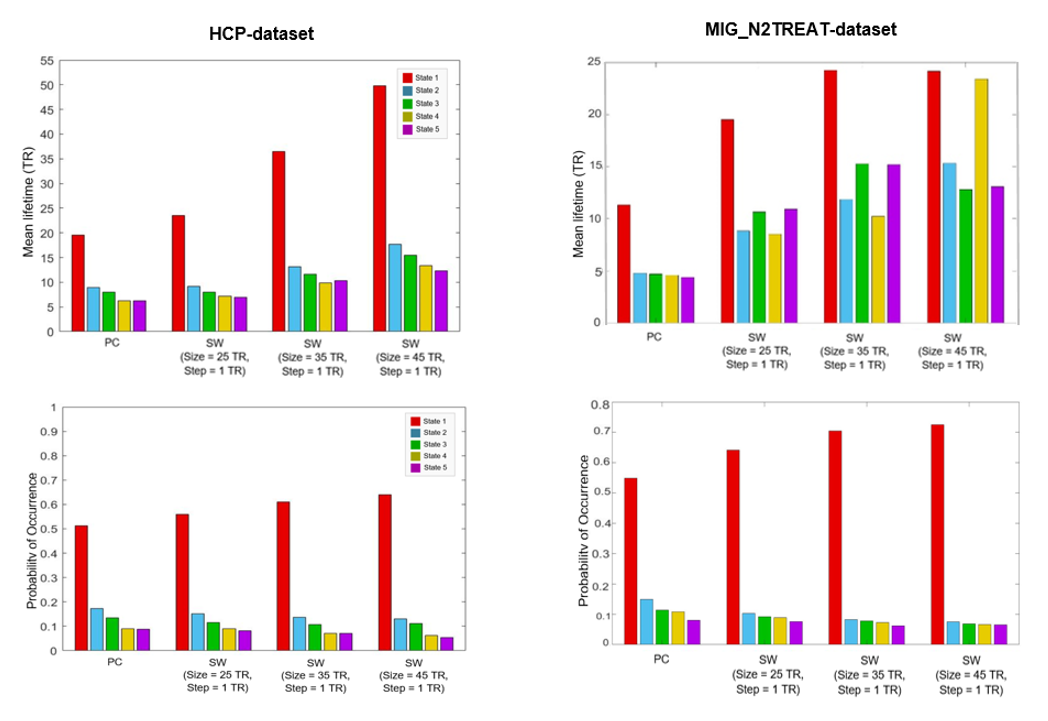
Results are presented for k-means clustering with k = 5, since this has been shown as an appropriate clustering solution to represent dFC data in previous studies4,12. Similar results were also found for other values of k. In terms of their spatial patterns (Fig. 2), dFC states were similar using SW and PC for the HCP-dataset, but differed slightly for the MIG_N2Treat-dataset. Besides state 1 (global mode), which corresponds to all brain regions with BOLD aligned phases, a number of RSNs could be identified in the subsequent states from the brain areas with BOLD phases deviating from the leading eigenvector and forming functional networks. For the HCP-dataset, VN, VAN, FPN and DMN are recovered by PC and SW, although some deviations occur for the longer window lengths. For the MIG_N2TREAT-dataset, dFC states show notable deviations between PC and SW methods. In terms of their temporal properties (Fig. 3), dFC states differed considerably between PC and SW for both datasets. The MLT of all dFC states increased with SW relative to PC and also with the window length, with a particularly strong effect for the global mode. The PO of the global mode also increased slightly from PC to SW and with window length, and was accompanied by a slight decrease for the other states.Discussion and Conclusion
We have shown that SW measures of dFC yield dFC states with significantly different temporal properties compared with instantaneous PC. Specifically, we found that the state lifetimes increased with window length, indicating that the temporal blurring induced by SW indeed compromises the ability to detect faster network dynamics. In parallel, the probability of occurrence of the global mode increases with SW and window length, while that of the other states decreases. The fact that dFC states identified using instantaneous dFC significantly resemble canonical RSNs suggests that the corresponding lifetimes and probabilities should be valid. Overall, our results are consistent with previous reports which emphasise the relevance of keeping the higher BOLD frequencies to detect the fast evolution of dFC12.Acknowledgements
FCT through grants PTDC/EMD-EMD/29675/2017, LISBOA-01-0145-FEDER-029675, UIDB/50009/2020.References
1R. M. Hutchison et al., “Dynamic functional connectivity: Promise, issues, and interpretations,” Neuroimage, vol. 80, pp. 360–378, Oct. 2013, doi: 10.1016/j.neuroimage.2013.05.079.
2M. G. Preti, T. A. Bolton, and D. Van De Ville, “The dynamic functional connectome: State-of-the-art and perspectives,” Neuroimage, vol. 160, no. December, pp. 41–54, 2017, doi: 10.1016/j.neuroimage.2016.12.061.
3E. Glerean, J. Salmi, J. M. Lahnakoski, I. P. Jääskeläinen, and M. Sams, “Functional Magnetic Resonance Imaging Phase Synchronization as a Measure of Dynamic Functional Connectivity,” Brain Connect., vol. 2, no. 2, pp. 91–101, Apr. 2012, doi: 10.1089/brain.2011.0068.
4J. Cabral et al., “Cognitive performance in healthy older adults relates to spontaneous switching between states of functional connectivity during rest,” Sci. Rep., vol. 7, no. 1, pp. 1–13, 2017, doi: 10.1038/s41598-017-05425-7.
5H. Honari, A. S. Choe, and M. A. Lindquist, “Evaluating phase synchronization methods in fMRI: A comparison study and new approaches,” Neuroimage, vol. 228, p. 117704, Mar. 2021, doi: 10.1016/J.NEUROIMAGE.2020.117704.
6M. Pedersen, A. Omidvarnia, A. Zalesky, and G. D. Jackson, “On the relationship between instantaneous phase synchrony and correlation-based sliding windows for time-resolved fMRI connectivity analysis,” Neuroimage, vol. 181, pp. 85–94, Nov. 2018, doi: 10.1016/J.NEUROIMAGE.2018.06.020.
7HCP database: https://www.humanconnectome.org/study/hcp-young-adult/data-releases. Accessed in 15 September 2021 at 19:20 PM.
8M. F. Glasser et al., “The Minimal Preprocessing Pipelines for the Human Connectome Project,” Neuroimage, vol. 80, p. 105, Oct. 2013, doi: 10.1016/J.NEUROIMAGE.2013.04.127.
9S. M. Smith et al., “Resting-state fMRI in the Human Connectome Project,” Neuroimage, vol. 80, pp. 144–168, Oct. 2013, doi: 10.1016/J.NEUROIMAGE.2013.05.039.
10Neurodata: https://github.com/neurodata/neuroparc/tree/master/atlases/label/Human. Accessed in 1 April 2021 at 15:00 PM.
11B. T. Thomas Yeo et al., “The organization of the human cerebral cortex estimated by intrinsic functional connectivity,” J. Neurophysiol., vol. 106, no. 3, pp. 1125–1165, Sep. 2011, doi: 10.1152/jn.00338.2011.
12J. Vohryzek, G. Deco, B. Cessac, M. L. Kringelbach, and J. Cabral, “Ghost Attractors in Spontaneous Brain Activity: Recurrent Excursions Into Functionally-Relevant BOLD Phase-Locking States,” Front. Syst. Neurosci., vol. 14, no. April, pp. 1–15, 2020, doi: 10.3389/fnsys.2020.00020.
Figures