0994
Simultaneous FDG-PET and MRI-based connectivity analysis for the detection of epileptogenic zones in non-lesional epilepsy patients1MRI Department, Fundación Escuela de Medicina Nuclear, Mendoza, Argentina, 2MRI Department, Fundación Argentina para el Desarrollo en Salud, Mendoza, Argentina, 3Nuclear Medicine Department, Fundación Escuela de Medicina Nuclear, Mendoza, Argentina, 4Instituto Balseiro, Universidad Nacional de Cuyo, San Carlos de Bariloche, Argentina, 5GQNYCS, Comisión Nacional de Energía Atómica, Ciudad Autónoma de Buenos Aires, Argentina, 6Neuromed, Mendoza, Argentina, 7GE Healthcare, Rio de Janeiro, Brazil, 8Department of Neurology, Massachusetts General Hospital and Harvard Medical School, Boston, MA, United States
Synopsis
Detecting epileptogenic zones (EZ) in subjects with non-lesional epilepsy can represent a challenge, and it involves the analysis of data from various diagnostic procedures. In this study, seed-based structural and functional connectivity matrices were obtained from DWI and resting-state fMRI for each patient and compared with a control group. Then, we assessed whether significantly different regions (p<0.001) coincided with foci of abnormal metabolism on PET images, and if these ROIs corresponded with the subject’s EZ. This reduced the false positive rate and improved specificity of the connectivity analysis, optimizing EZ localization in patients with non-lesional epilepsy.
Introduction
Detection of epileptogenic zones (EZ) in patients with non-lesional epilepsy requires information from a variety of diagnostic techniques and can be challenging in many cases. The optimization of preoperative neuroimaging helps to reduce the extent of resection and minimize postoperative deficits while not compromising the surgical outcome1,2.MRI and PET are two of the main neuroimaging techniques used in presurgical evaluation of epileptic patients. MRI can provide information about functional and structural neuronal connectivity3-5; since seizures spread rapidly in the brain, these connectivity analyses can help identify hypo or hyperconnected nodes that could influence the propagation of nerve impulses2. On the other hand, FDG-PET imaging can be useful to identify hypometabolic areas in the lobes of cortical seizure onset. Multimodal imaging, which combines MRI and PET, can increase the diagnosis of minor epileptogenic lesions and improve the postsurgical seizure prognosis1.
This study aims to analyze the information provided by structural and functional neuronal connectivity based on MRI, and to compare its results with regions of abnormal metabolic activity in PET images, for refractory epilepsy patients. With this approach, we aim to achieve a more complete and precise evaluation of the localization of the EZ.
Methods
This retrospective study was approved by the Institutional Review Board and all patients signed a written informed consent. MRI were acquired in 16 epilepsy patients (12 men, 4 women, ages 18-50 ys). In very few cases PET/CT and MRI had been performed, so only 5 out of the 16 patients had PET/CT scans. The selection criteria were adults with non-lesional drug-resistant epilepsy. The MRI data of the control group was obtained from an OpenNeuro database (70 healthy subjects, demographically matched, ages 21-50 ys)6.PET/CT images were acquired on a Discovery STE system (GE Healthcare, Milwaukee, USA), 60 minutes after the injection of a weight-based dose of FDG F18 (4.07 MBq/kg). PET scans were performed using 3D acquisition and the CT images were used for attenuation correction. This was later complemented with the acquisition of MRI in a 3.0 T Signa PET-MR scanner (GE Healthcare, Milwaukee, USA) using a high-resolution brain coil. Resting-state functional MRI (rs-fMRI) was acquired after a 3D T1-weighted image, followed by diffusion-weighted images (DWI) in 64 gradient directions and the standard MRI protocol for epilepsy patients. The acquisition parameters are summarized in Table 1.
Regarding the post-processing of PET images, abnormality maps were obtained by comparing each study with a normative database, defining hyper or hypo-metabolic areas of the brain with more than ±2 SD of the normal regional mean metabolic rate of glucose7. CT and PET images were then co-registered with the MRI using a linear transform with 12 degrees of freedom, and 120 ROIs were defined in the latter based on the AAL2 atlas. At the same time, the fMRI and DWI were post-processed to obtain functional connectivity (FC) and structural connectivity (SC) matrices. Seed-based FC between a set of ROIs given by the AAL2 atlas, was obtained using the CONN toolbox. SC was quantified with the FSL software, through a probabilistic tractography algorithm based on the ball-and-stick diffusion model and the same atlas. A Crawford-Howell modified t-test was applied to compare the FC and SC of each patient with the control group, generating contrast matrices (Figure 1). Regions with significant differences (p<0.001) in the connectivity values were identified and contrasted with the metabolic activity in the PET images. Areas that were significantly different from the healthy controls (HC), in both the connectivity and metabolic aspects, were compared with the actual EZ of the patient, which was verified through the post-surgical outcome (all patients had Engel IA and IB values); regions that presented significant differences in the connectivity analyses but were normometabolic were not considered as positives. The complete workflow is shown in Figure 2. Figure 3 shows the fused T1-weighted and PET images, together with the corpus callosum and corticospinal tracts, using 3D Slicer software.
Results and discussion
The location of the epileptogenic focus was temporal in 8 of the patients and extra-temporal in the rest (6 in the frontal lobe and 2 in the parietal lobe). PET images showed metabolic abnormalities in 4 out of 5 patients (80%). The SC analysis for the identification of the EZ had higher sensitivity compared to the one associated with the rs-fMRI, whereas the FC presented higher specificity than SC. The simultaneous analysis of FC and SC improved the true positive rate and the true negative rate. On the other hand, the metabolic analysis based on PET images improved the specificity of the brain connectivity analyses (Table 2). Precision can be improved by increasing the sample of patients and HC. Sensitivity and specificity values were high because the reference EZ were up to 8 cm2; in the future, we aim to complement with more precise clinical information about the location of the epileptogenic focus to reduce the areas up to 2 cm2.Conclusion
The simultaneous analysis of connectivity and metabolic aspects of the brain, based on MRI and PET, improves the detection of the EZ, optimizing the presurgical evaluation of patients with non-lesional epilepsy.Acknowledgements
This project is part of a research agreement with General Electric Healthcare (GE). We wish to extend our special thanks to Cristian Allard and Eduardo Figueiredo from the GE Research Team.References
1. C. Juhász and F. John, “Utility of MRI, PET, and ictal SPECT in presurgical evaluation of non-lesional pediatric epilepsy,” Seizure, vol. 77, pp. 15–28, Apr. 2020.2. Hyslop A, Miller I, Bhatia S, Resnick T, Duchowny M, Jayakar P. “Minimally re- sective epilepsy surgery in MRI-negative children.” Epileptic Disord 2015;17:263–74.
3. P. van Mierlo, Y. Höller, N. K. Focke, and S. Vulliemoz, “Network Perspectives on Epilepsy Using EEG/MEG Source Connectivity,” Frontiers in Neurology, vol. 10, p. 721, Jul. 2019.
4. N. K. Focke, C. Diederich, G. Helms, M. A. Nitsche, H. Lerche, and W. Paulus, “Idiopathic-generalized epilepsy shows profound white matter diffusion-tensor imaging alterations: Diffusion Tensor Alterations in Generalized Epilepsy,” Human Brain Mapping, vol. 35, no. 7, pp. 3332–3342, Jul. 2014.
5. A. Elshahabi, S. Klamer, A. K. Sahib, H. Lerche, C. Braun, and N. K. Focke, “Magnetoencephalography Reveals a Widespread Increase in Network Connectivity in Idiopathic/Genetic Generalized Epilepsy,” PLoS ONE, vol. 10, no. 9, Sep. 2015.
6. R. A. Poldrack et al., “A phenome-wide examination of neural and cognitive function,” Sci Data, vol. 3, no. 1, p. 160110, Dec. 2016.
7. T. Traub-Weidinger et al., “Utility of Absolute Quantification in Non-lesional Extratemporal Lobe Epilepsy Using FDG PET/MR Imaging,” Front. Neurol., vol. 11, p. 54, Jan. 2020.
Figures

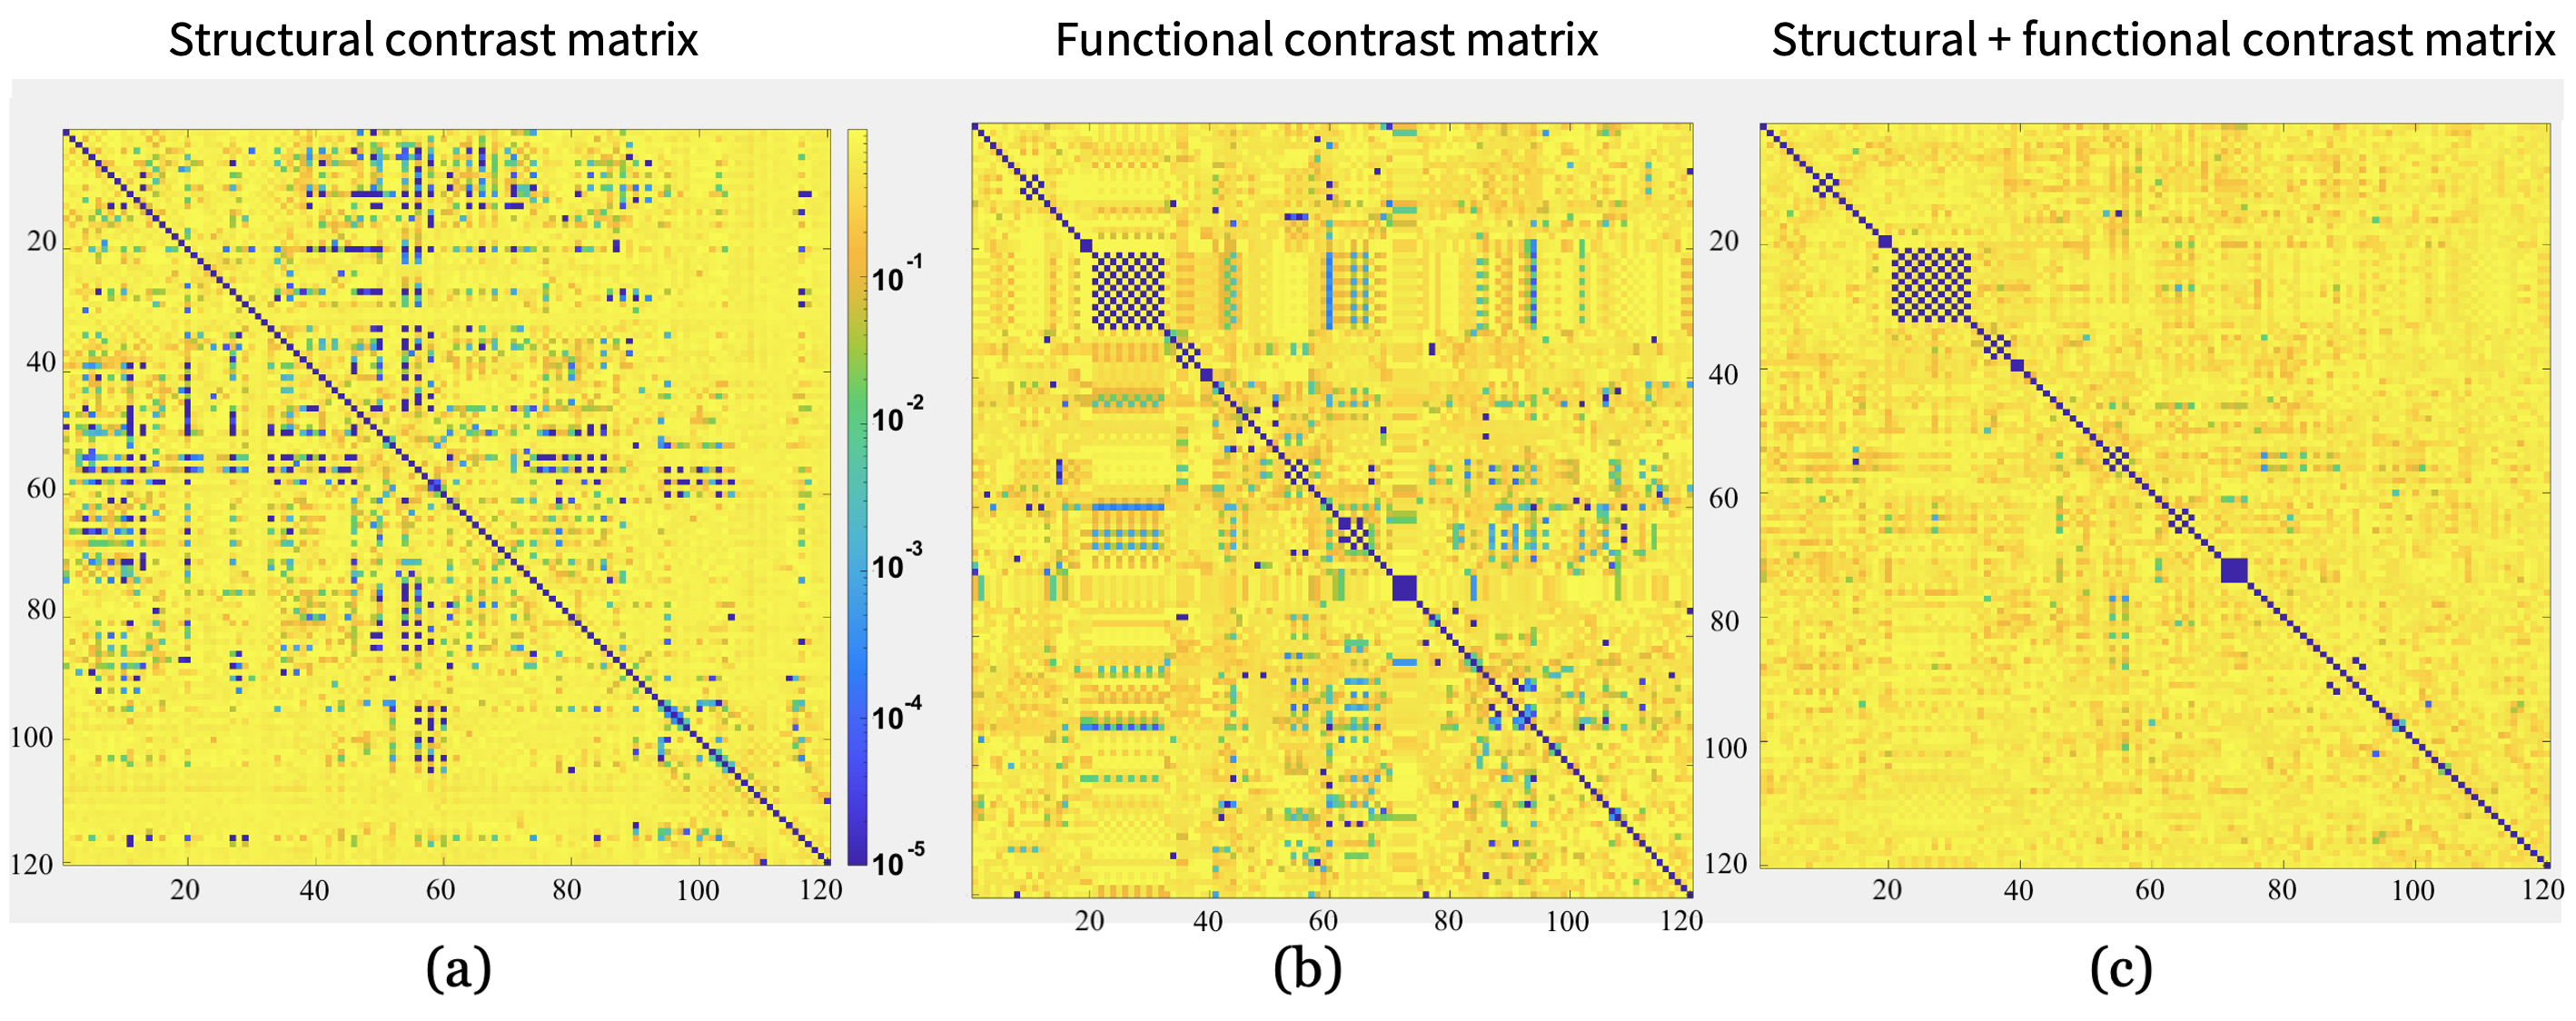
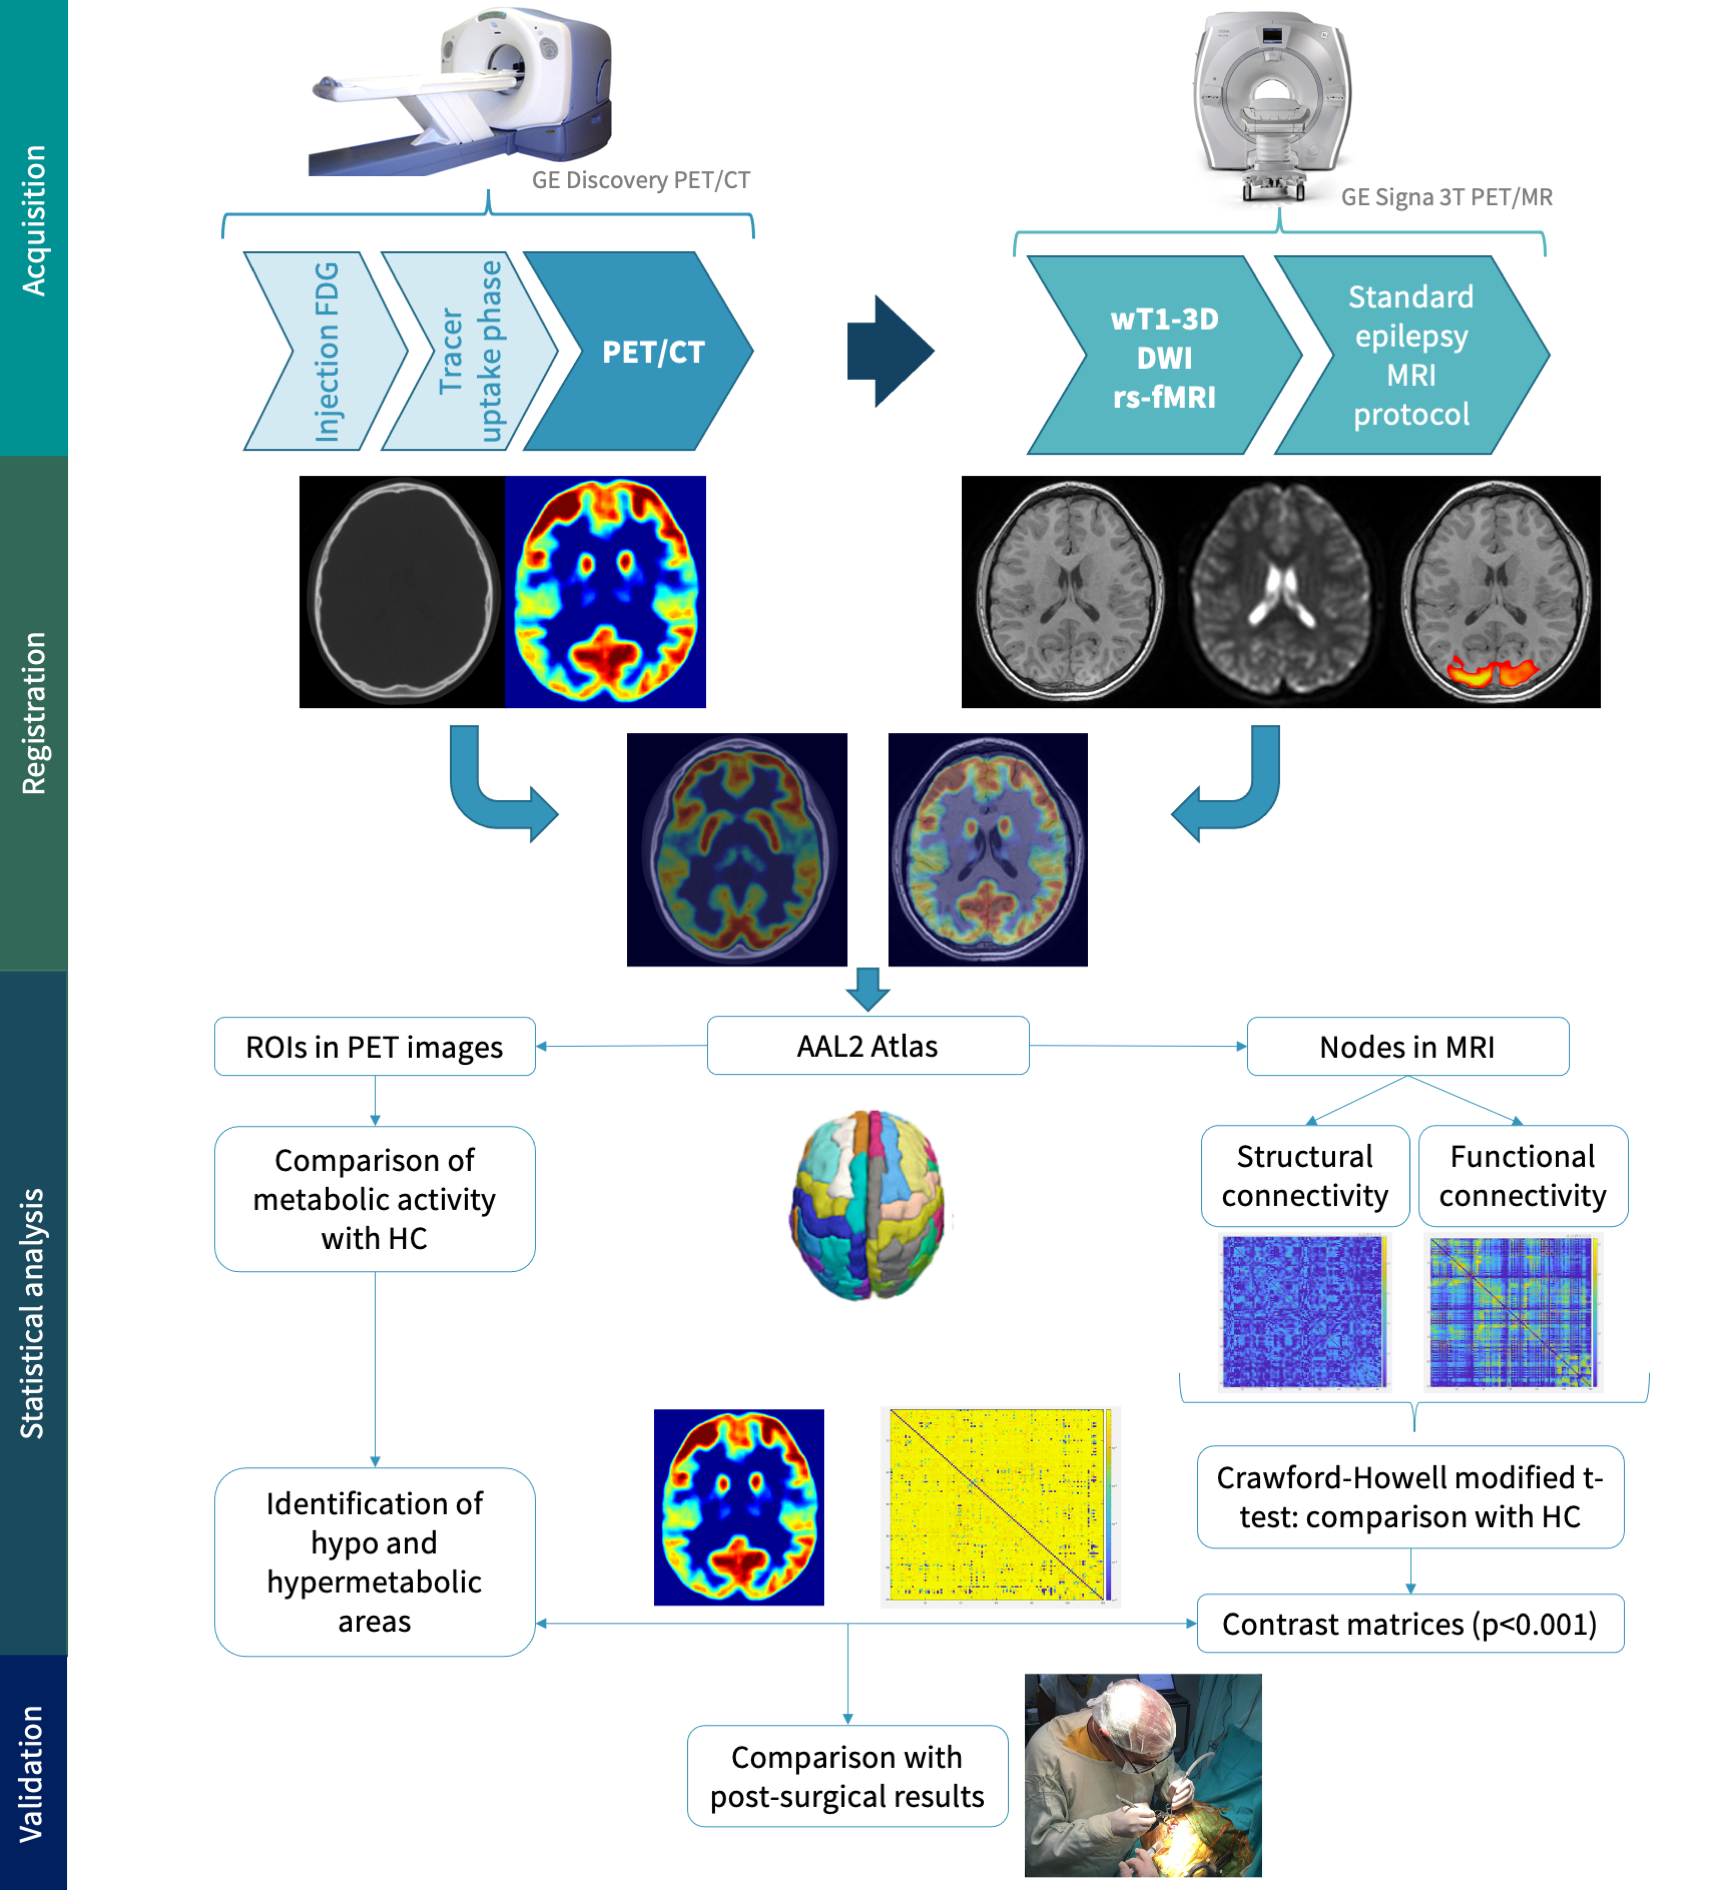
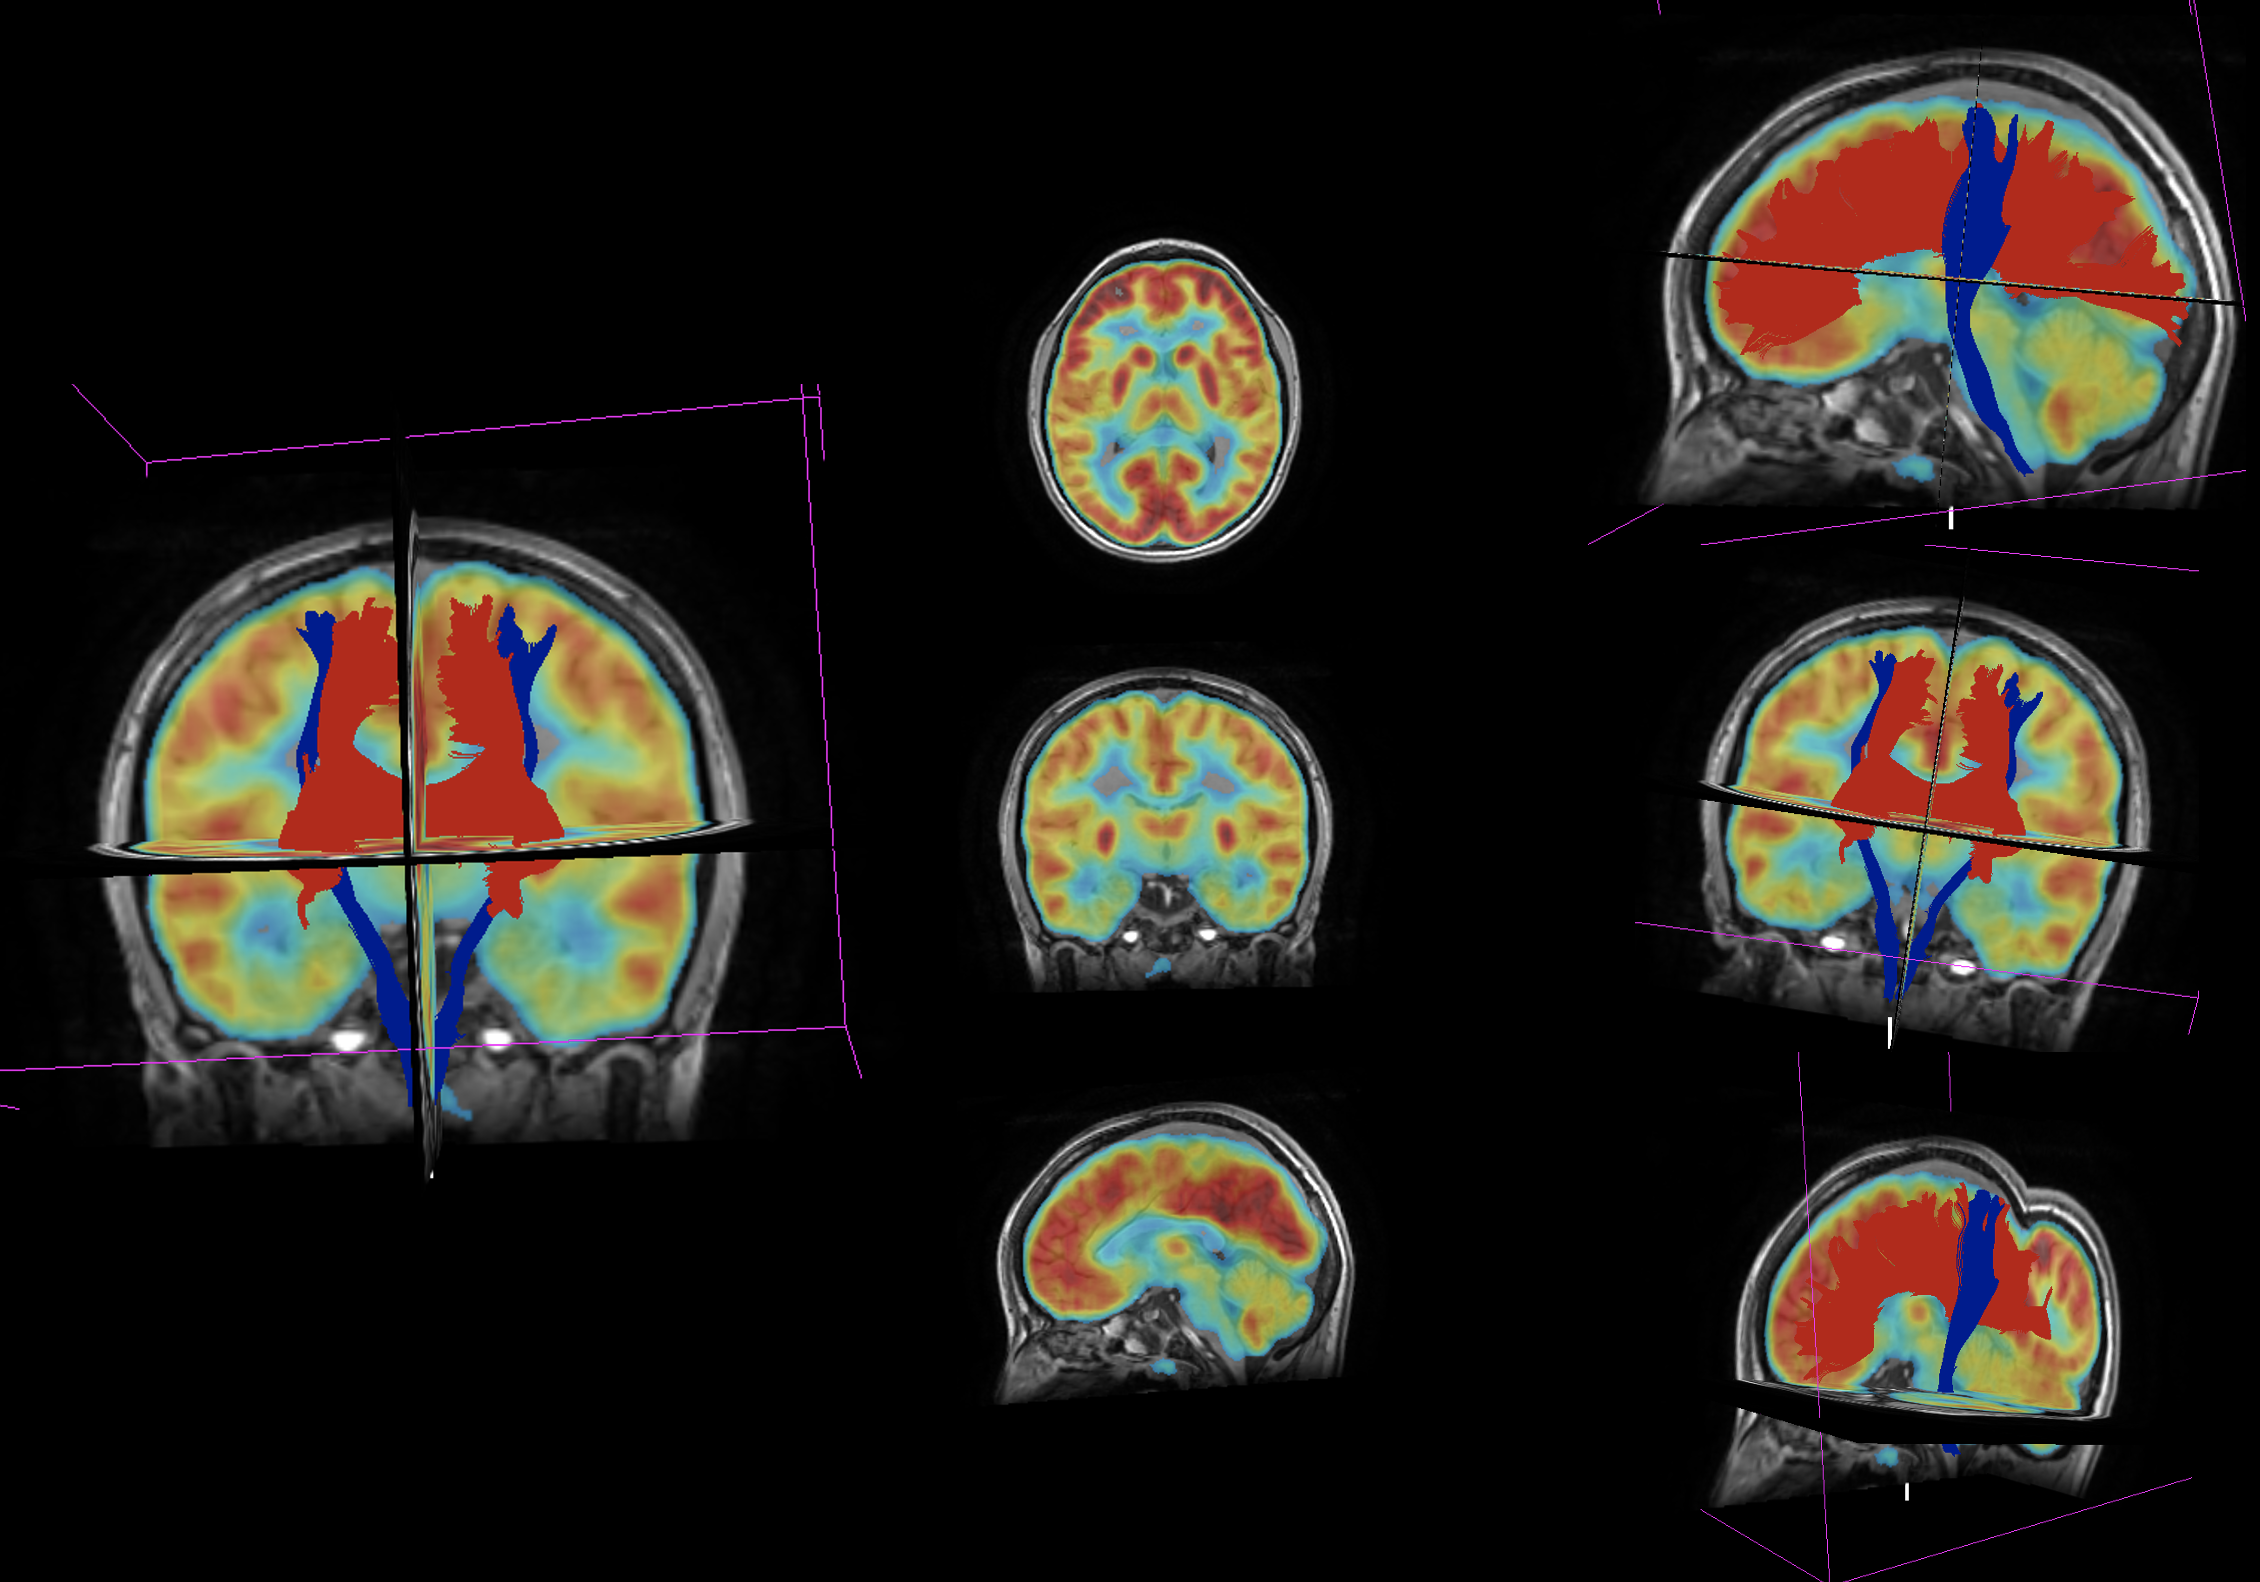
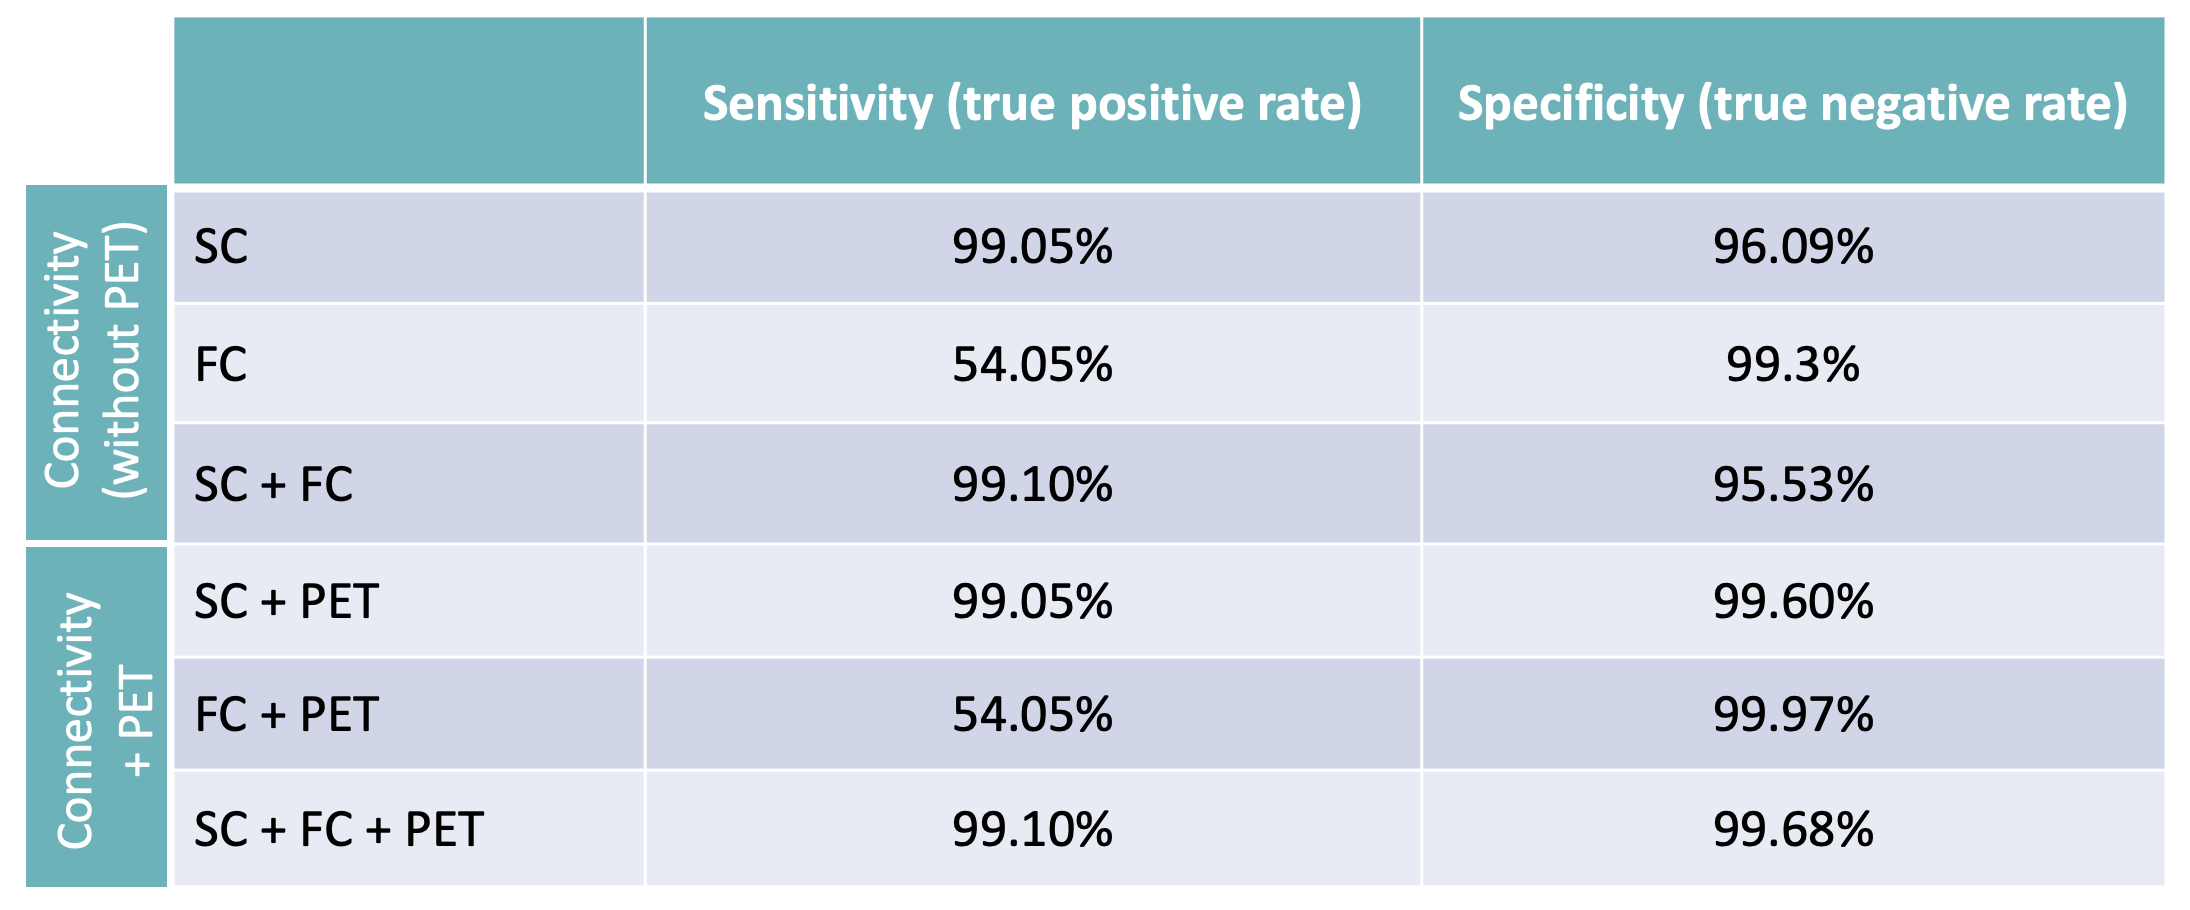
Table 2: Comparison of sensitivity and specificity values for the localization of the EZ through brain connectivity analysis based on MRI, with and without fusion with PET images.