0992
Diagnostic Accuracy of Spiral Whole-Heart Quantitative Adenosine Stress Cardiovascular Magnetic Resonance with Motion Compensated L1-SPIRIT1Cardiovascular Division, Department of Medicine, University of Virginia Health System, Charlottesville, VA, United States, 2Division of Cardiovascular Diseases, Division of Radiology, Scripps Clinic, La Jolla, CA, United States, 3Biomedical Engineering and Imaging Institute and Department of Radiology, Icahn School of Medicine at Mount Sinai, New York, NY, United States, 4Department of Internal Medicine, Lewis Katz School of Medicine at Temple University, Philadelphia, PA, United States, 5Division of Cardiology, Department of Medicine, University of North Carolina at Chapel Hill, Chapel Hill, NC, United States, 6Department of Biomedical Engineering, University of Virginia, Charlottesville, VA, United States, 7Department of Radiology and Medical Imaging, University of Virginia Health System, Charlottesville, VA, United States, 8Division of Cardiovascular Medicine, Stanford University, Palo Alto, CA, United States
Synopsis
Variable density spiral (VDS) pulse sequences with motion compensated compressed sensing reconstruction allow for whole-heart quantitative assessment of myocardial perfusion but have not yet been clinically validated. In this study, we showed that whole-heart VDS stress perfusion has good diagnostic accuracy and ischemic burden evaluation. No significant difference was seen between visual and quantitative diagnostic performance and ischemic burden measurements.
Introduction
Adenosine stress cardiac MRI is an excellent non-invasive option for detecting obstructive coronary artery disease (CAD) with a high diagnostic accuracy when compared to coronary angiography with fractional flow reserve (FFR) [1]. Positron emission tomography (PET) is another widely used modality that can measure absolute myocardial blood flow with whole-heart coverage [2], which is useful in patients with multivessel disease [3] and microvascular dysfunction [4]. Fully quantitative MRI perfusion has comparable diagnostic performance and perfusion estimates to that of PET [5], but whole-heart coverage is not widely available due to limited spatial-temporal resolution and dark-rim artifacts [6]. However, improvements in compressed sensing reconstruction, spatial-temporal acceleration techniques, and efficient k-space trajectories in the past decade have laid the groundwork for whole-heart coverage in first-pass perfusion imaging [7]. Our previous study demonstrated that a VDS pulse sequence with an integrated arterial input function (AIF) could acquire 8 short-axis slices with 2 mm in-plane resolution at heart rates up to 125 bpm, providing whole-heart quantitative assessment of perfusion [7]. The aim of this study is to assess the clinical performance of this technique for detecting obstructive CAD using both quantitative and visual analysis.Methods
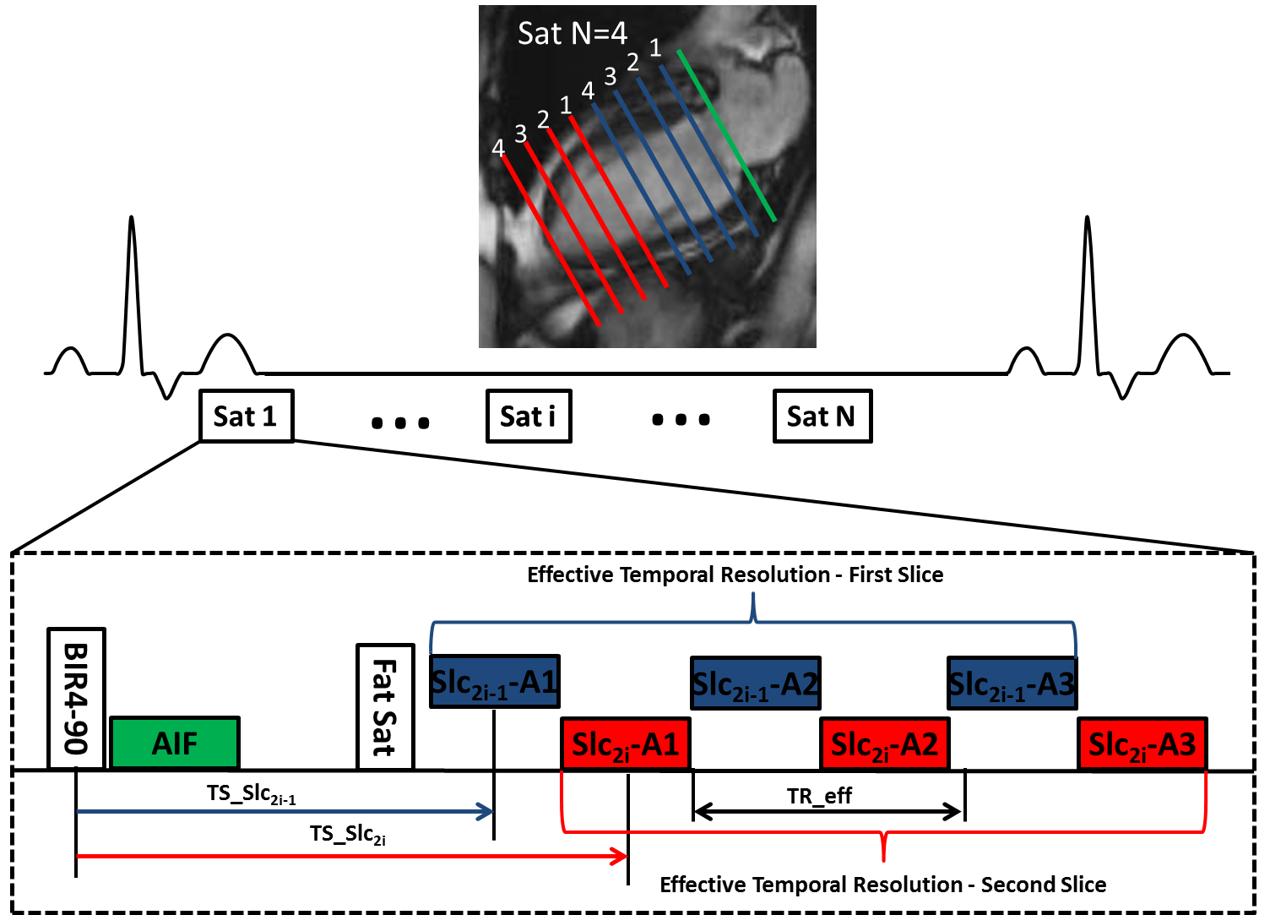
Cardiac perfusion MRI was performed on 25 patients with chest pain and known or suspected CAD scheduled for coronary angiography and 9 normal subjects during stress (140mcg/kg/min) and rest on a 1.5T scanner (Avanto or Aera, Siemens). Images were acquired during injection of 0.075 mmol/kg of Magnevist at 8 short-axis slice locations over 60 heart beats using a saturation recovery (SR) VDS perfusion pulse sequence. Pulse sequence parameters included 3 interleaves per slice, 2 interleaved slices per saturation, 5.12 ms readout duration per interleave, TE 1 ms, TR 7 ms, effective repetition time for each slice with interleaved acquisition (TReff) 14 ms, FA 30°, SR time 80 ms (to first radiofrequency pulse of the readout), FOV 340 mm2, in-plane resolution 2 mm2, and slice thickness 10 mm (Figure 1). AIF images were acquired during the SR time of the first perfusion image with a 2x accelerated single-shot spiral acquisition using a 90° FA, in-plane resolution of 6.95 mm2, and SR time of 10 ms. Proton density weighted (PDW) images were acquired during the first 4 heart beats for signal modeling. Images were reconstructed using a rigid-motion compensated L1-SPIRIT [7, 8]. Perfusion images were aligned with non-rigid registration using the ANTs toolbox [9]. Visual and quantitative analysis of MRI perfusion was compared to quantitative coronary angiography (QCA). Significant stenosis was defined >50% by QCA. Perfusion was reported on both a per-vessel and per-patient basis. Quantitative analysis assessed average myocardial perfusion reserve (MPR), average stress myocardial blood flow (MBF), and lowest stress MBF of two contiguous myocardial segments. Ischemic burden was measured visually and quantitatively.Results
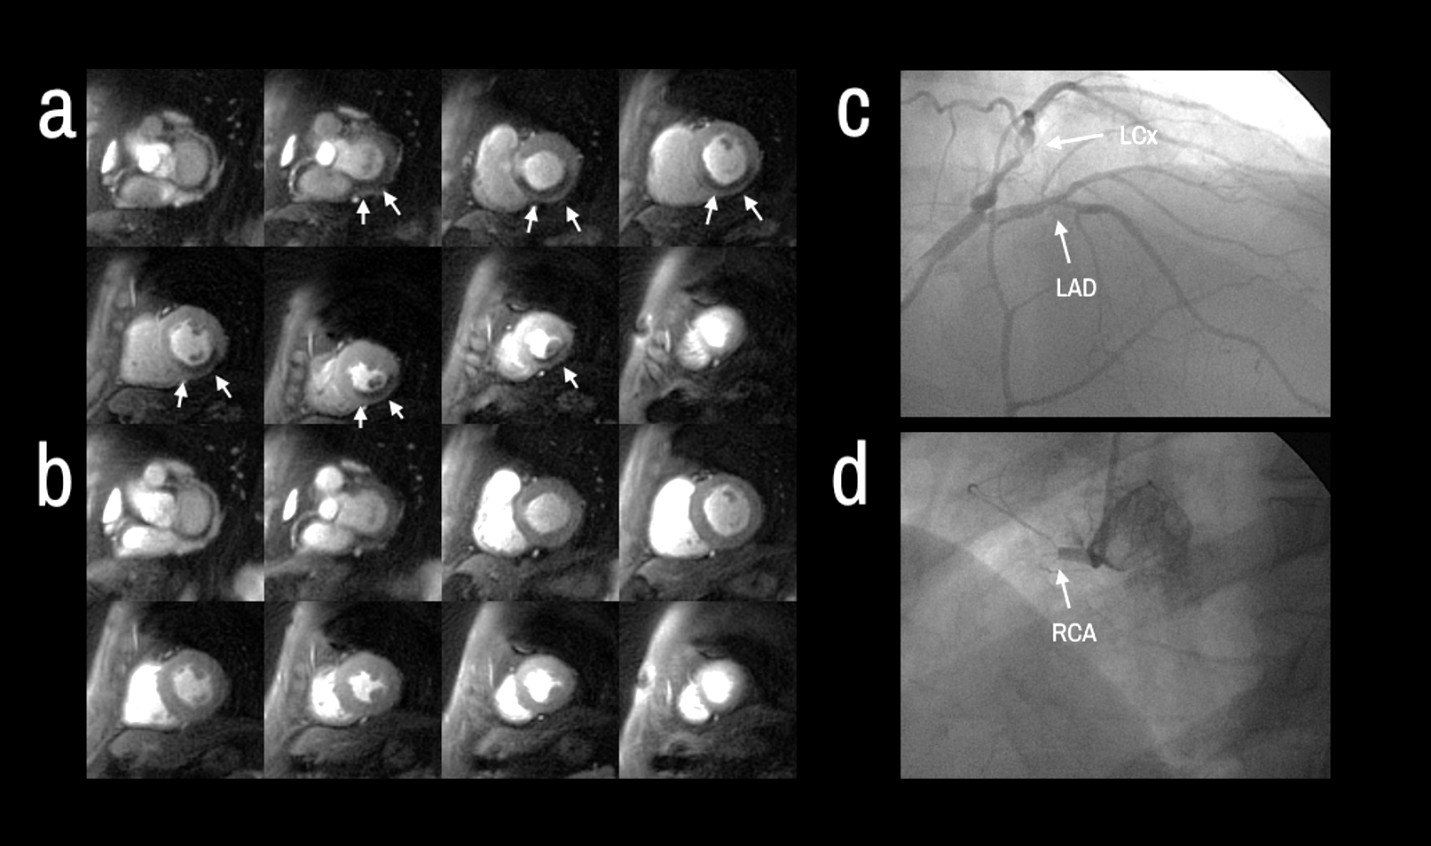
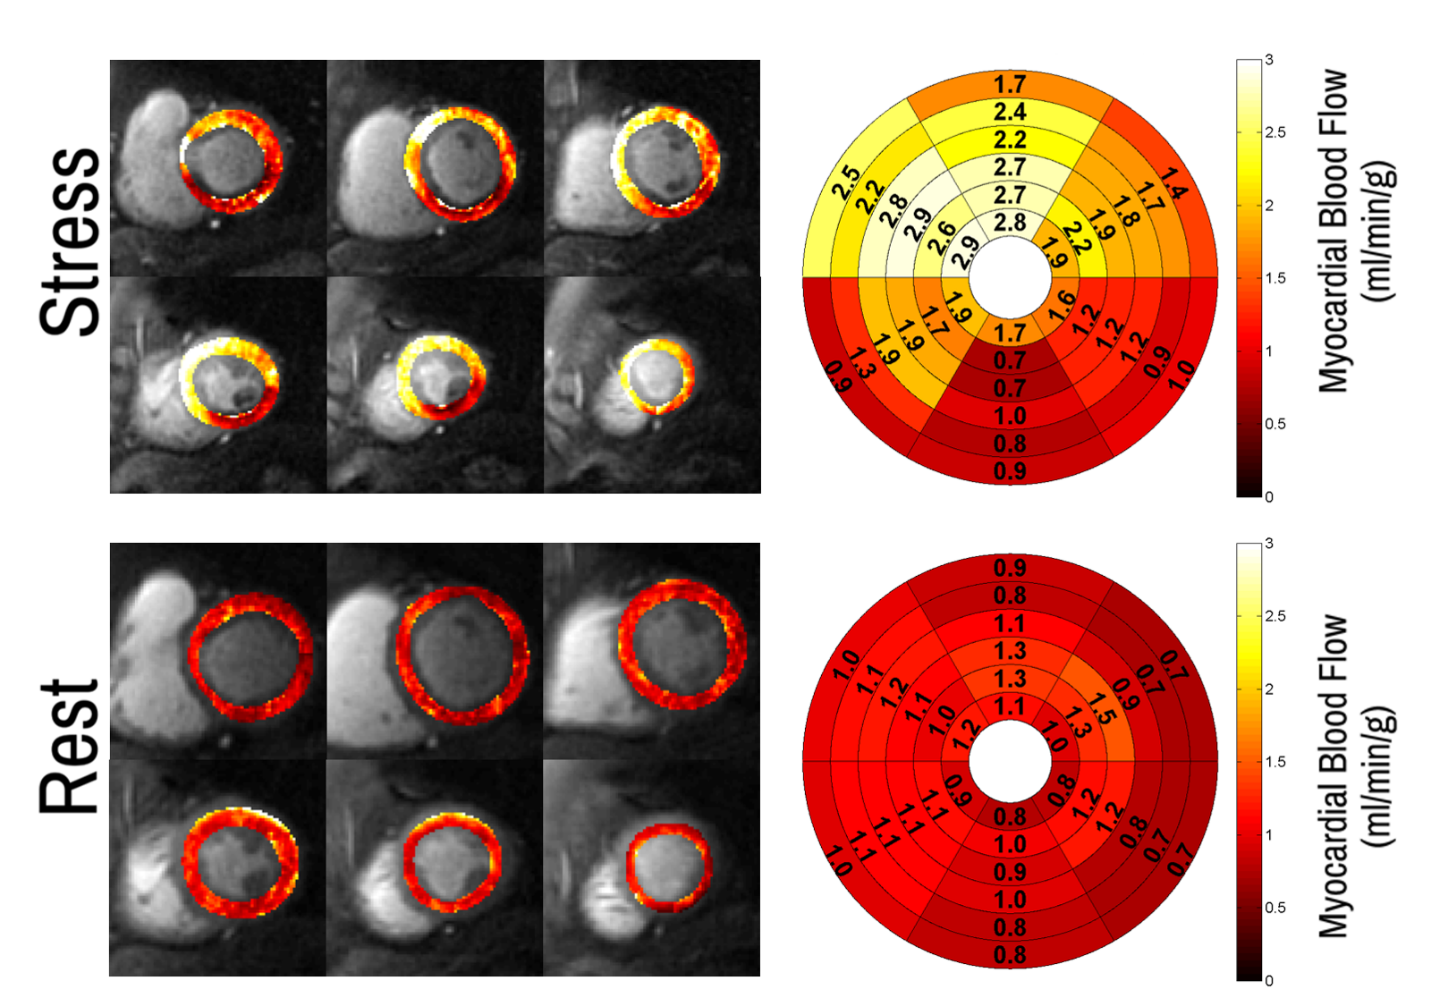
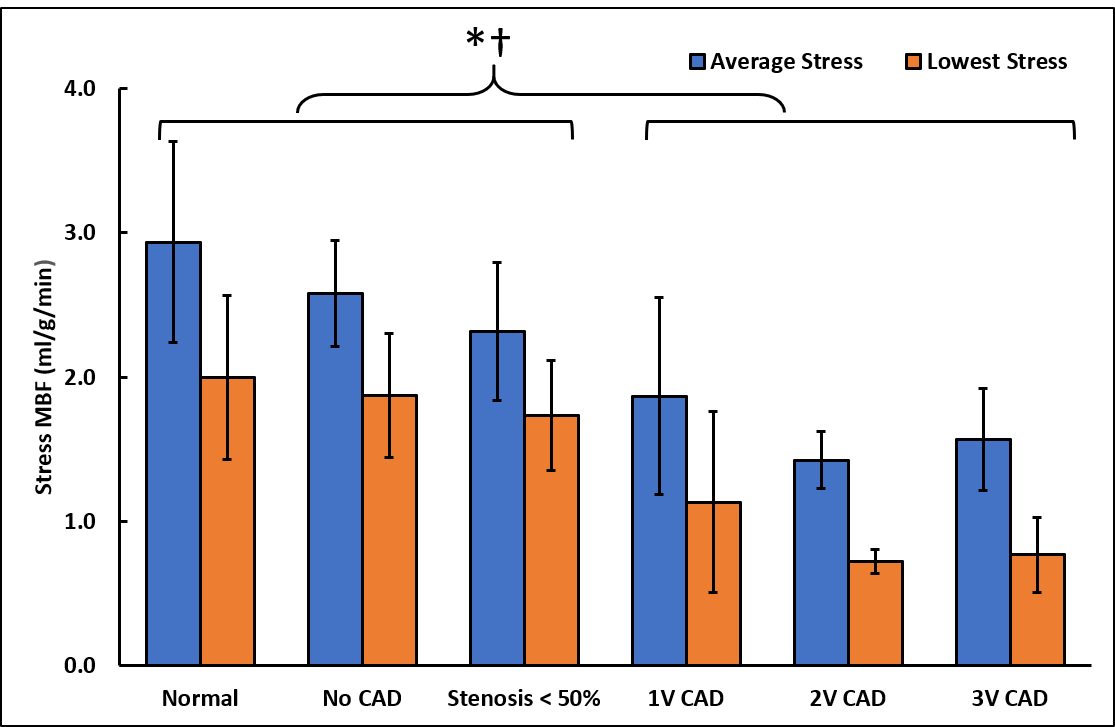
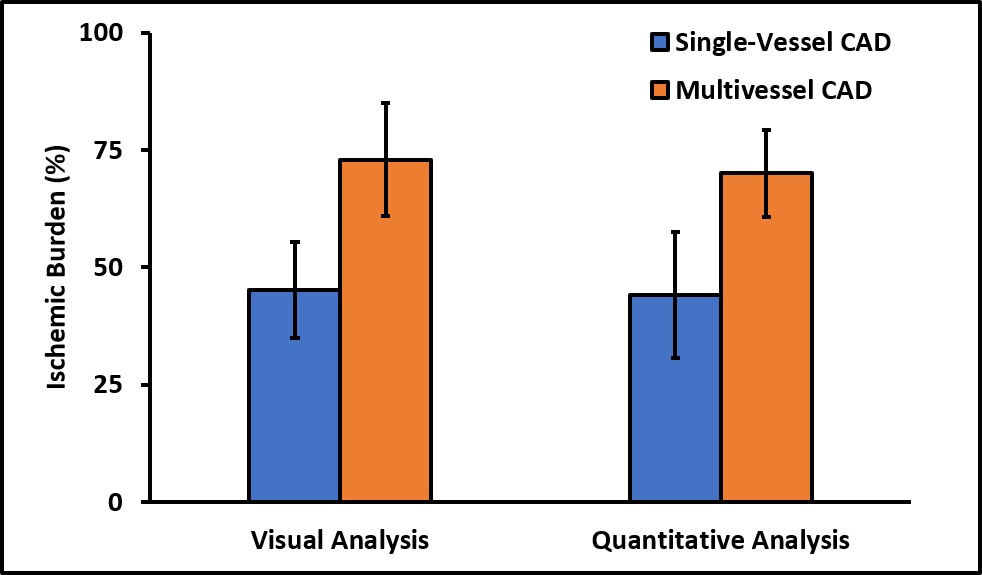
Patients had a mean age of 63 ± 12 and 84% were male. QCA demonstrated obstructive coronary disease in 76% of patients and multivessel disease in 36%. LGE in an ischemic pattern was seen 44% of patients. The normal healthy subjects had a mean age of 30 ± 16 with 44% males. They all had normal wall motion, normal stress and resting perfusion imaging, and no LGE. Figure 2 shows (a) stress and (b) rest spiral perfusion images from a patient who had obstructive 2-vessel CAD with (c) 70% stenosis of the LCx, and (d) 100% occlusion of the RCA. The patient also had a 40% non-obstructive lesion in the LAD and no evidence of LGE. A visual perfusion defect is seen in the inferior wall, corresponding to the occlusion of the RCA on coronary angiogram. Notably, pixel-wise quantification of perfusion (Figure 3) demonstrated reduced stress MBF in the LCx and RCA territories consistent with 2-vessel disease. Figure 4 shows a stepwise decrease in average and lowest overall stress MBF in normal healthy subjects and patients with no CAD, stenosis < 50%, single-vessel CAD, 2-vessel CAD, or 3-vessel CAD. Normal healthy subjects and patients with non-obstructive disease had an average stress MBF of 2.74 ± 0.63 ml/g/min and lowest stress MBF of 1.92 ± 0.49 ml/g/min. Patients with obstructive CAD had significantly reduced average stress MBF (1.71 ± 0.55 ml/g/min, p < 0.05) and lowest stress MBF (0.96 ± 0.51 ml/g/min, p < 0.05) when compared to normal healthy subjects and patients with non-obstructive disease. Per-patient visual analysis demonstrated a sensitivity of 84% (95% confidence interval [CI], 60-97%) and specificity of 83% (95% CI, 36-100%). There was no significant difference between per-vessel visual and quantitative analysis for sensitivity (69% [95% CI, 51-84%] vs 77% [95% CI, 60-90%], p=0.39) and specificity (88% [95% CI, 73-96%] vs 80% [95% CI, 64-91%], p=0.75). Per-vessel quantitative analysis ROC showed no significant difference (p=0.06) between average MPR (0.68 [95% CI, 0.56-0.81]), average stress MBF (0.74 [95% CI, 0.63-0.86]) and lowest stress MBF (0.79 [95% CI, 0.69-0.90]). Figure 5 showed that visual and quantitative ischemic burden measurements were comparable (p=0.85).Conclusion
Whole-heart VDS stress perfusion demonstrated good diagnostic accuracy and ischemic burden evaluation. No significant difference was seen between visual and quantitative diagnostic performance and ischemic burden measurements.Acknowledgements
No acknowledgement found.References
Takx, R.A.P., et al., Diagnostic Accuracy of Stress Myocardial Perfusion Imaging Compared to Invasive Coronary Angiography With Fractional Flow Reserve Meta-Analysis. Circulation: Cardiovascular Imaging, 2015. 8(1): p. e002666.
Slomka, P., et al., The role of PET quantification in cardiovascular imaging. Clinical and translational imaging, 2014. 2(4): p. 343-358.
Murthy, V.L., et al., Improved cardiac risk assessment with noninvasive measures of coronary flow reserve. Circulation, 2011. 124(20): p. 2215-24.
Zorach, B., et al., Quantitative cardiovascular magnetic resonance perfusion imaging identifies reduced flow reserve in microvascular coronary artery disease. Journal of cardiovascular magnetic resonance : official journal of the Society for Cardiovascular Magnetic Resonance, 2018. 20(1): p. 14-14.
Morton, G., et al., Quantification of Absolute Myocardial Perfusion in Patients With Coronary Artery Disease. Comparison Between Cardiovascular Magnetic Resonance and Positron Emission Tomography, 2012. 60(16): p. 1546-1555.
Gerber, B.L., et al., Myocardial first-pass perfusion cardiovascular magnetic resonance: history, theory, and current state of the art. Journal of Cardiovascular Magnetic Resonance, 2008. 10(1): p. 18.
Yang, Y., et al., First-pass myocardial perfusion imaging with whole-heart coverage using L1-SPIRiT accelerated variable density spiral trajectories. Magn Reson Med, 2016. 76(5): p. 1375-1387.
Zhou, R., et al., Simple motion correction strategy reduces respiratory-induced motion artifacts for k-t accelerated and compressed-sensing cardiovascular magnetic resonance perfusion imaging. J Cardiovasc Magn Reson, 2018. 20(1): p. 6.
Avants, B.B., et al., A reproducible evaluation of ANTs similarity metric performance in brain image registration. Neuroimage, 2011. 54(3): p. 2033-44.
Figures