0985
Predicting the arithmetic mean radius from the MRI-visible axon radius1Institute of Systems Neuroscience, University Medical Center Hamburg-Eppendorf, Hamburg, Germany, 2Department of Neurophysics, Max Planck Institute for Human Cognitive and Brain Sciences, Leipzig, Germany, 3Paul Flechsig Institute of Brain Research, University of Leipzig, Leipzig, Germany, 4Berlin Ultrahigh Field Facility, Max Delbrück Center for Molecular Medicine in the Helmholtz Association, Berlin, Germany, 5Experimental and Clinical Research Center, a joint cooperation between the Charité Medical Faculty and the Max Delbrück Center for Molecular Medicine in the Helmholtz Association, Berlin, Germany, 6Felix Bloch Institute for Solid State Physics, Faculty of Physics and Earth Sciences, Leipzig, Germany
Synopsis
The axon radius is a main determinant of the conduction velocity of action potentials. Robust, MRI-based axon radius estimation is sensitive to a tail-weighted estimate of the ensemble-average axon radius, i.e., the effective axon radius ($$$r_{\text{eff}}$$$). It is unclear how $$$r_{\text{eff}}$$$ translates into the arithmetic mean axon radius ($$$r_{\text{arith}}$$$), which may be more indicative of the conduction velocity than $$$r_{\text{eff}}$$$. We investigate the feasibility to predict $$$r_{\text{arith}}$$$ from $$$r_{\text{eff}}$$$ using linear regression on high-resolution, large-scale light-microscopy images of a human corpus callosum sample and validate this linear relationship with microscopy and diffusion-weighted MRI images of another human corpus callosum sample.
Introduction
The axon radius is a main determinant of the conduction velocity of action potentials ¹. It is unclear whether MRI-based methods to estimate the axon radius can accurately estimate the axon radius in vivo ²⁻⁴. A recently proposed method ² has addressed the ill-conditioned nature of MRI-based axon radius estimation and concluded that the method provides a strongly tail-weighted estimate, i.e., the effective mean axon radius ($$$r_{\text{eff}}$$$) of the ensemble-average axon radius in an MRI voxel. However, the strong tail-weighting of $$$r_{\text{eff}}$$$ towards rare, large axons implies that reliable estimates need to be based on large ensembles of axons ⁵. This complicates histological validation, usually performed on smaller ensembles of axons compared to MRI ⁶⁻⁹. Histological studies commonly report the arithmetic mean axon radius, which may be more indicative of the conduction velocity. Thus, deriving a relationship between $$$r_{\text{eff}}$$$ and $$$r_{\text{arith}}$$$ is of high relevance.Here, we assess the feasibility of predicting $$$r_{\text{arith}}$$$ from $$$r_{\text{eff}}$$$-diffusion-MRI measurements. Using manually registered diffusion MRI images and a histological reference generated through automated assessment of high-resolution, large-scale light microscopy data (lsLM) ¹⁰, we compute a regression on one human corpus callosum sample and assess the prediction capability on another human corpus callosum sample.
Methods and Materials
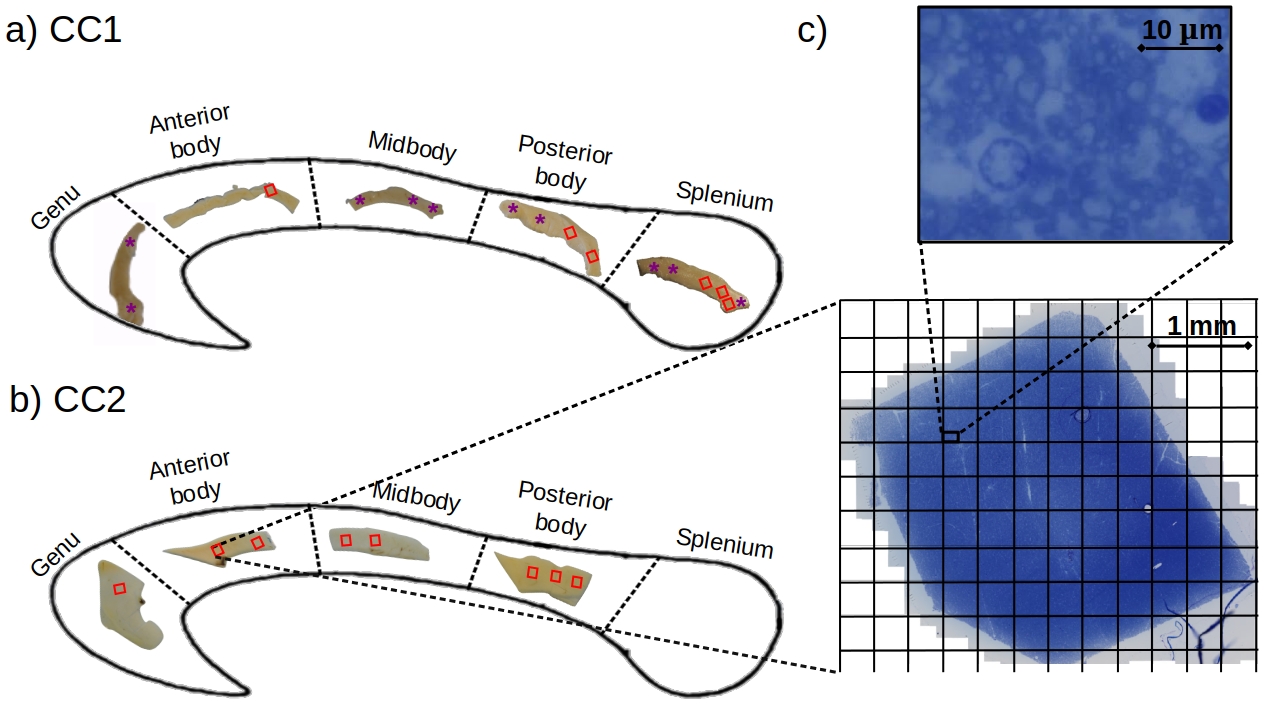
Samples: Two human corpus callosum (CC1 and CC2) samples were obtained at autopsy with prior informed consent and approved by responsible authorities (Approvals #205/17-ek and #WF-74/16). Following standard Brain Bank procedures, blocks were immersion-fixed with 3% paraformaldehyde and 1% glutaraldehyde in phosphate-buffered saline (PBS, pH 7.4) at 4°C (see Fig. 1a-b). Each tissue sample was cut into two parts along the anterior-posterior axis and used for MRI and lsLM acquisition, respectively.Microscopy acquisition: We acquired sixteen (CC1) and eight (CC2) lsLM images of semi-thin (500 nm) sections using a Zeiss AxioScan Z1 (stained with 1% toluidine blue; resolution: 0.1112 µm/px; resolution limit: 300 nm) (see Fig. 1c).
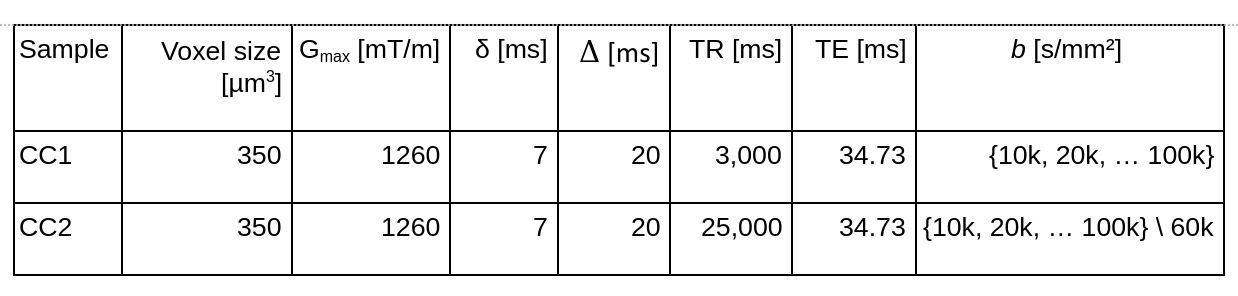
MRI acquisition: To facilitate heavily diffusion-weighted MRI data for MRI-based $$$r_{\text{eff}}$$$ mapping, the ex vivo diffusion-weighted MRI was acquired on a small bore 9.4T MR system (Bruker Biospin, Ettlingen, Germany) equipped with a gradient insert coil and a 4 TX/ 4 RX RF-coil using a protocol similar to ² (see Table 1).
Axon radii estimation from lsLM: Individual axon radii were estimated on whole lsLM sections using an in-house developed pipeline ¹⁰. lsLM-based effective axon radii (denoted as $$$\rho_{\text{eff,hist}}$$$) and arithmetic mean radii (denoted as $$$\rho_{\text{arith,hist}}$$$) were computed on subsections with areas equivalent to the cross-section areas of the MRI voxels used in this study, i.e. 350 x 350 µm² (see grid in Fig. 1c).
Axon radii estimation from MRI: MRI-based effective axon radii (denoted as $$$\rho_{\text{eff,MRI}}$$$) were estimated according to ².
Registration of MRI and lsLM ROIs: To register ROIs between MRI and lsLM, we localized the lsLM ROIs on the medial slice of the MRI dataset. For this purpose, we manually registered the ROIs in the medial slice along anterior-posterior and inferior-superior axis based on shape (see Fig. 1a-b for registered ROIs). Registered ROIs included 54 ± 31 MRI voxels and 46 ± 35 lsLM subsections.
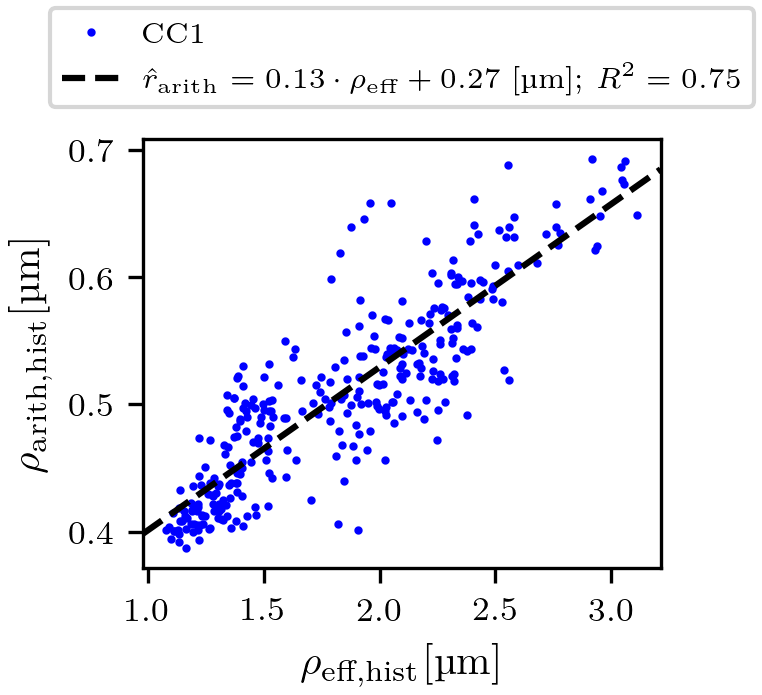
Regression of the arithmetic mean radius: To obtain predicted arithmetic mean axon radii (denoted as $$$\hat{r}_{\text{arith,hist}}$$$ and $$$\hat{r}_{\text{arith,MRI}}$$$) from lsLM-based ($$$\rho_{\text{eff,hist}}$$$) and MRI-based ($$$\rho_{\text{eff,MRI}}$$$) estimates of the effective axon radius, we computed a linear regression of $$$\rho_{\text{arith,hist}}$$$ from $$$\rho_{\text{eff,hist}}$$$ on all lsLM subsections of CC1. The fitting error was evaluated in terms of the coefficient of determination ($$$R^2$$$).
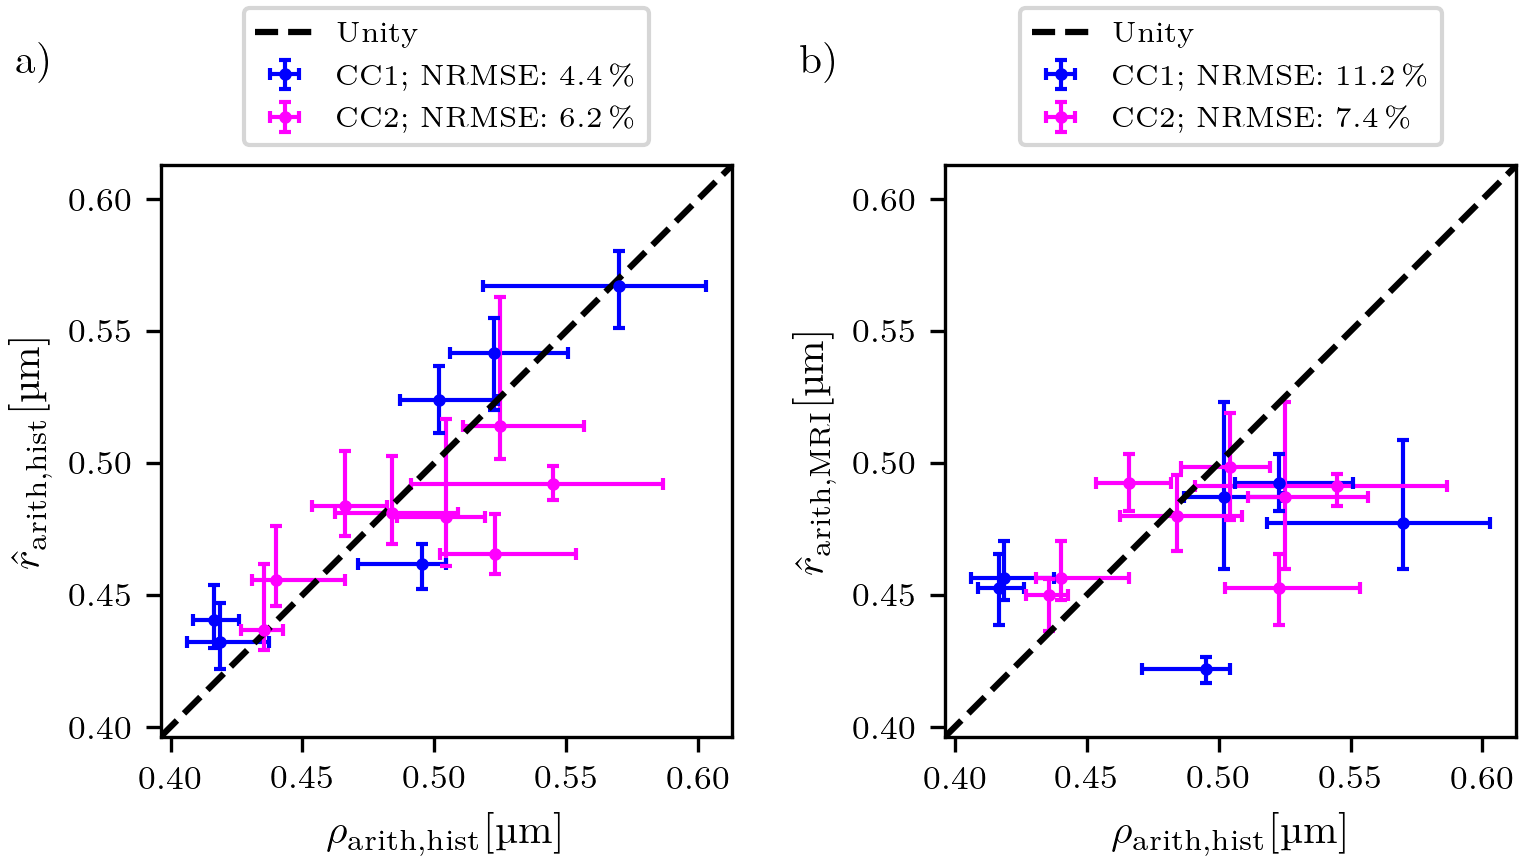
Prediction error: Due to the lack of a spatial one-to-one correspondence between MRI voxels and lsLM subsections, we computed the median value and the 25th and 75th percentiles per registered ROI (see rectangles in Fig. 1a-b) for both CC samples. To summarize the prediction error for one CC sample, we computed the normalized-root-mean-square-error $$$\text{NRMSE} = \sqrt{\frac{1}{N} \sum_{i=1}^{N}{(\text{median}(\hat{r}_{\text{arith,hist},i})-\text{median}(\rho_{\text{arith,hist},i}))^2}} / \text{median}(\rho_{\text{arith,hist},i})$$$ from median values of predicted ($$$\hat{r}_{\text{arith,hist},i}$$$) and reference ($$$\rho_{\text{arith,hist},i}$$$) values across all N registered ROIs. Analogously, we computed the NRMSE of $$$\hat{r}_{\text{arith,MRI}}$$$ with respect to $$$\rho_{\text{arith,hist}}$$$.
Results
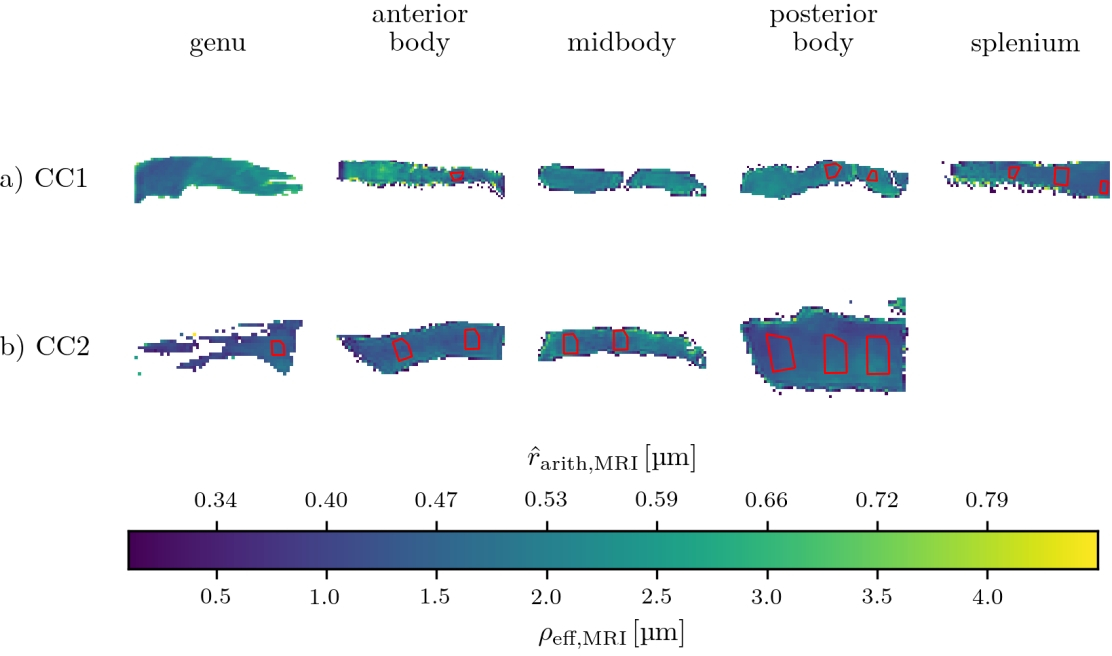
$$$\hat{r}_{\text{arith,hist}}$$$ was fitted with R² = 0.75 on CC1 (see Fig. 2). For lsLM-based predictions, $$$\hat{r}_{\text{arith,hist}}$$$ on CC2 deviated from the line of unity for larger $$$\rho_{\text{arith,hist}}$$$ (>= 0.5 µm), resulting in a higher normalized-root-mean-square-error (NRMSE) for CC2 (6.2%) than for CC1 (4.4%) (see Fig. 3a). Although the regression was computed on CC1, the NRMSE of MRI-based predictions ($$$\hat{r}_{\text{arith,MRI}}$$$) was lower for CC2 (7.4%) than for CC1 (11.2%) (see Fig. 3b). This is likely due to a better correlation between lsLM-based ($$$\rho_{\text{eff,hist}}$$$) and MRI-based ($$$\rho_{\text{eff,MRI}}$$$) effective radii for CC2 (NRMSE: 6.8%, not shown in figures) as compared to CC1 (NRMSE: 22%; not shown in figures). In Fig. 4, $$$\hat{r}_{\text{arith,MRI}}$$$ is mapped across the two entire CC samples.Discussuion and Conclusion
Our findings revealed a linear mapping between the arithmetic mean axon radius ($$$r_{\text{arith}}$$$) and the effective mean axon radius ($$$r_{\text{eff}}$$$) in the human corpus callosum. This relation holds true for an independent human corpus callosum sample with small increase of error and can also be used to translate MRI-based $$$r_{\text{eff}}$$$ into $$$r_{\text{arith}}$$$. Further analysis is warranted to investigate the generalizability of these observations and to assess the applicability beyond the human corpus callosum.Acknowledgements
The Max Planck Institute for Human Cognitive and Brain Sciences has an institutional research agreement with Siemens Healthcare. NW was a speaker at an event organized by Siemens Healthcare and was reimbursed for the travel expenses.
The research leading to these results has received funding from the European Research Council under the European Union's Seventh Framework Programme (FP7/2007-2013) / ERC grant agreement n° 616905.
This work was supported by the German Research Foundation (DFG Priority Program 2041 "Computational Connectomics”, [MO 2397/5-1,2; MO 2249/3–1,2], by the Emmy Noether Stipend: MO 2397/4-1) and by the BMBF (01EW1711A and B) in the framework of ERA-NET NEURON and the Forschungszentrums Medizintechnik Hamburg (fmthh; grant 01fmthh2017).
References
[1] H. Schmidt and T. R. Knösche, “Action potential propagation and synchronisation in myelinated axons,” PLOS Comput. Biol., vol. 15, no. 10, p. e1007004, Oct. 2019, doi: 10.1371/journal.pcbi.1007004.
[2] J. Veraart et al., “Noninvasive quantification of axon radii using diffusion MRI,” eLife, vol. 9, p. e49855, Feb. 2020, doi: 10.7554/eLife.49855.
[3] G. M. Innocenti, R. Caminiti, and F. Aboitiz, “Comments on the paper by Horowitz et al. (2014),” Brain Struct. Funct., vol. 220, no. 3, pp. 1789–1790, May 2015, doi: 10.1007/s00429-014-0974-7.
[4] M. Nilsson, S. Lasič, I. Drobnjak, D. Topgaard, and C.-F. Westin, “Resolution limit of cylinder diameter estimation by diffusion MRI: The impact of gradient waveform and orientation dispersion,” NMR Biomed., vol. 30, no. 7, p. e3711, 2017, doi: 10.1002/nbm.3711.
[5] L. Mordhorst et al., “Reliable estimation of the MRI-visible effective axon radius using light microscopy: the need for large field-of-views”, Poster presented at ISMRM 2021.
[6] F. Aboitiz, A. B. Scheibel, R. S. Fisher, and E. Zaidel, “Fiber composition of the human corpus callosum,” Brain Res., vol. 598, no. 1, pp. 143–153, Dec. 1992, doi: 10.1016/0006-8993(92)90178-C.
[7] D. Liewald, R. Miller, N. Logothetis, H.-J. Wagner, and A. Schüz, “Distribution of axon diameters in cortical white matter: an electron-microscopic study on three human brains and a macaque,” Biol. Cybern., vol. 108, no. 5, pp. 541–557, Oct. 2014, doi: 10.1007/s00422-014-0626-2.
[8] D. Graf von Keyserlingk and U. Schramm, “Diameter of axons and thickness of myelin sheaths of the pyramidal tract fibres in the adult human medullary pyramid,” Anat. Anz., vol. 157, no. 2, pp. 97–111, 1984.
[9] R. Caminiti, H. Ghaziri, R. Galuske, P. R. Hof, and G. M. Innocenti, “Evolution amplified processing with temporally dispersed slow neuronal connectivity in primates,” Proc. Natl. Acad. Sci. U. S. A., vol. 106, no. 46, pp. 19551–19556, Nov. 2009, doi: 10.1073/pnas.0907655106.
[10] L. Mordhorst et al., “A representative reference for MRI-based human axon radius assessment using light microscopy”, bioRxiv, Jun. 2021. doi: 10.1101/2021.06.03.446739.
Figures