0983
Test-retest reliability of whole-brain and bundle-level microstructural properties1Department of Neuroscience and Biomedical Engineering, Aalto University, Espoo, Finland, 2Turku Brain and Mind Center, University of Turku, Turku, Finland, 3Cardiff University Brain Research Imaging Centre (CUBRIC), School of Psychology, Cardiff University, Cardiff, United Kingdom
Synopsis
We investigated the test-retest reliability of bundle- and voxel-/fixel-level microstructural metrics with fixel-based analysis, neurite orientation dispersion and density imaging, and diffusion tensor imaging. For the bundle-level analyses, TractSeg was used to automatically segment 72 fiber bundles of the brain. Our results indicate that most of the metrics, especially those measured with fixel-based analysis, are highly robust and show excellent test-retest reliability both in local and bundle-level analyses. In general, the reproducibility was higher in the white matter in contrast to gray matter and for acquisitions with multi-shell compared to single-shell data.
Purpose
Diffusion MRI can be used to study brain connectivity and microstructure in vivo. High reproducibility and test-retest reliability of structural brain connectivity and the connectome have been previously reported1. Moreover, traditional diffusion tensor imaging (DTI) based microstructural metrics have been shown to be highly reliable2-3. Recently, the reliability of neurite orientation dispersion and density imaging (NODDI)4 has been investigated via region-of-interest and voxel-based analyses5-6. However, test-retest reliability of the fixel-based microstructural metrics7, such as fiber density and fiber cross-section, has not been properly investigated. Moreover, the previous reliability studies in NODDI did not involve bundle-level microstructural metrics.Therefore, we investigated the test-retest reliability of both bundle- and voxel-/fixel-level microstructural metrics by performing fixel-based analysis (FBA), NODDI, and DTI for diffusion MRI data acquired in the Human Connectome Project (HCP)8.
Material and Methods
We used HCP test-retest diffusion-weighted MRI data from 44 healthy individuals9, acquired with diffusion-weightings 1000, 2000, and 3000 s/mm2, each applied in 90 gradient orientations. The retest data were acquired 4.9±2.4 months after the initial acquisition. The data were preprocessed to correct for subject motion10, eddy current and susceptibility induced distortions11, and echo planar imaging distortions12, and rigidly coregistered to the T1-weighted data13.To investigate the repeatability of various microstructural metrics, we estimated fiber orientation specific fiber density and morphology7,14-15 and voxel-wise DTI16-17 based microstructural metrics both by using the complete multi-shell data18 and separately by using each of the different diffusion-weightings19. The microstructural metrics from NODDI4 were only calculated by using the complete multi-shell data with all the b-values, as it requires at least two nonzero diffusion-weightings. In addition, we analyzed the reliability of the microstructural metrics within white matter, cortical gray matter, and subcortical gray matter. Moreover, for the white matter, we investigated the effect of the number of peaks to the reproducibility of the metrics.
TractSeg was used to automatically segment 72 fiber bundles of the brain20. Fiber tractography for the bundle-level analyses was performed by using iFOD2 tractography algorithm21 on the population fiber orientation distribution template.
Results
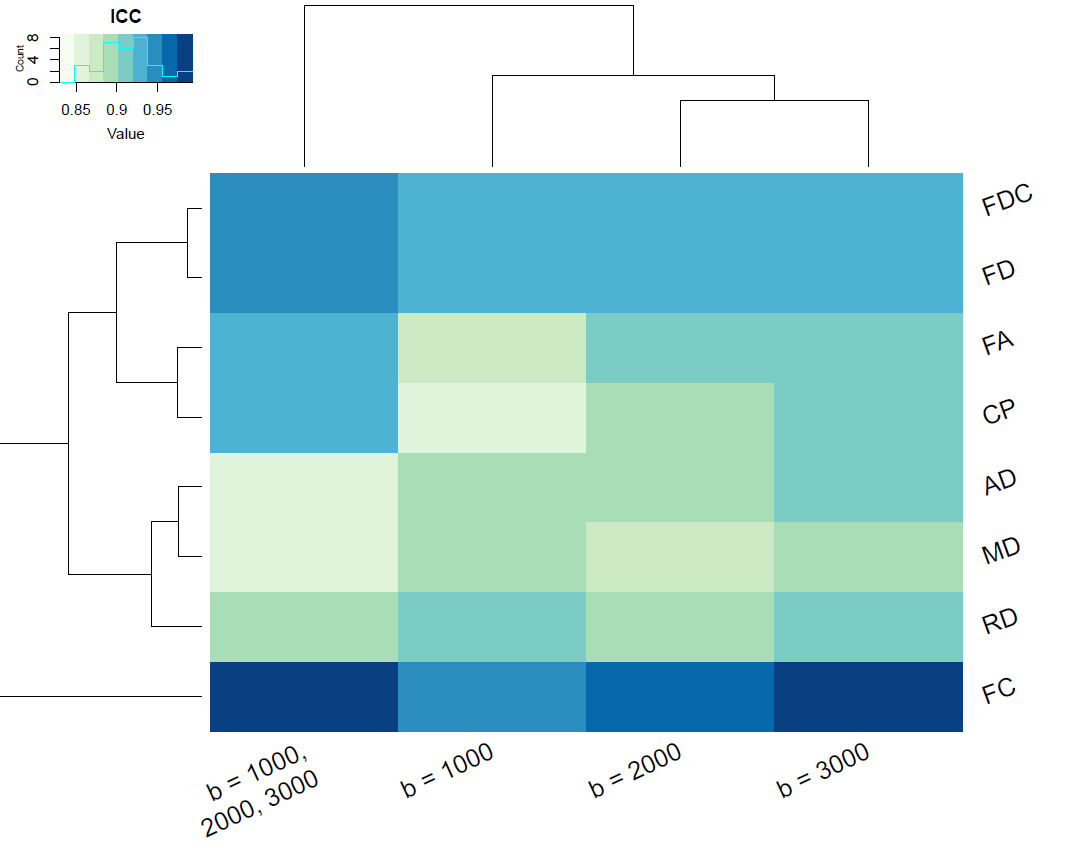
We found that the test-retest reliability measured by the intraclass correlation coefficient (ICC) was excellent for most of the metrics studied within the white matter, as shown in Figure 1. For intracellular volume fraction, isotropic volume fraction, and apparent diffusion coefficient, the ICC values were the lowest.In the analyses for the different tissue types, shown in Figure 2, for several metrics including the fractional anisotropy, orientation dispersion index, coefficient of planarity, and fiber density, the reproducibility was lower in the gray matter than in the white matter, and lowest within the subcortical gray matter voxels.
With respect to the number of peaks in the fiber orientation distribution, the reliability of the fiber density based metrics was generally lower for the voxels with three distinct peaks, as shown in Figure 3. However, most of the other metrics did not show a clear dependency on the number of peaks.
We found significant differences in the test-retest reliability of the bundle-level microstructural metrics, as shown in Figure 4. Moreover, some tracts-of-interest were more reliable than others, but these results varied to some extent depending on the metrics investigated.
Our results also showed that, in general, the reproducibility was highest when the full multi-shell data was used and was higher for high b-values compared to the low b-values, as shown in Figure 5.
Discussion
We showed that the test-retest reliability of the fixel- and voxel-level microstructural metrics was generally good (ICC=0.8-0.9) to excellent (ICC>0.9). Intracellular volume fraction and isotropic volume fraction from NODDI and apparent diffusion coefficient from DTI showed slightly lower reproducibility. Our results regarding the NODDI metrics were comparable to recent studies5-6.In the bundle-level analyses, we found that the reproducibility was excellent for all FBA-based metrics and for fractional anisotropy and coefficient of planarity. For the other metrics, the reproducibility was generally good-to-excellent with only a few bundles with ICC values below 0.8. Particularly for the corpus callosum, fornix, and anterior commissure, the microstructural metrics were more reproducible than for the other bundles.
Our results indicate that microstructural properties measured with diffusion MRI, and especially by using the fixel-based analysis pipeline, are highly robust and show excellent test-retest reliability both in local and bundle-level analyses.
Acknowledgements
TR received funding from the Finnish Cultural Foundation and Emil Aaltonen Foundation, Finland.
References
1. Roine, T., Jeurissen, B., Perrone, D., Aelterman, J., Philips, W., Sijbers, J., & Leemans, A. (2019). Reproducibility and intercorrelation of graph theoretical measures in structural brain connectivity networks. Medical Image Analysis, 52, 56-67.
2. Pfefferbaum, A., Adalsteinsson, E., & Sullivan, E. V. (2003). Replicability of diffusion tensor imaging measurements of fractional anisotropy and trace in brain. Journal of Magnetic Resonance Imaging, 18(4), 427-433.
3. Vollmar, C., O'Muircheartaigh, J., Barker, G. J., Symms, M. R., Thompson, P., Kumari, V., ... & Koepp, M. J. (2010). Identical, but not the same: intra-site and inter-site reproducibility of fractional anisotropy measures on two 3.0 T scanners. NeuroImage, 51(4), 1384-1394.
4. Zhang, H., Schneider, T., Wheeler-Kingshott, C. A., & Alexander, D. C. (2012). NODDI: practical in vivo neurite orientation dispersion and density imaging of the human brain. NeuroImage, 61(4), 1000-1016.
5. Lehmann, N., Aye, N., Kaufmann, J., Heinze, H. J., Düzel, E., Ziegler, G., & Taubert, M. (2021). Longitudinal reproducibility of neurite orientation dispersion and density imaging (NODDI) derived metrics in the white matter. Neuroscience, 457, 165-185.
6. Lucignani, M., Breschi, L., Espagnet, M. C. R., Longo, D., Talamanca, L. F., Placidi, E., & Napolitano, A. (2021). Reliability on multiband diffusion NODDI models: a test Retest study on children and adults. NeuroImage, 118234.
7. Raffelt, D. A., Tournier, J. D., Smith, R. E., Vaughan, D. N., Jackson, G., Ridgway, G. R., & Connelly, A. (2017). Investigating white matter fibre density and morphology using fixel-based analysis. NeuroImage, 144, 58-73.
8. Van Essen, D. C., Smith, S. M., Barch, D. M., Behrens, T. E., Yacoub, E., Ugurbil, K., & Wu-Minn HCP Consortium. (2013). The WU-Minn human connectome project: an overview. NeuroImage, 80, 62-79.
9. Sotiropoulos, S. N., Jbabdi, S., Xu, J., Andersson, J. L., Moeller, S., Auerbach, E. J., ... & Wu-Minn Hcp Consortium. (2013). Advances in diffusion MRI acquisition and processing in the Human Connectome Project. Neuroimage, 80, 125-143.
10. Leemans, A., & Jones, D. K. (2009). The B‐matrix must be rotated when correcting for subject motion in DTI data. Magnetic Resonance in Medicine, 61(6), 1336-1349.
11. Andersson, J. L., & Sotiropoulos, S. N. (2016). An integrated approach to correction for off-resonance effects and subject movement in diffusion MR imaging. NeuroImage, 125, 1063-1078.
12. Andersson, J. L., Skare, S., & Ashburner, J. (2003). How to correct susceptibility distortions in spin-echo echo-planar images: application to diffusion tensor imaging. NeuroImage, 20(2), 870-888.
13. Collignon, A., Maes, F., Delaere, D., Vandermeulen, D., Suetens, P., & Marchal, G. (1995, June). Automated multi-modality image registration based on information theory. In Information processing in medical imaging (Vol. 3, No. 6, pp. 263-274).
14. Raffelt, D., Tournier, J. D., Rose, S., Ridgway, G. R., Henderson, R., Crozier, S., ... & Connelly, A. (2012). Apparent fibre density: a novel measure for the analysis of diffusion-weighted magnetic resonance images. Neuroimage, 59(4), 3976-3994.
15. Tournier, J. D., Smith, R., Raffelt, D., Tabbara, R., Dhollander, T., Pietsch, M., ... & Connelly, A. (2019). MRtrix3: A fast, flexible and open software framework for medical image processing and visualisation. NeuroImage, 202, 116137.
16. Basser, P. J., Mattiello, J., & LeBihan, D. (1994). MR diffusion tensor spectroscopy and imaging. Biophysical Journal, 66(1), 259-267.
17. Westin, C. F., Maier, S. E., Mamata, H., Nabavi, A., Jolesz, F. A., & Kikinis, R. (2002). Processing and visualization for diffusion tensor MRI. Medical Image Analysis, 6(2), 93-108.
18. Jeurissen, B., Tournier, J. D., Dhollander, T., Connelly, A., & Sijbers, J. (2014). Multi-tissue constrained spherical deconvolution for improved analysis of multi-shell diffusion MRI data. NeuroImage, 103, 411-426.
19. Dhollander, T., Raffelt, D., & Connelly, A. (2016, September). Unsupervised 3-tissue response function estimation from single-shell or multi-shell diffusion MR data without a co-registered T1 image. In ISMRM Workshop on Breaking the Barriers of Diffusion MRI (Vol. 5, No. 5). ISMRM.
20. Wasserthal, J., Neher, P., & Maier-Hein, K. H. (2018). TractSeg-Fast and accurate white matter tract segmentation. NeuroImage, 183, 239-253.
21. Tournier, J. D., Calamante, F., & Connelly, A. (2010). Improved probabilistic streamlines tractography by 2nd order integration over fibre orientation distributions. In Proceedings of the International Society for Magnetic Resonance in Medicine (Vol. 1670). New Jersey, USA: John Wiley & Sons, Inc.
Figures