0980
Probing complex morphologies at decreasing diffusion times using Diffusion-weighted MR Spectroscopy1Danish Research Center for Magnetic Resonance, Copenhagen University Hospital - Amager and Hvidovre, Hvidovre, Denmark, 2Danish Research Center for Magnetic Resonance, Copenhagen University Hospital Amager and Hvidovre, Hvidovre, Denmark, 3Random Walk Imaging, Lund, Sweden, 4HYPERMAG, DTU, Copenhagen, Denmark, 5MIRCen, Commissariat à l' energie atomique et aux Energies Alternatives, Fontenay-aux-Roses, France, 6Department of Applied Mathematics and Computer Science, Technical University of Denmark, Kongens Lyngby, Denmark
Synopsis
Metabolite diffusion provide the unique ability to study the intracellular environment of specific cell types of the brain. Multiple studies suggest that the diffusivity along dendrites and axons is time dependent due to variations in diameter. We explore the signal due to such effects in Monte Carlo simulations in settings feasible for preclinical PGSE measurements and find that time dependent kurtosis, but not diffusivity provide the most potent source of contrast to this effect. We observe similar effects of intraneuronal NAA diffusion in rat.
Introduction
Morphology is varying along axons and dendrites, such as thickness (varicosities), and dispersedly located mitochondria and spines (1, 2). Such features may occur on length scales of 1-10 µm and affect time dependent diffusion (TDD) in diffusion weighted MRI experiments (1, 2, 3, 4, 5). Diffusion-weighted MR spectroscopy (DW-MRS) is able to measure the diffusion of endogenous metabolites such as N-Acetyl-Aspartate (NAA) providing a probe with a high specificity to the intra-neuronal space (6). In experiments with longer diffusion times (>50 ms), the diffusivity of NAA corresponded well to disperse “sticks” defined by an axial diffusivity but a negligible transverse diffusivity (7, 8). However, at decreasing diffusion times, an increase in NAA diffusivity suggests the influence of more complex morphologies (9) while towards the tortuosity limit, diffusivity may be affected by exchange across fibrous branches of cells, as in astrocytes (8) . Understanding their influence on diffusion could provide valuable biomarkers of disease related changes. In this study, we are focusing on maximizing the contrast to noise in a PGSE DW-MRS experiments to demonstrate the effect where the amplitude or duration of transient effects are expected to change. Identifying optimal experimental parameters and the related feature on data is crucial for optimal sensitivity to underlying variations in morphology. Using our minimal geometrical Monte Carlo simulator of fibrous geometries (10), we show that the effects on time dependent diffusivity from variations along thin fibers on length scales 1-10 µm is small and attenuates quickly while transient kurtosis and higher order terms are long lived and more measurable. For intermediate diffusion times in a rotationally disperse region, we hypothesize that the signal will decay slower than that of a “stick” model. Preliminary data collected in one rat suggest small effects of time dependent Diffusivity or Kurtosis in the investigated range.Materials and Methods
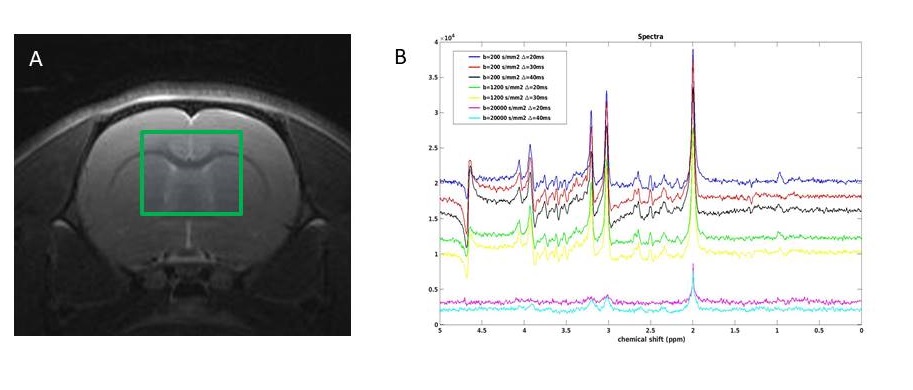
Monte Carlo simulation: We performed Monte Carlo simulations using our recently proposed model (10). Briefly, a long tubular structure with sinusoidally varying radius along its length was used. The substrate was constructed from: 50 connected segments, internode distances varying between 5-10 µm and a constant ratio between radii for each segment. Simulations used the free diffusion coefficient set to 0.8 µm2/ms similar to that of NAA (11), 106 walkers, a length step of 100 nm. The diffusion process was simulated over 100 ms with a typical computation time of 60 seconds. Time dependent diffusivity (D(t)) and Kurtosis (K(t)) where calculated from stored trajectories. Signals from a PGSE experiment were computed for δ = 8 ms, Δ = 20, 30 and 40 ms and with gradient amplitude G= [0 0.6] T/m. Signals were represented both as decays from a substrate aligned with the diffusion encoding gradients and as uniformly distributed powder average. Experimental : In-vivo experiments were conducted in a rat under Isoflurane (2.5% in air ) on a Bruker Biospin 7T (Ettlingen, Germany) MR Scanner equipped with 0.66 T/m gradients. The rat‘s head was secured in a stereotactic frame. Respiration and temperature (37.5 ± 0.5 °C) were monitored. Acquisitions were performed using a surface coil and a quadrature volume coil (Bruker, Germany). T2-weighted images for voxel positioning (Fig1.A) were used. DW-MRS was conducted using a modified PGSE version of a Spin-Echo (SE) LASER sequence with the following parameters: TR/TE-SE= 2000/50 ms; FOV = 30x30 mm2; VOI =6 x 6 x 6 mm3; fixed δ = 8 ms; Δ = 20, 30 and 40 ms and b values ranging from 0.1 to 20 ms/µm2. 64 FIDs were individually acquired (Spectral Width = 4000 Hz; 4096 points). With MAPSHIM, a water linewidth of 10.7 Hz was achieved. 64 FIDs were individually acquired (Spectral Width = 4000 Hz; 4096 points) and processed with in-house Matlab routines. Averaged spectra for different b and Δ values were subsequently realigned (Fig.1B). NAA maximum peak amplitudes were recorded and used for subsequent analysis and fitting procedures. For visualization a model of disperse sticks with Gaussian diffusion was fitted to data individually for each Δ.Results and Discussion
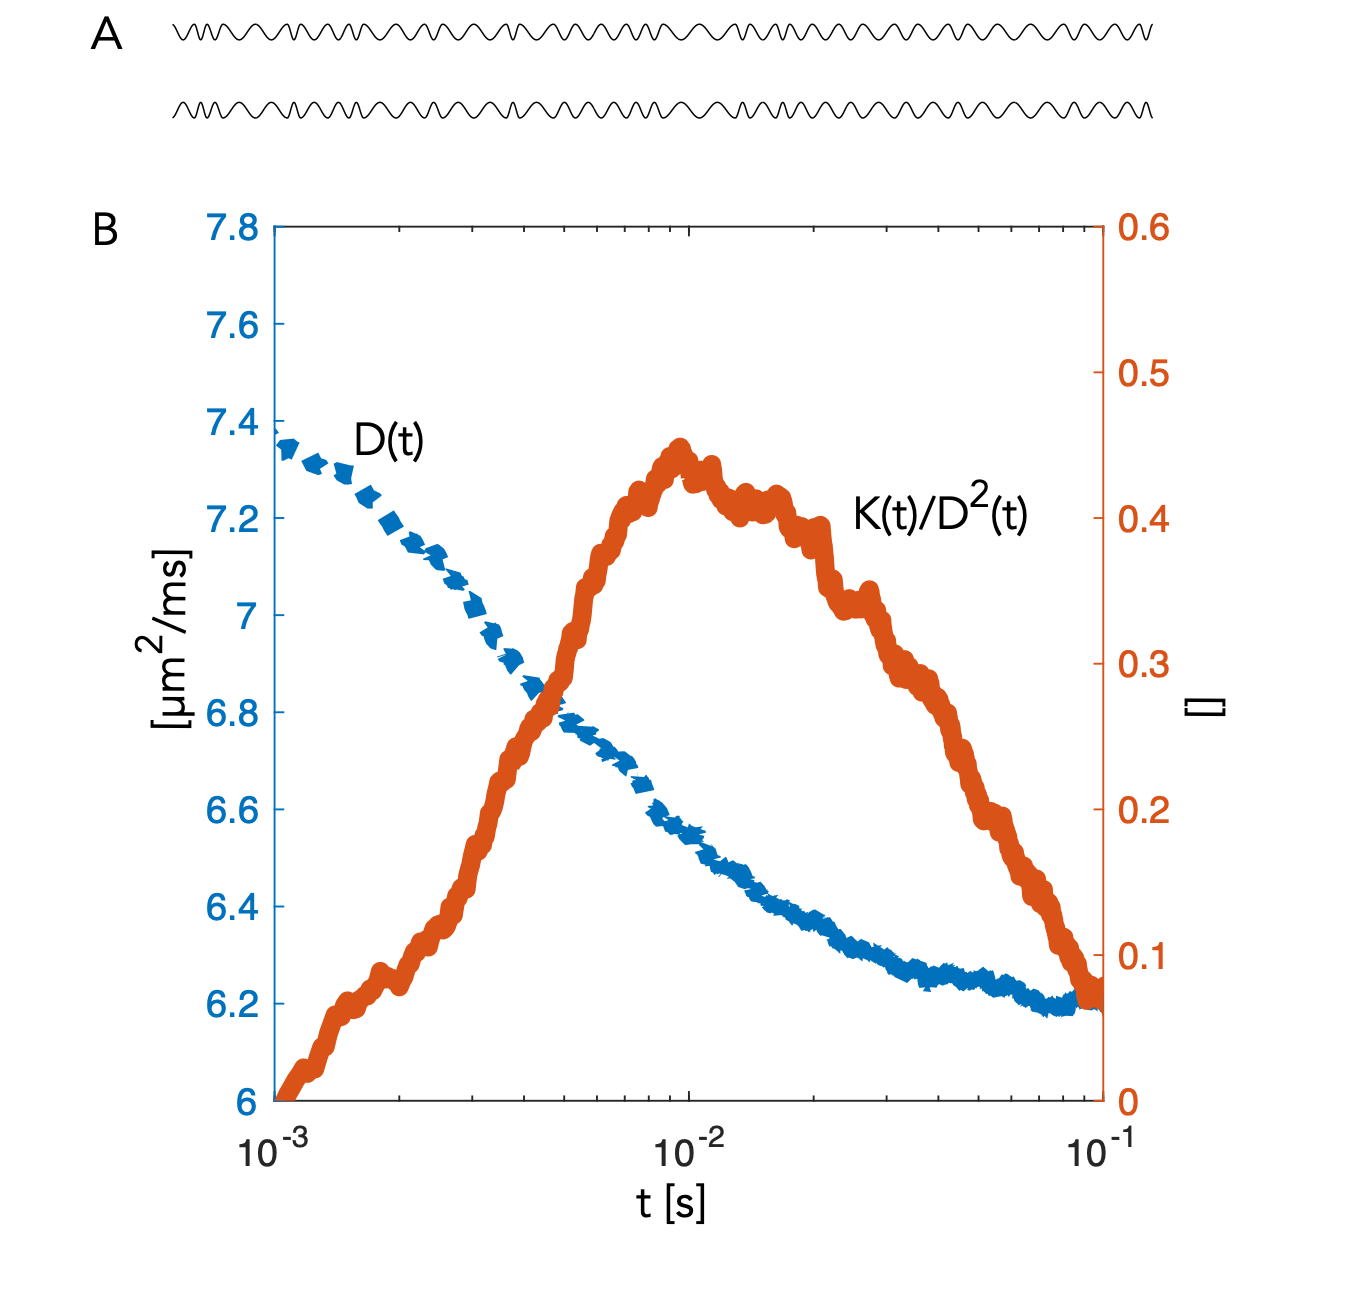
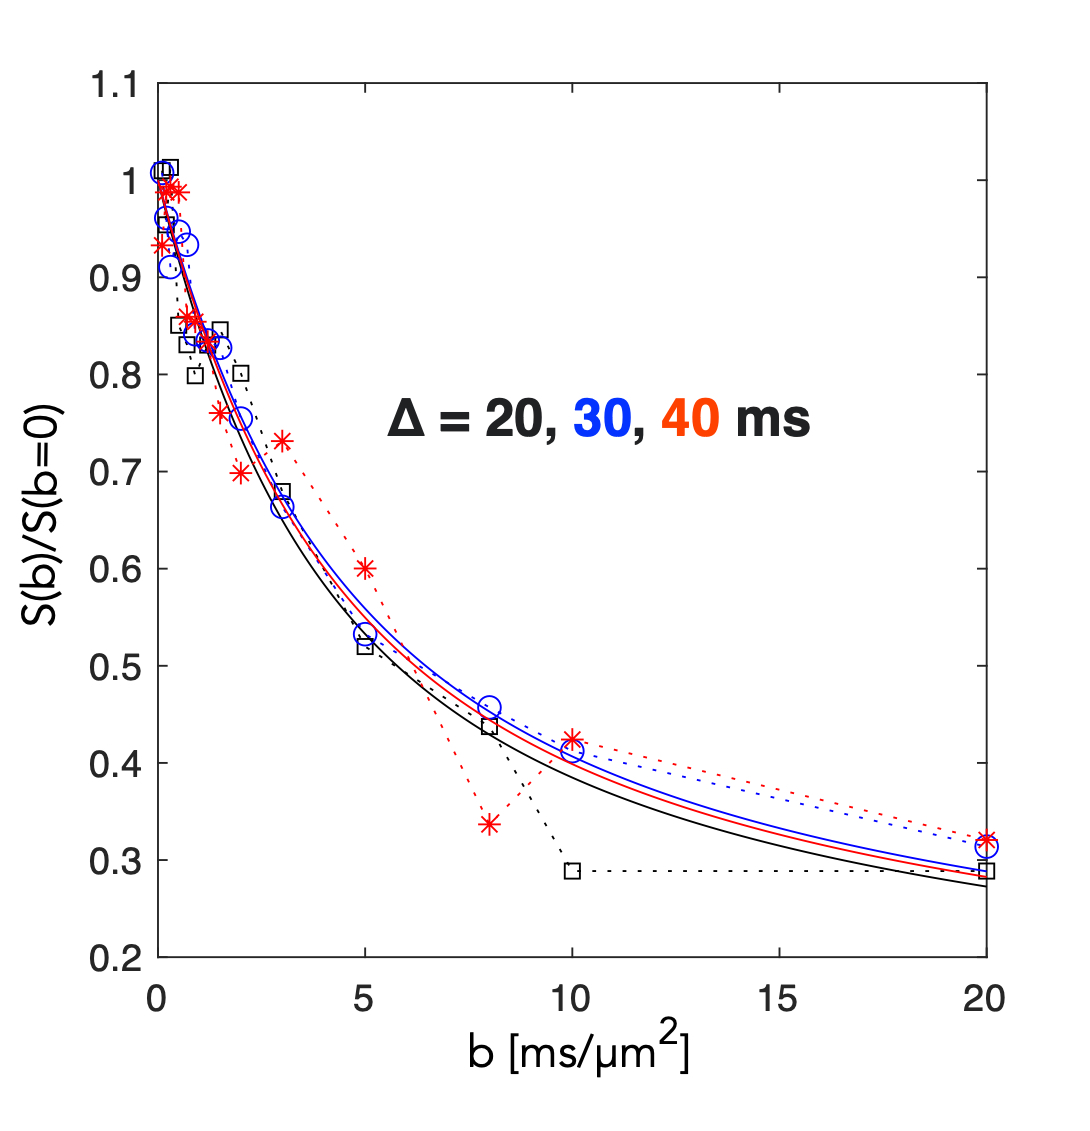
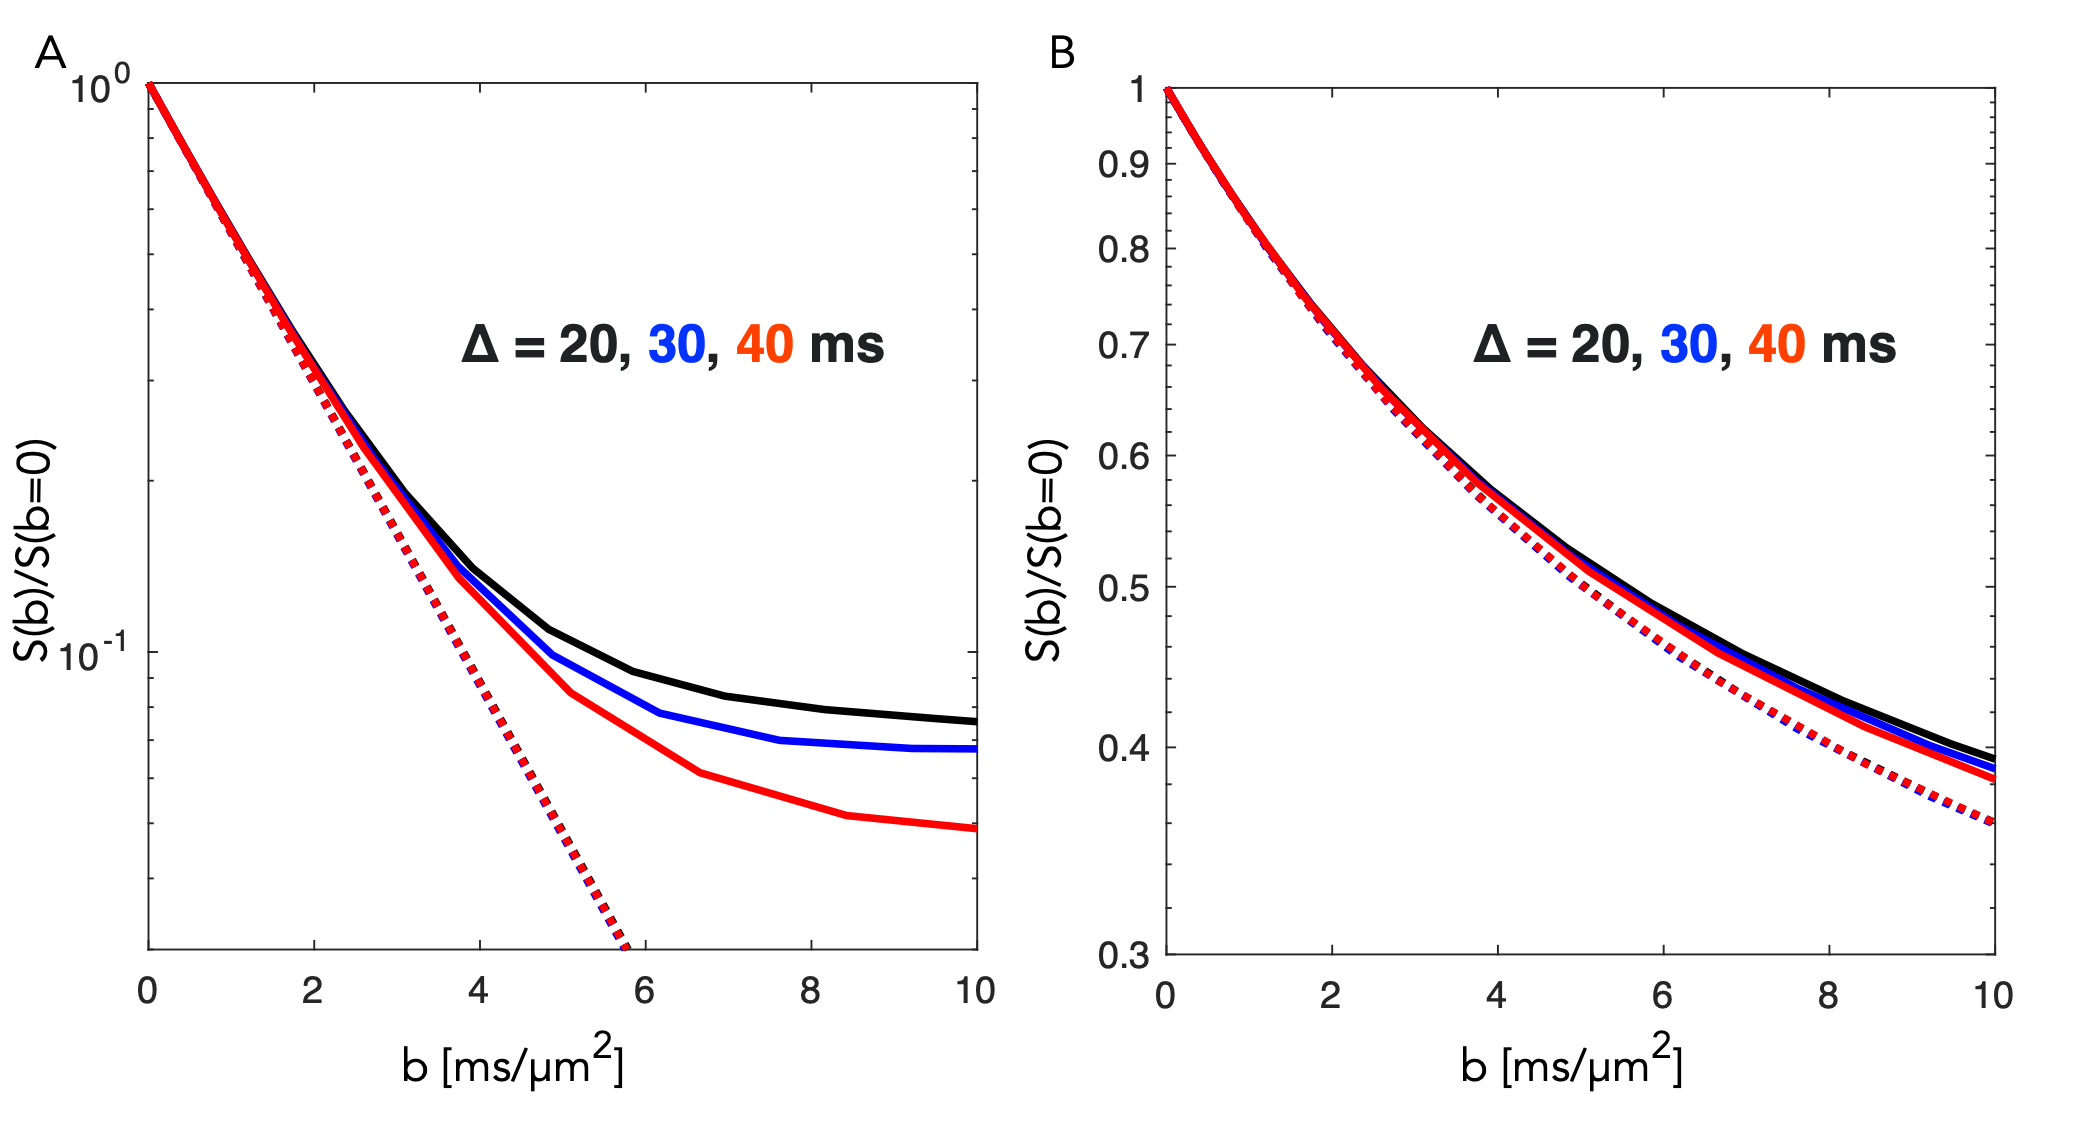
A segment of the simulated structure (Fig.2A) with computed D(t) and K(t) (Fig.2B) are shown. While D(t) attenuates from free diffusion to the tortuosity level within 20 ms reflecting the partial restriction of each internodal space, the process remains non-Gaussian over an extended range of diffusion times. Simulated signals from a PGSE experiment are shown from measurements along the substrate (Fig.3.A) and for a uniform distribution of the substrate (Fig.3.B). Signal attenuations for mono-exponential decays are extrapolated from the initial slope of each curve ( dispersion in Fig.3.B) and are overlapping for the different Δ, while Kurtosis and higher order terms provide a substantial contrast of >5% at large b-values over the simulated range of Δ. Fig.4.A shows attenuation curves normalized to a fitted S(b=0). The measurements and fits are strikingly consistent over the range of Δ, as previously concluded with longer diffusion times (7,8). However, for b=20 ms/µm2, datapoints diverge consistently above the gaussian model supporting the influence of additional non-gaussian effects. Various optimization strategies and evaluation of alternative encoding strategies (9, 10) will be included. Since the contrast is diluted by orientational dispersion (e.g in Fig.3A and B), higher sensitivity may also be achieved for macroscopic alignment .Acknowledgements
SL, NJ and HL have received funding from the European Research Council (ERC) under the European Union’s Horizon 2020 research and innovation programme (grant agreement No 804746).SL is supported also by Random Walk Imaging.References
1.Andersson M, Kjer HM, Rafael-Patino J, Pacureanu A, Pakkenberg B, Thiran JP, Ptito M, Bech M, Bjorholm Dahl A, Andersen Dahl V, Dyrby TB Axon morphology is modulated by the local environment and impacts the noninvasive investigation of its structure-function relationship. Proc Natl Acad Sci U S A. 2020 Dec 29;117(52):33649-33659. doi: 10.1073/pnas.2012533117.
2. Lee HH, Papaioannou A, Kim SL, Novikov DS, Fieremans E.A time-dependent diffusion MRI signature of axon caliber variations and beading. Commun Biol. 2020 Jul 7;3(1):354. doi: 10.1038/s42003-020-1050-x.
3. Lundell H, Ingo C, Dyrby TB, Ronen I.Cytosolic diffusivity and microscopic anisotropy of N-acetyl aspartate in human white matter with diffusion-weighted MRS at 7 T..NMR Biomed. 2021 May;34(5):e4304. doi: 10.1002/nbm.4304.
4. Novikov DS, Fieremans E, Jespersen SN, Kiselev VG.Quantifying brain microstructure with diffusion MRI: Theory and parameter estimation.NMR Biomed. 2019 Apr;32(4):e3998. doi: 10.1002/nbm.3998.
5. Palombo M, Ligneul C, Hernandez-Garzon E, Valette J.Can we detect the effect of spines and leaflets on the diffusion of brain intracellular metabolites?Neuroimage. 2017 May 8;182:283-293. doi: 10.1016/j.neuroimage.2017.05.003
6. Palombo M, Shemesh N, Ronen I, Valette J.Insights into brain microstructure from in vivo DW-MRS.Neuroimage. 2018 Nov 15;182:97-116. doi: 10.1016/j.neuroimage.2017.11.028 .
7.Kroenke, C. D., Ackerman, J. J. H., & Yablonskiy, D. A. (2004). On the nature of the NAA diffusion attenuated MR signal in the central nervous system. Magnetic Resonance in Medicine. https://doi.org/10.1002/mrm.20260.
8.Palombo, M., Ligneul, C., & Valette, J. (2017). Modeling diffusion of intracellular metabolites in the mouse brain up to very high diffusion-weighting: Diffusion in long fibers (almost) accounts for non-monoexponential attenuation. Magnetic Resonance in Medicine, 77(November 2016), 343–350. https://doi.org/10.1002/mrm.26548
9. Ligneul C, Valette J.Probing metabolite diffusion at ultra-short time scales in the mouse brain using optimized oscillating gradients and "short"-echo-time diffusion-weighted MRS.NMR Biomed. 2017 Jan;30(1):10.1002/nbm.3671.
10. Lundell H and Lasič S. A minimal geometrical model for Monte Carlo simulations of time dependent diffusion in axons. Proceedings of the ISMRM Conference 2020. Abstract 3403.
11.Lundell H, Najac C, Bulk M , Kan H, Webb AG, Ronen I Compartmental diffusion and microstructural properties of human brain gray and white matter studied with double diffusion encoding magnetic resonance spectroscopy of metabolites and water.Neuroimage2021 Jul 1;234:117981. doi: 10.1016/j.neuroimage.2021.117981
Figures