0979
Optimised Temporal Diffusion Ratio for Imaging Restricted Diffusion
William Richard Warner1, Andrada Ianus2, Noam Shemesh2, Malwina Molendowska3, Derek Jones3, Flavio Dell'Acqua4, Marco Palombo3,5, and Ivana Drobnjak1
1Computer Science Department, University College London, London, United Kingdom, 2Champalimaud Research, Champalimaud Centre for the Unknown, Lisbon, Portugal, 3Cardiff University Brain Research Imaging Centre, Cardiff, United Kingdom, 4NatBrainLab, King's College London, London, United Kingdom, 5School of Computer Science and Informatics, Cardiff University, Cardiff, United Kingdom
1Computer Science Department, University College London, London, United Kingdom, 2Champalimaud Research, Champalimaud Centre for the Unknown, Lisbon, Portugal, 3Cardiff University Brain Research Imaging Centre, Cardiff, United Kingdom, 4NatBrainLab, King's College London, London, United Kingdom, 5School of Computer Science and Informatics, Cardiff University, Cardiff, United Kingdom
Synopsis
Temporal Diffusion Ratio (TDR) is a recently proposed dMRI technique, with potential for mapping areas of restricted diffusion. We optimise the TDR diffusion sequences in simulation to provide maximum contrast for a range of restricted structures, finding sequence shapes and the optimal HARDI subset size for calculating TDR. We then demonstrate the results experimentally in-vivo on the human brain, and ex-vivo using a pre-clinical scanner on the mouse brain.
Introduction
Many diffusion MRI (dMRI) techniques aim to reveal tissue structure at microscopic scale1,2. A recent approach, called Temporal Diffusion Ratio (TDR3), maps restricted diffusion inside large axons and/or cell bodies, employing dMRI measurements with high b-value (>6000s/mm2 to attenuate fast (extracellular) diffusion) and two HARDI shells with different diffusion times. TDR employs standard acquisition sequences, makes no assumptions of the underlying tissue structure and requires no model fitting.We optimise gradient timings for TDR mapping, present a novel strategy for calculating TDR using subsets of full HARDI acquisitions and demonstrate optimised TDR using human and mouse brain-data.
Methods
TDR is computed by contrasting two direction-averaged dMRI signals using $$$\text{TDR}=\frac{(S_1-S_2)}{S_1}$$$ (S1>S2 in restrictions)3. Originally, the two signal acquisitions assumed equal gradient-pulse-duration 𝛿, and were not optimised3, hence limiting TDR contrast4.Simulations: Here, we optimise both the 𝛿 and the diffusion-time Δ of each acquisition to maximise TDR contrast. We consider substrate configurations for distributions of: a) parallel impermeable cylinders (~axons), and b) impermeable spheres (~cell bodies). We assume fixed b-values=8000s/mm2, limiting G≤600mT/m and Δ+δ≤45ms, ensuring sequence parameters achievable on preclinical scanners. Optimisations for Connectome are performed but not illustrated. Simulations use MISST (http://www.nitrc.org/projects/misst)5; optimisation is automated using an interior-point algorithm.
We use our optimal sequences to simulate TDR values across varied cylindrical and spherical distributions, demonstrating structures visible through TDR. Finally, we optimise the number of HARDI directions, taking subsets of our HARDI acquisitions that provide the highest signals given noise (SNR=10).
Human application: We use optimised TDR to map restriction in the human brain, in-vivo on data acquired on a healthy 35yo male participant under local ethics approval using a Siemens 3T-Connectome-scanner with HARDI protocol: TE=88ms, TR=4100ms, MB=2, BW=2272Hz, isotropic voxel size 2mm, 64 diffusion directions and 7 interleaved b0s. Acquisition parameters replicate the original TDR implementation3 and the proposed optimised one: constant b-value=8000s/mm2 with G/δ/Δ=150mT/m/10ms/54ms; G/δ/Δ=258mT/m/10ms/21ms and G/δ/Δ=85mT/m/21ms/43ms. To account for susceptibility distortions, 4 b=0 images were acquired with alternating EPI-PE directions. Data are preprocessed as in [3]. We compare optimised and non-optimised acquisitions alongside the effects of using highest-signal HARDI direction subsets in the TDR estimation.
Preclinical application: We investigate TDR contrast in the mouse brain, ex-vivo. All experiments were preapproved by the competent institutional and national authorities and were carried out in accordance with European Directive 2010/63.
Ex-vivo dMRI data was acquired on a 16.4T Bruker scanner using PGSE-EPI (TE=53ms, TR=3s, 12 averages, slice-thickness=0.5mm, in-plane-resolution=0.15x0.15mm, matrix-size=106x64). Data was acquired with b-value=8000s/mm2 and 60 directions. The following δ/Δ combinations were used: [Optimised TDR: δ/Δ={6.9/9;14/27.5}ms, Non-optimised TDR: δ/Δ={6.9/9;6.9/27.5}ms]. Gradient strength was artificially limited to 600 mT/m.
Results
As in [4], we find maximising TDR requires a short-δ, high-G sequence contrasted with a long-δ, lower-G sequence [here: S1:Δ=30.92ms,δ=14.08ms; S2:Δ=8.87ms,δ=6.87ms]. Fig.1 illustrates that the optimised Δ/δ combination maximises signal difference between the two acquisitions. The optimised sequences are extremely similar for cylinders and spheres, as well as for substrates with other size distributions (data not shown).Fig.2 shows how TDR varies across a range of differently-sized structures, showing TDR’s suitability for imaging structures containing large restrictions.
Fig.3 shows that in the presence of noise, using 12/60 of the highest-signal directions provides more accurate TDR than when using all 60 directions across most cylinder distributions. For all structures, using more directions improves the precision.
Fig.4 shows that optimised TDR provides higher contrast when imaging the human brain. In some areas of white matter, TDR values are higher when using fewer HARDI directions, supporting our simulations.
Fig.5 shows optimised and non-optimised TDR contrast in the mouse-brain, ex-vivo, illustrating the contrast improvement from optimisation. Positive TDR highlights areas of restriction in white matter and grey matter.
Discussion and Conclusions
We show that optimised TDR requires short-δ, high-G sequences contrasted with long-δ, low-G sequences[Figure1]. When imaging anisotropic structures (e.g. axons), using a subset of the highest-signal HARDI directions is optimal in the presence of noise, while for isotropic structures (e.g. cell bodies) all directions contribute to TDR.At Gmax=600mT/m, TDR provides good contrast to a range of structures, consistent with previous axon diameter imaging6. In human and mouse data, TDR values in white matter are positive, but low (<0.1), corresponding to small restriction sizes, as indicated by simulations. TDR values in gray matter are larger; optimised TDR offers an effective way to image spherical cells, such as granular layer cells in the olfactory bulb or cerebellum.
In this work only simple impermeable geometrical substrates are considered, so an exploration of negative TDR values is impossible. These are likely due to unmodelled exchange effects7,8. TDR contrast could be further improved by including other gradient shapes, such as oscillating gradients9.
Acknowledgements
This work is supported by an ESPRC studentship (EP/R513143/1); by ”la Caixa” Foundation (ID 100010434) and European Union’s Horizon 2020 research and innovation programme under the Marie Skłodowska-Curie grant agreement No. 847648, fellowship code CF/BQ/PI20/11760029; by a Wellcome Trust Investigator Award (096646/Z/11/Z) and a Wellcome Trust Strategic Award (104943/Z/14/Z); by an EPSRC equipment grant (EP/M029778/1); by a Siemens Healthcare Limited grant; and by UKRI Future Leaders Fellowship (MR/T020296/1).References
- Alexander et al, Imaging brain microstructure with diffusion MRI: practicality and applications, NMRBiomed (2018) 32(4): e3841
- Novikov et al, Quantifying brain microstructure with diffusion MRI: Theory and parameter estimation, NMRBiomed (2018) 32(4): e3998
- Dell’Acqua,et al, Temporal Diffusion Ratio (TDR): A Diffusion MRI technique to map the fraction and spatial distribution of large axons in the living human brain. ISMRM 2019
- Warner, W. et al, Optimisation of Temporal Diffusion Ratio (TDR) to maximise its potential to map large axons: Insight from simulations. ISMRM (2020)
- Ianuş A., Alexander D.C., Drobnjak I. (2016) Microstructure Imaging Sequence Simulation Toolbox. In: Tsaftaris S., Gooya A., Frangi A., Prince J. (eds) Simulation and Synthesis in Medical Imaging. SASHIMI 2016. Lecture Notes in Computer Science, vol 9968. Springer, Cham. https://doi.org/10.1007/978-3-319-46630-9_4
- Drobnjak et al, PGSE, OGSE, and sensitivity to axon diameter in diffusion MRI: Insight from a simulation study Magnetic Resonance in Medicine (2016) 75(2):688-700
- Olesen et al. Diffusion time dependence, power-law scaling, and exchange in gray matter. arXiv preprint. 2021
- Jelescu et al. Neurite Exchange Imaging (NEXI): A minimal model of diffusion in gray matter with inter-compartment water exchange. arXiv preprint. 2021
- Arbabi et al, Diffusion dispersion imaging: Mapping oscillating gradient spin-echo frequency dependence in the human brain, Magnetic Resonance in Medicine (2020) 83(6):2197-2208
- Grussu F, et al. Relevance of time-dependence for clinically viable diffusion imaging of the spinal cord. Magnetic Resonance in Medicine. (2019) Feb;81(2):1247-1264
Figures

Figure 1: Optimisation results maximising TDR. (a+b) Maps showing the diffusion weighted signals for sequences with various δ/Δ combinations (b=8000s/mm2). White markers indicate the TDR-optimised (square) and non-optimised3 (circle) sequences. Simulations were done for (a) parallel cylinder and (b) sphere distributions with parameters as shown. (c) Schematic representation of non-optimized and optimized gradient shapes. Optimised TDR maximises the difference between two acquisition signals.
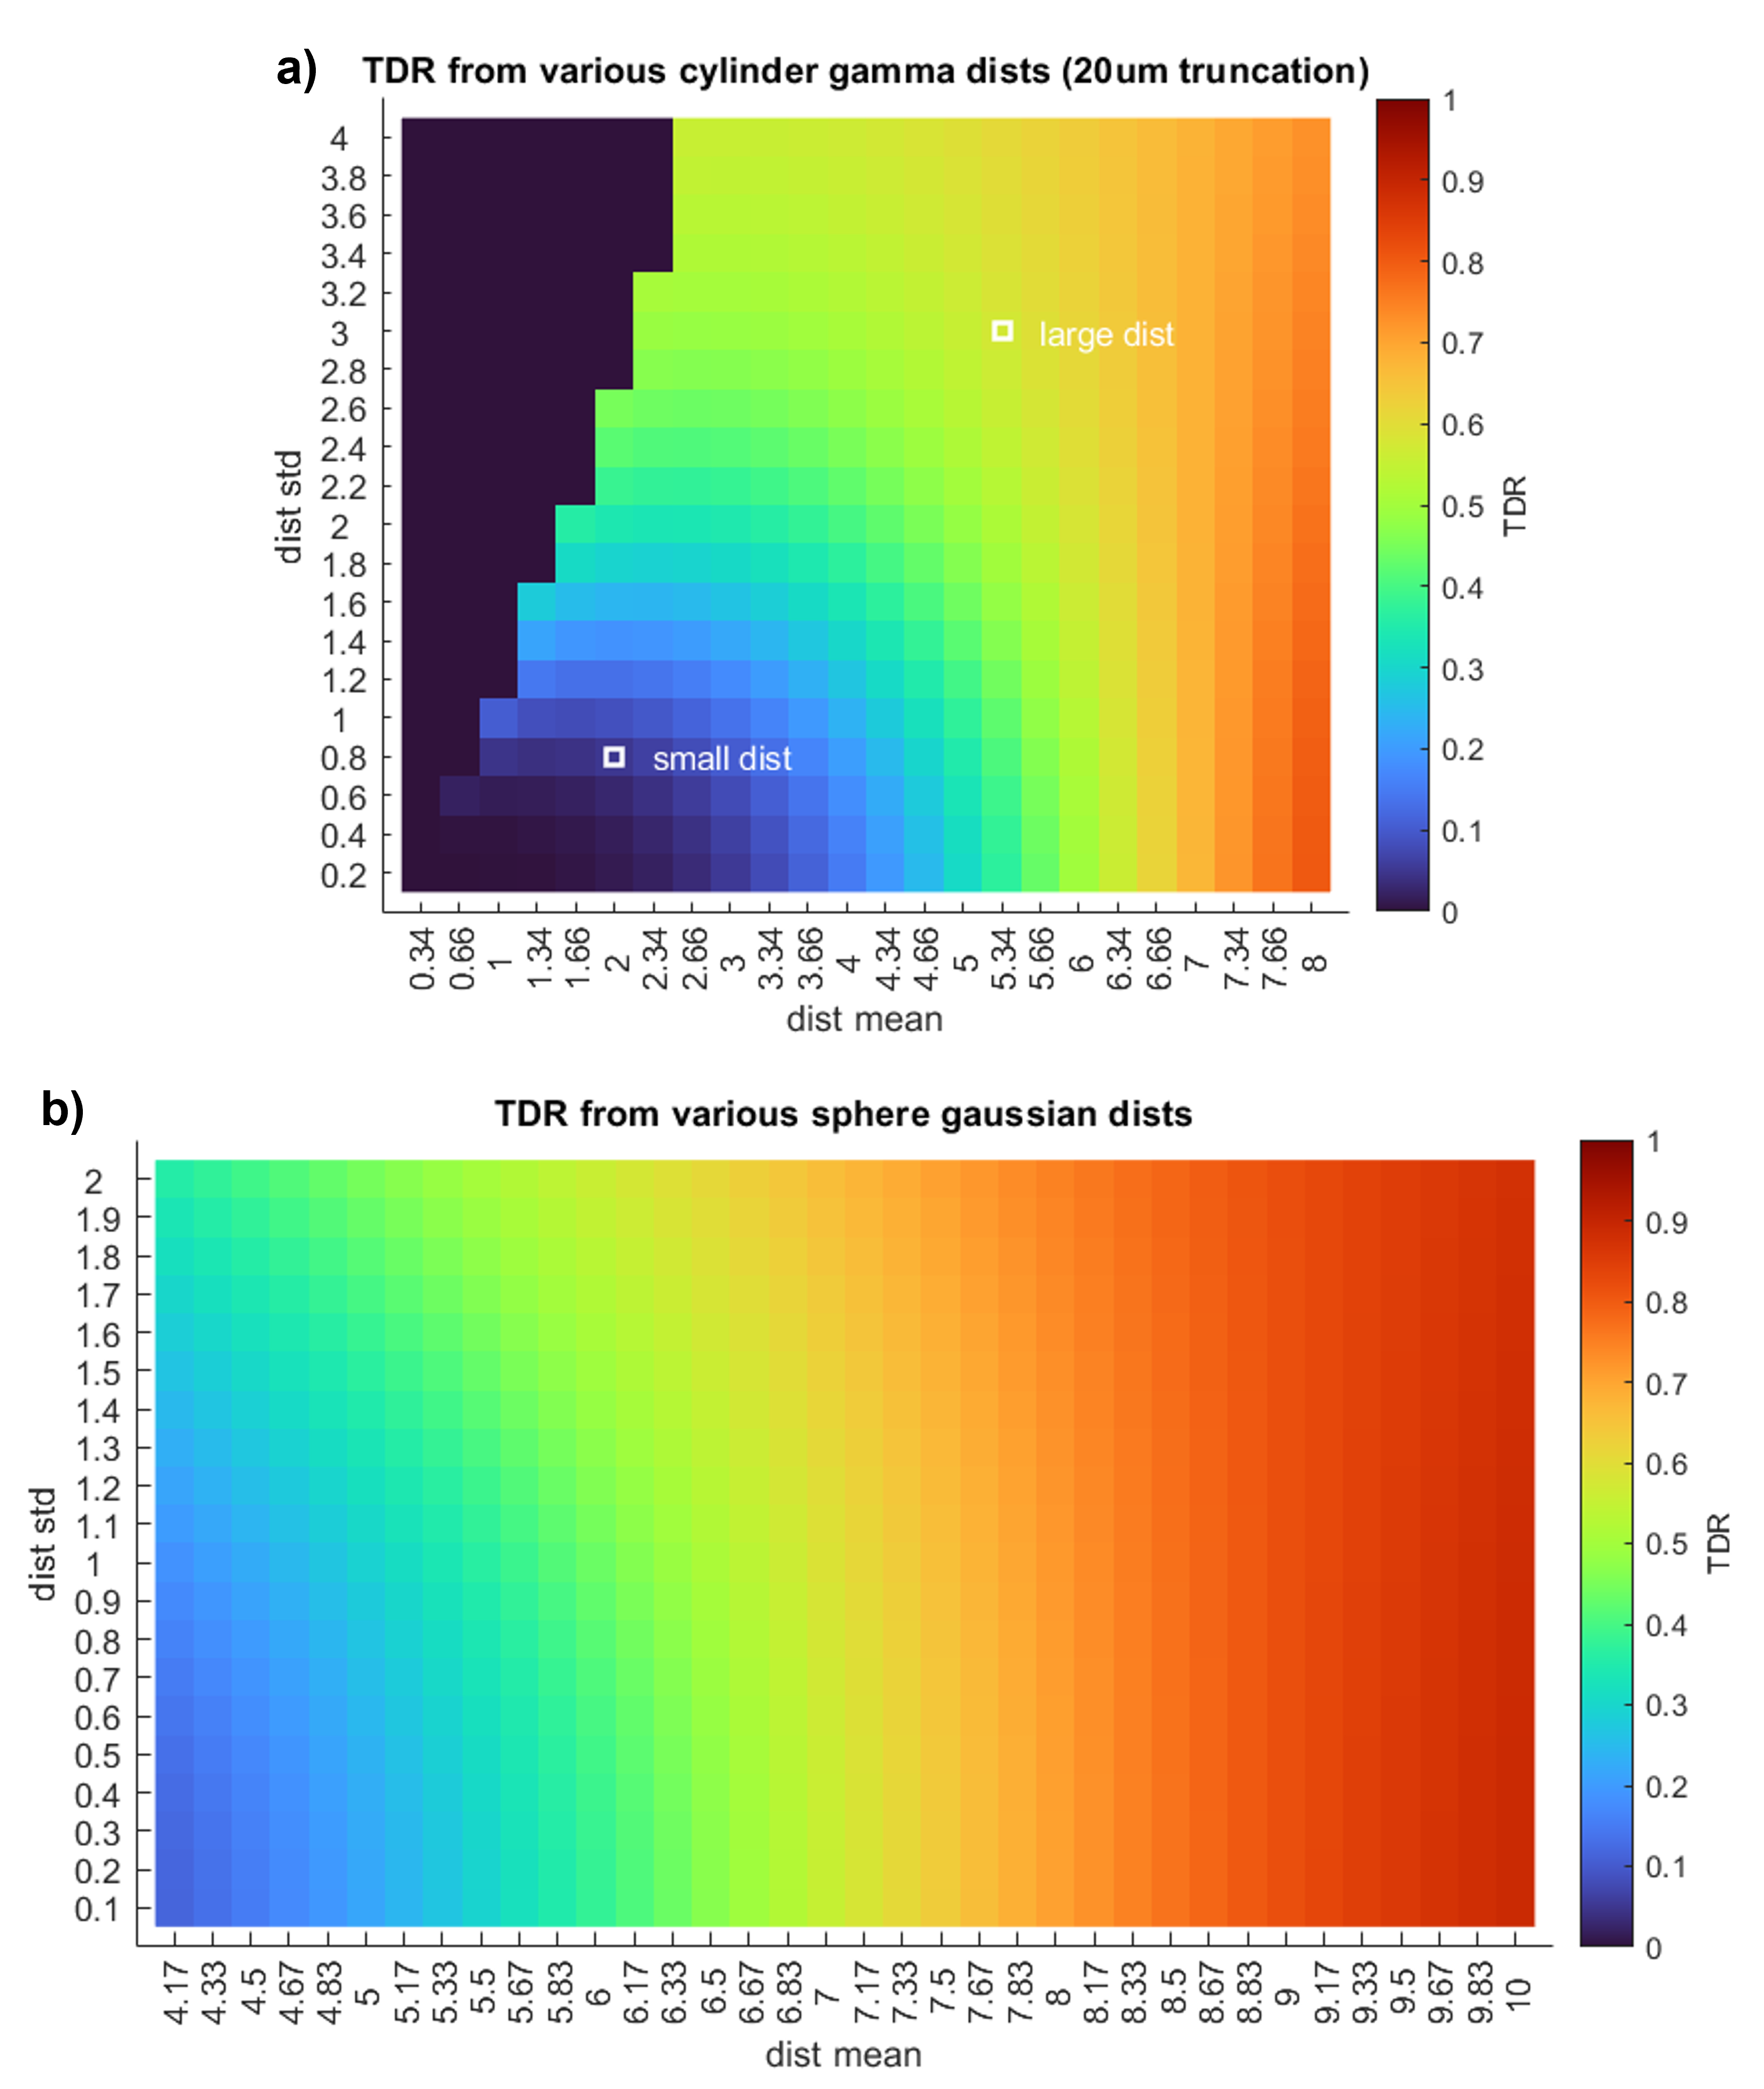
Figure 2: We simulate noise-free TDR signal obtained using the optimal parameters at Gmax=600mT/m from Experiment 1 [S1 Δ=30.92ms δ=14.08ms; S2 Δ=8.87ms δ=6.87ms]. Signal is simulated across a wide range of (a) cylinder and (b) spherical distributions. The location of typical large and small axon distributions10 are shown within the cylinder distribution plot.

Figure 3: (a+b) Blue circles show true TDR (SNR=inf), orange bars show 1std for TDR (Rician noise, SNR=10). (a) When imaging the typical10 large axon distribution, TDR is maximised and noise effects minimised if ~20% of the HARDI directions are used. (b) TDR imaging for non-directional structures such as spheres [Gaussian distribution, μ=7 σ=0.5] ideally uses all directions. (c+d) TDR returns higher signal from most axon distributions when 12/60 directions are used, compared to 60/60.
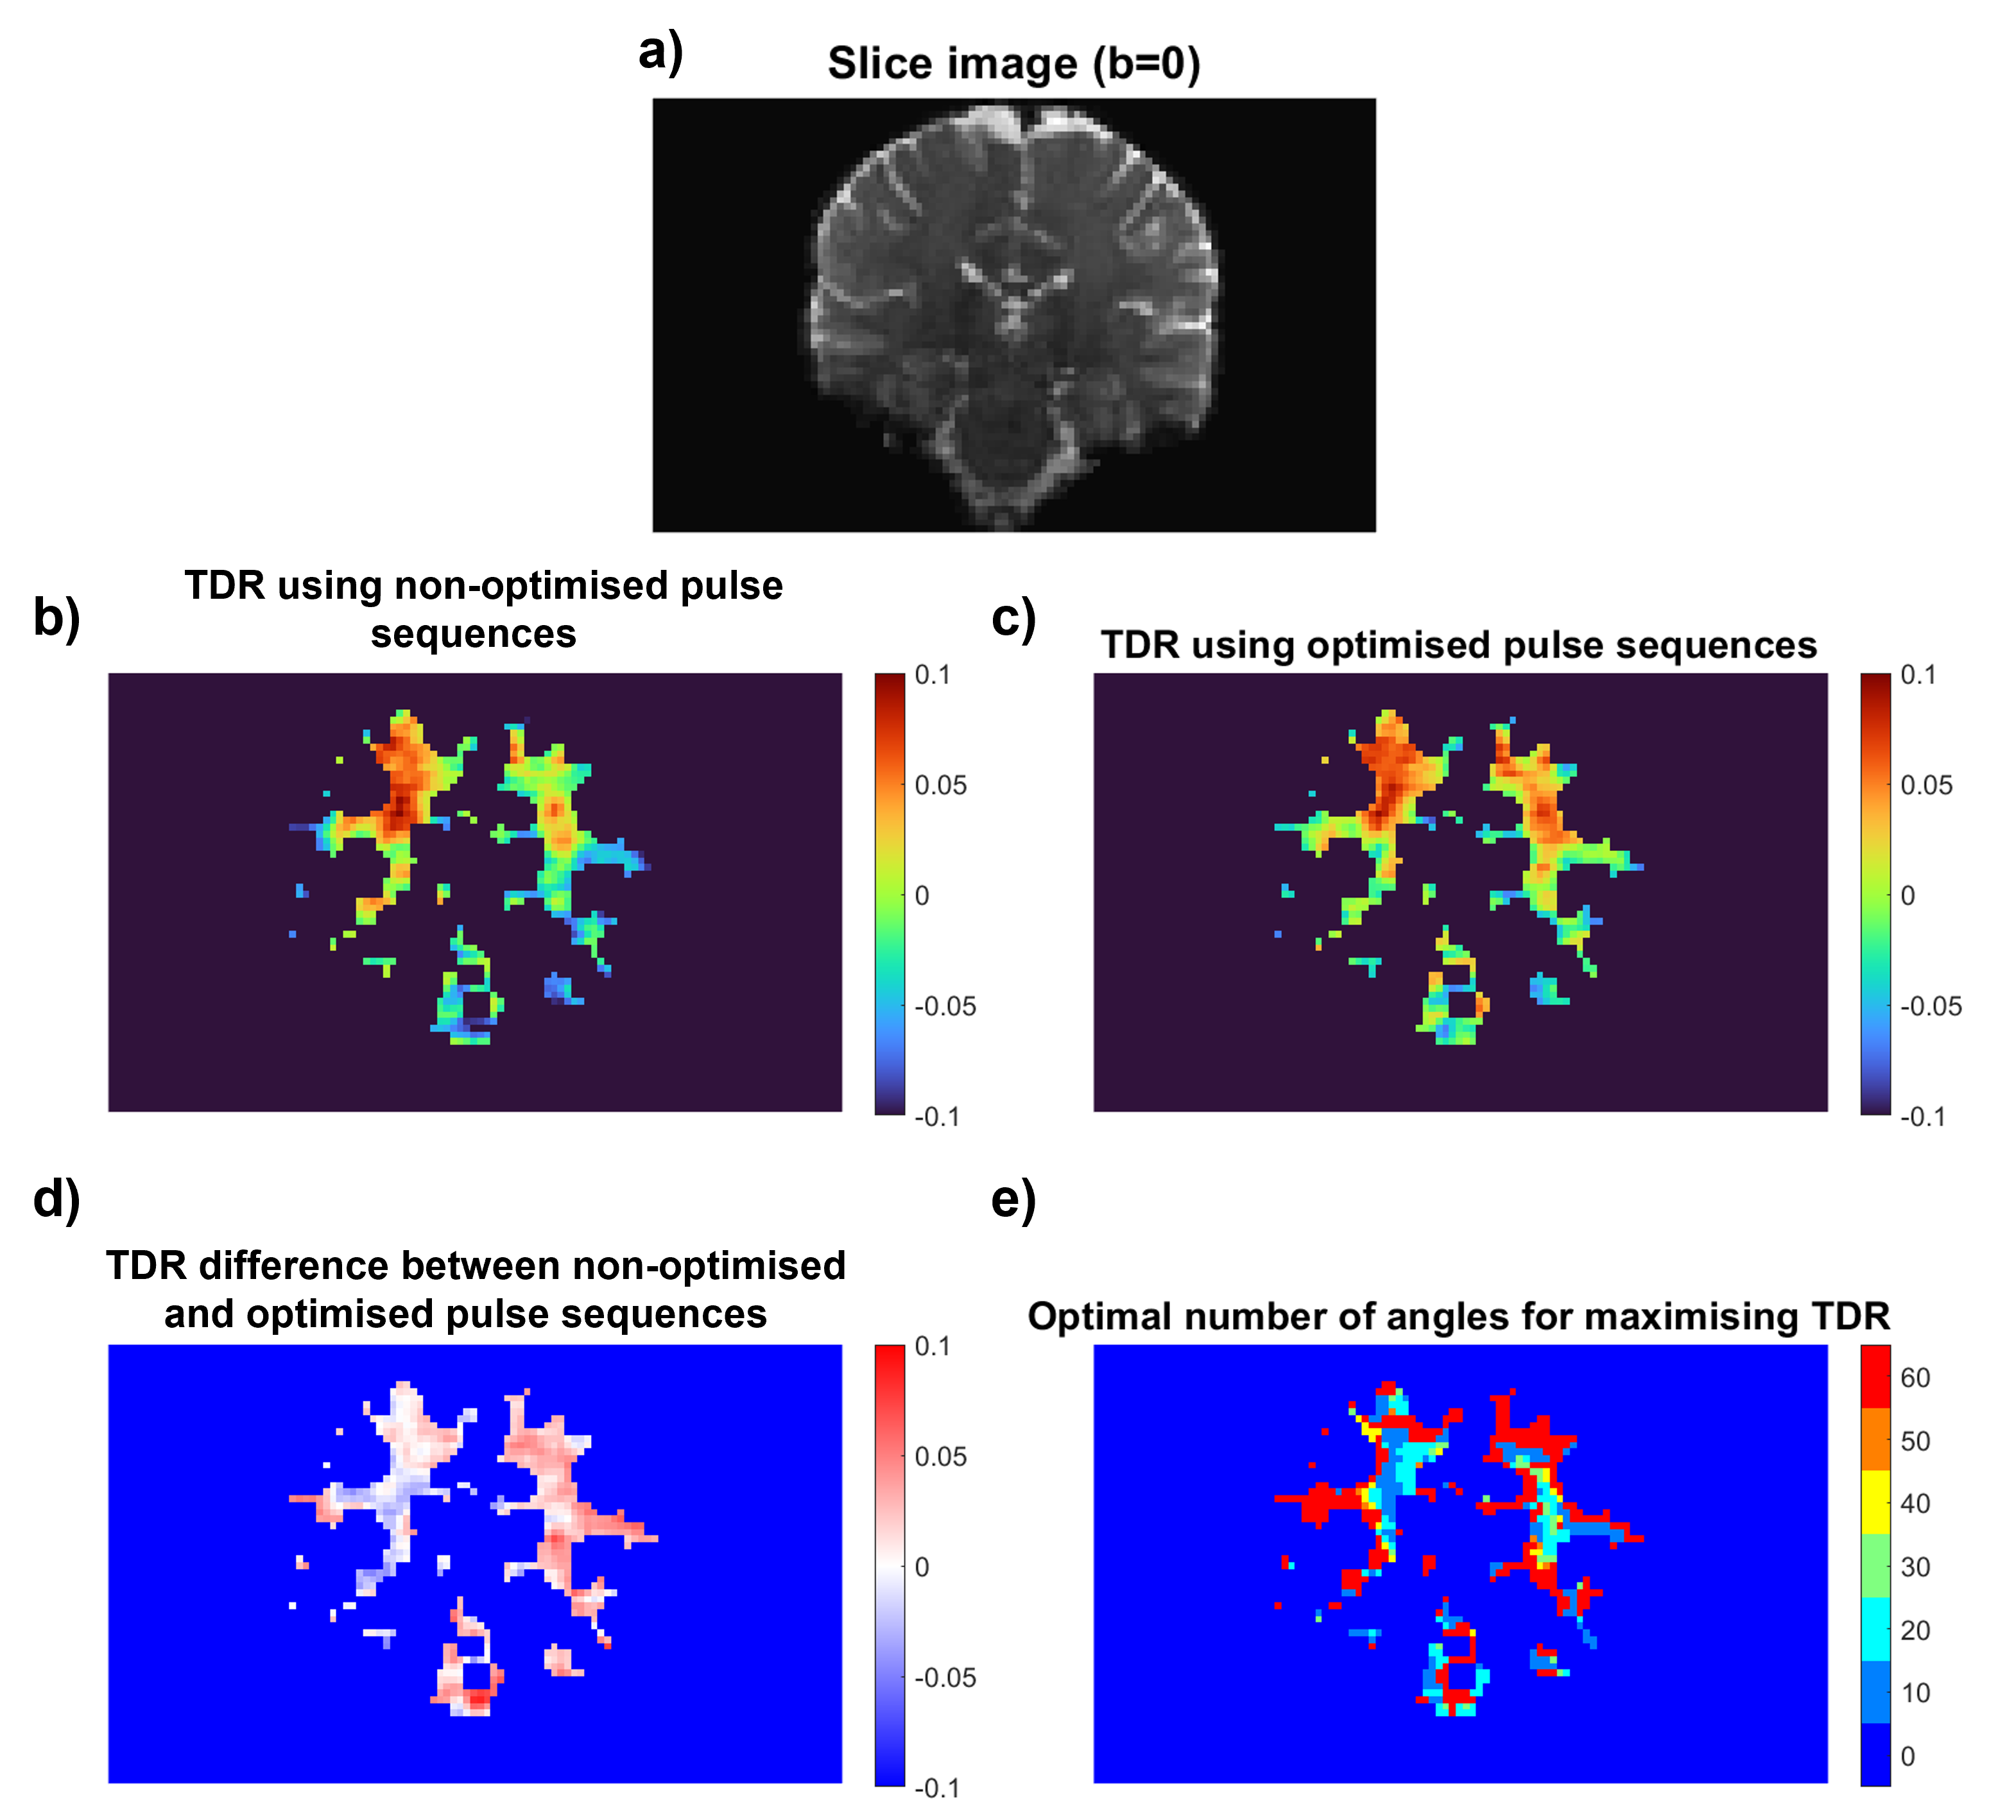
Figure 4: (a) b0 Slice image. (b) TDR acquired using non-optimised fixed δ acquisitions [S1 Δ=54ms δ=10ms; S2 Δ=21ms δ=10ms]. (c) TDR acquired using optimised acquisitions with comparable acquisition time [S1 Δ=43ms δ=21ms; S2 Δ=21ms δ=10ms]. (d) Signal difference between the two previous plots, showing areas where optimised TDR improves signal. (e) Map showing optimal HARDI subset sizes for maximising TDR at different locations.
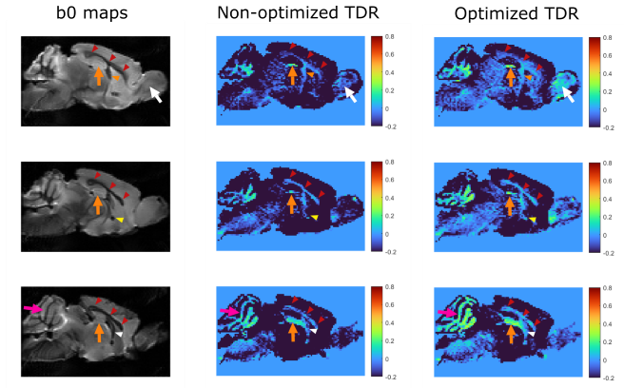
Figure 5: Optimised TDR in the mouse brain. Left: b0 maps indicating ROIs with restricted diffusion and positive TDR values. Arrowheads show WM regions (red: corpus callosum, orange: fimbria, yellow: anterior commissure, white: fornix); arrows show GM regions (pink: cerebellum - granular layer likely including WM tracts, orange: dentate gyrus of hippocampus, white: granule layer of the olfactory bulb). High TDR is observed in WM or GM regions with highly packed cells, e.g. granule layers.
DOI: https://doi.org/10.58530/2022/0979