0977
High Resolution Ex Vivo Diffusion Tensor Distribution MRI of Neural Tissue1The Henry M. Jackson Foundation for the Advancement of Military Medicine (HJF) Inc.,, Bethesda, MD, United States, 2Eunice Kennedy Shriver National Institute of Child Health and Human Development, National Institutes of Healt, Bethesda, MD, United States, 3Center for Neuroscience and Regenerative Medicine, Uniformed Services University of Health Sciences, Bethesda, MD, United States, 4University of Helsinki, Helsinki, Finland
Synopsis
Neural tissue microstructure plays a key role in developmental, physiological, and pathophysiological processes. Diffusion tensor distribution (DTD) MRI is a promising approach to resolve sub-voxel microstructural features using multiple diffusion encodings. In this study, we have applied a novel DTD framework and pulse sequence to investigate its capabilities in revealing neural tissue microstructure. We present high resolution data acquired using an excised visual cortex and cervical spinal cord of a macaque monkey. The results show DTD MRI untangles size, shape and orientation heterogeneity within a voxel and parcellates tissue consistent with histological findings.
Introduction
In the continuing quest to characterize it at ever finer length scales, we use a novel diffusion tensor distribution (DTD) paradigm to probe microstructural features much smaller than the nominal MRI voxel size. The DTD is a normal tensor variate distribution whose samples are constrained to be positive definite (CNTVD) characterized by a mean and covariance tensor. We estimate this DTD using Monte Carlo signal inversion combined with parsimonious model selection framework that exploits a hierarchy of symmetries of mean and covariance tensors. High resolution multiple pulsed field gradient (mPFG) MRI measurements were performed using excised visual cortex and spinal cord from perfusion-fixed macaque monkey brain to investigate the capabilities of DTD MRI in revealing neural tissue microstructural and architectural features using strong gradients not typically available in clinical MRI scanners.Methods
Assuming Gaussian diffusion in microscopic water pools within a voxel, the signal model is given by1,$$
S(b_{ij}) = S_0 \left(\overline{e^{-b_{ij}D_{ij}}} + \varepsilon\right)
$$
where the overbar denotes averaging over the DTD, $$$b_{ij}, D_{ij}$$$ are the b-tensor and diffusion tensor respectively, and $$$\varepsilon$$$ is the offset parameter used to model the so called dot-compartment thought exist at large b-values2. The above signal model, estimated using Monte Carlo method by drawing samples from CNTVD, is fitted to DWIs acquired with rank-1 and rank-2 b-tensors to estimate the mean and covariance tensor of CNTVD3.
From the microscopic diffusion tensors sampled from the estimated CNVTD, microscopic fractional anisotropy (μFA) and micro-orientation distribution function (μODF) is calculated based on the non-commutativity of the FA and ODF operator as shown below,
$$
μFA = \overline{FA(D_{ij})} \neq FA(\overline{D_{ij}}), μODF = \overline{ODF(D_{ij})} \neq ODF(\overline{D_{ij}})
$$
We also quantify the size (Vsize) and shape (Vshape) heterogeneity of micro-diffusion tensors within a voxel as the normalized median absolute deviation of their average trace and FA-weighted skewness of the eigenvalues, respectively. The orientation heterogeneity (Vorient) is quantified as the extent of dispersion of the eigenvectors of the micro-diffusion tensors around the mean eigenvector3. These metrics are normalized between 0 and 1 and increase with the increasing amount of heterogeneity within the voxel. In addition, the distribution of apparent diffusion coefficient (ADC) is obtained from the histogram of average trace of micro-diffusion tensors whose moments are measured and mapped.
The diffusion measurements encoded with rank-1 and rank-2 b-tensors were acquired using a novel double PFG pulse sequence in a single spin echo with the two independent trapezoidal gradients sandwiched between the 180o RF pulse to reduce echo time. MRI data was acquired on a 7T system (Bruker Biospin) capable of up to 1,500 mT/m gradient strength and 8,700 T/m/s slew rate. The visual cortex specimen was imaged at 100 μm × 100 μm × 250 μm spatial resolution using 6-shot 3D EPI with the following parameters: Δ/δ = 10/3.5 ms, TR/TE = 1200/25 ms and 4 averages. The spinal cord was imaged at 125 μm × 125 μm × 1 mm spatial resolution using 2-shot 3D EPI with the following parameters: Δ/δ = 20/5 ms, TR/TE = 1000/60 ms and 4 averages. A total of 217 different b-tensors were sampled with b-values ranging from 0 - 6,000 s/mm2 for the visual cortex and 0 - 12,000 s/mm2 for the spinal cord. The DWIs were denoised4, and registered using the FSL software5 before fitting the model.
Results and Discussion
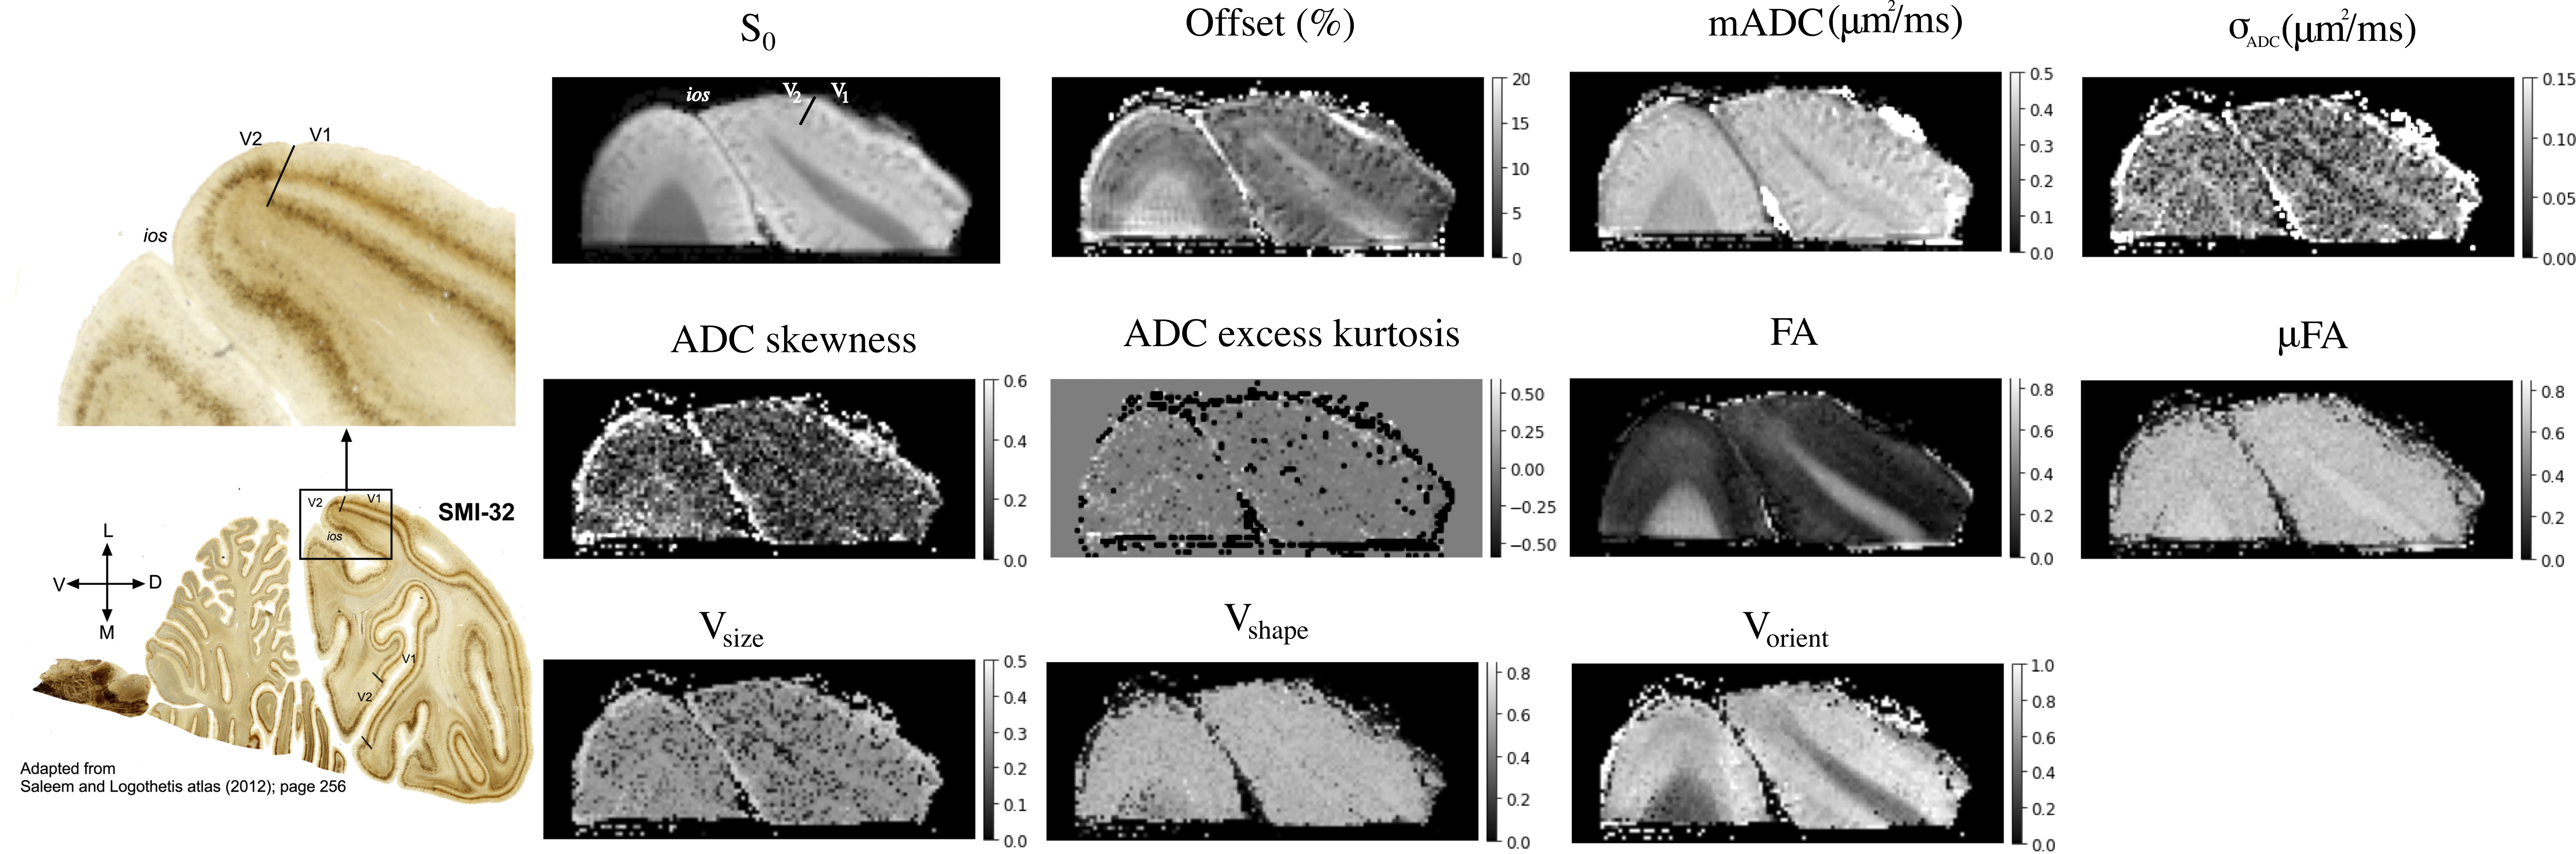
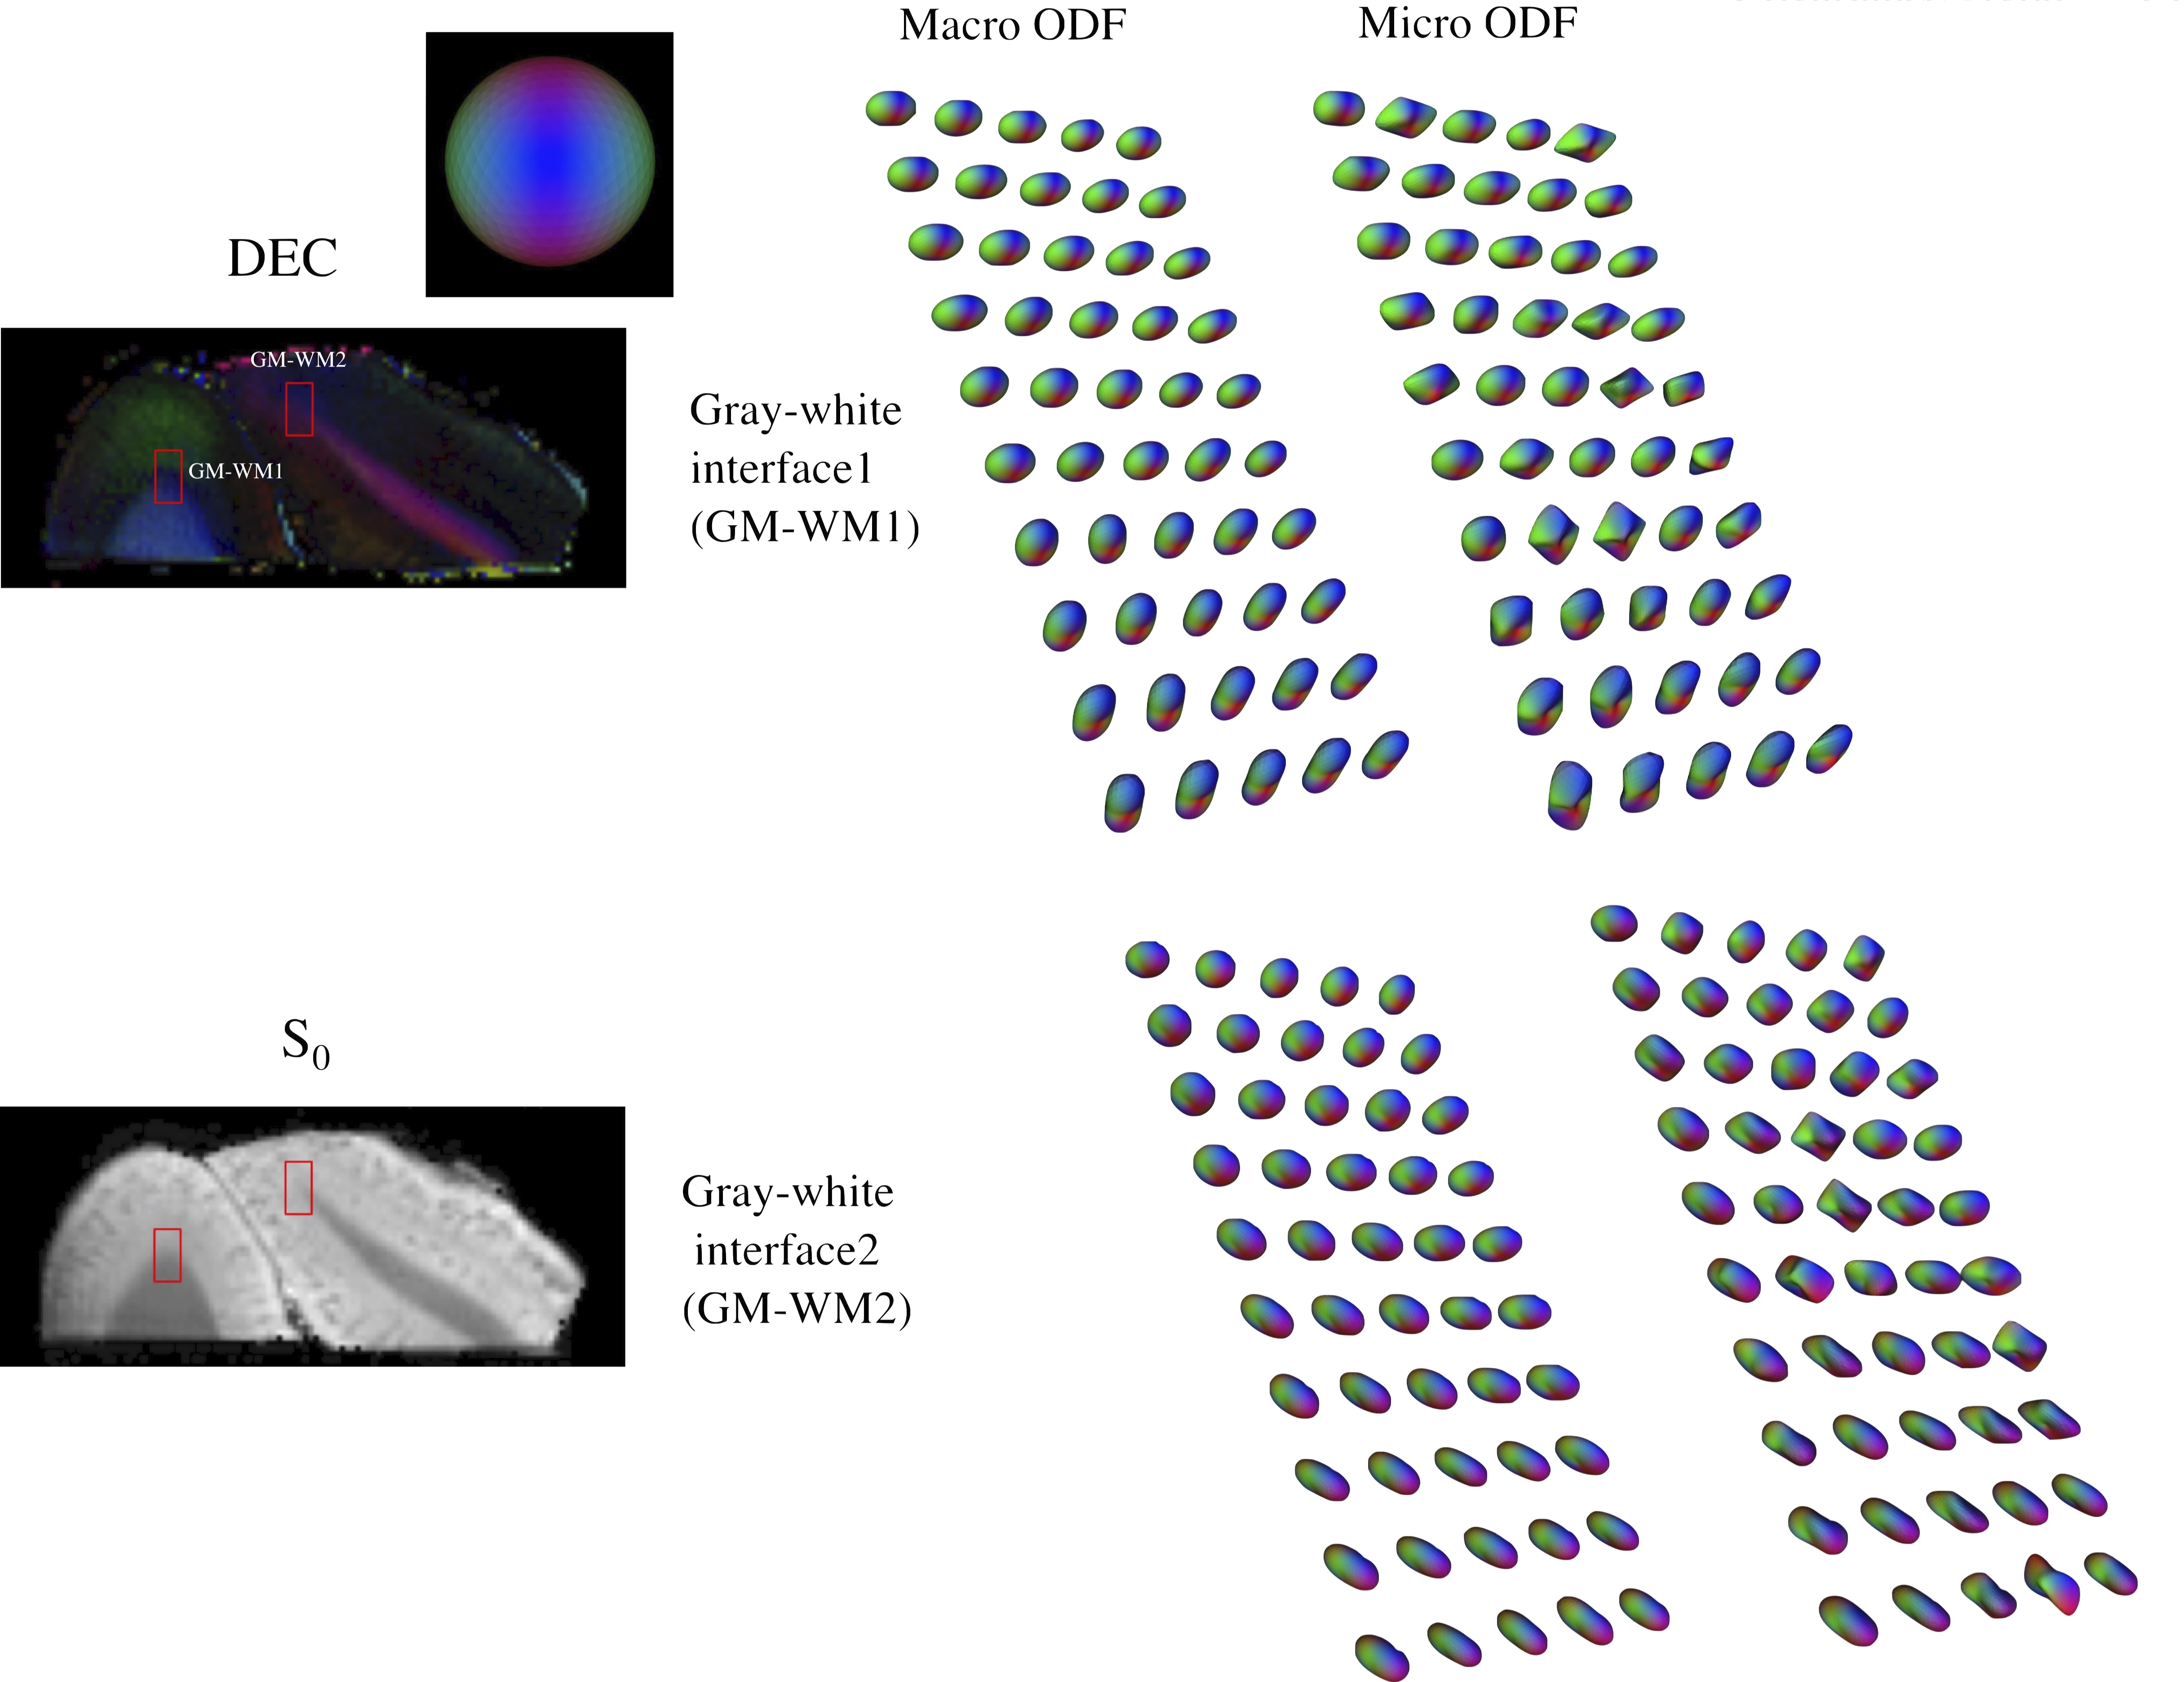
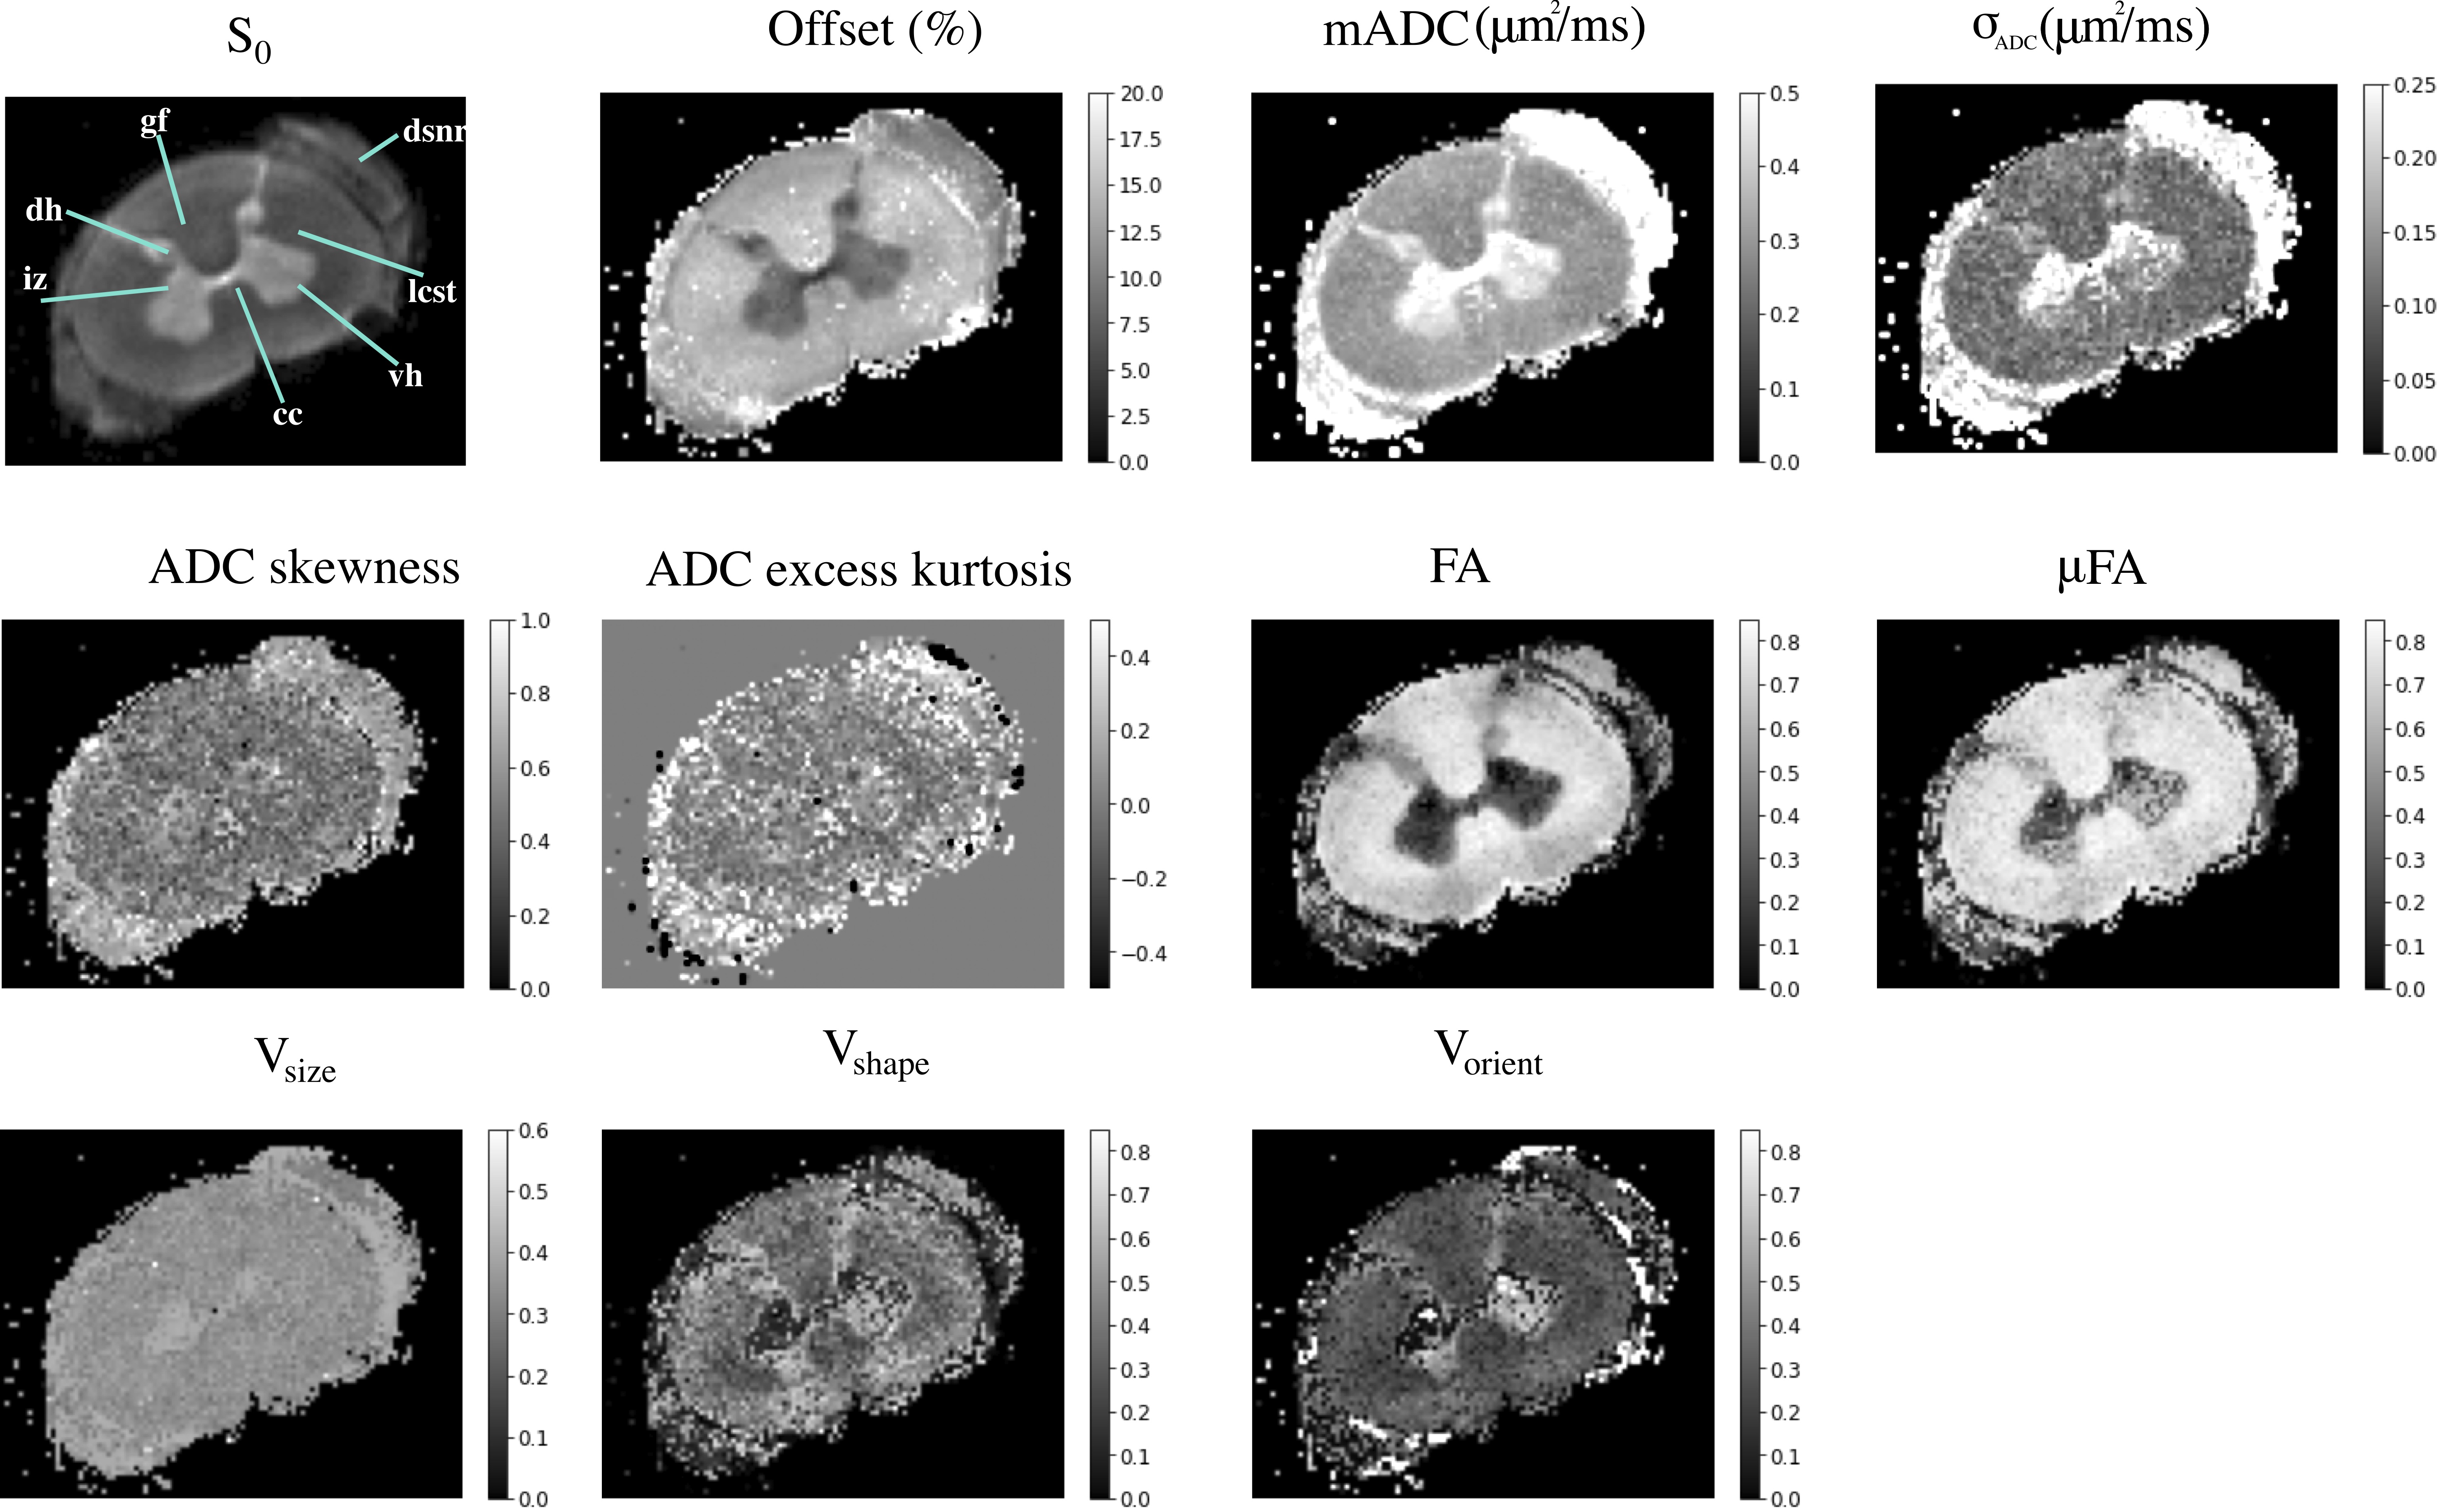
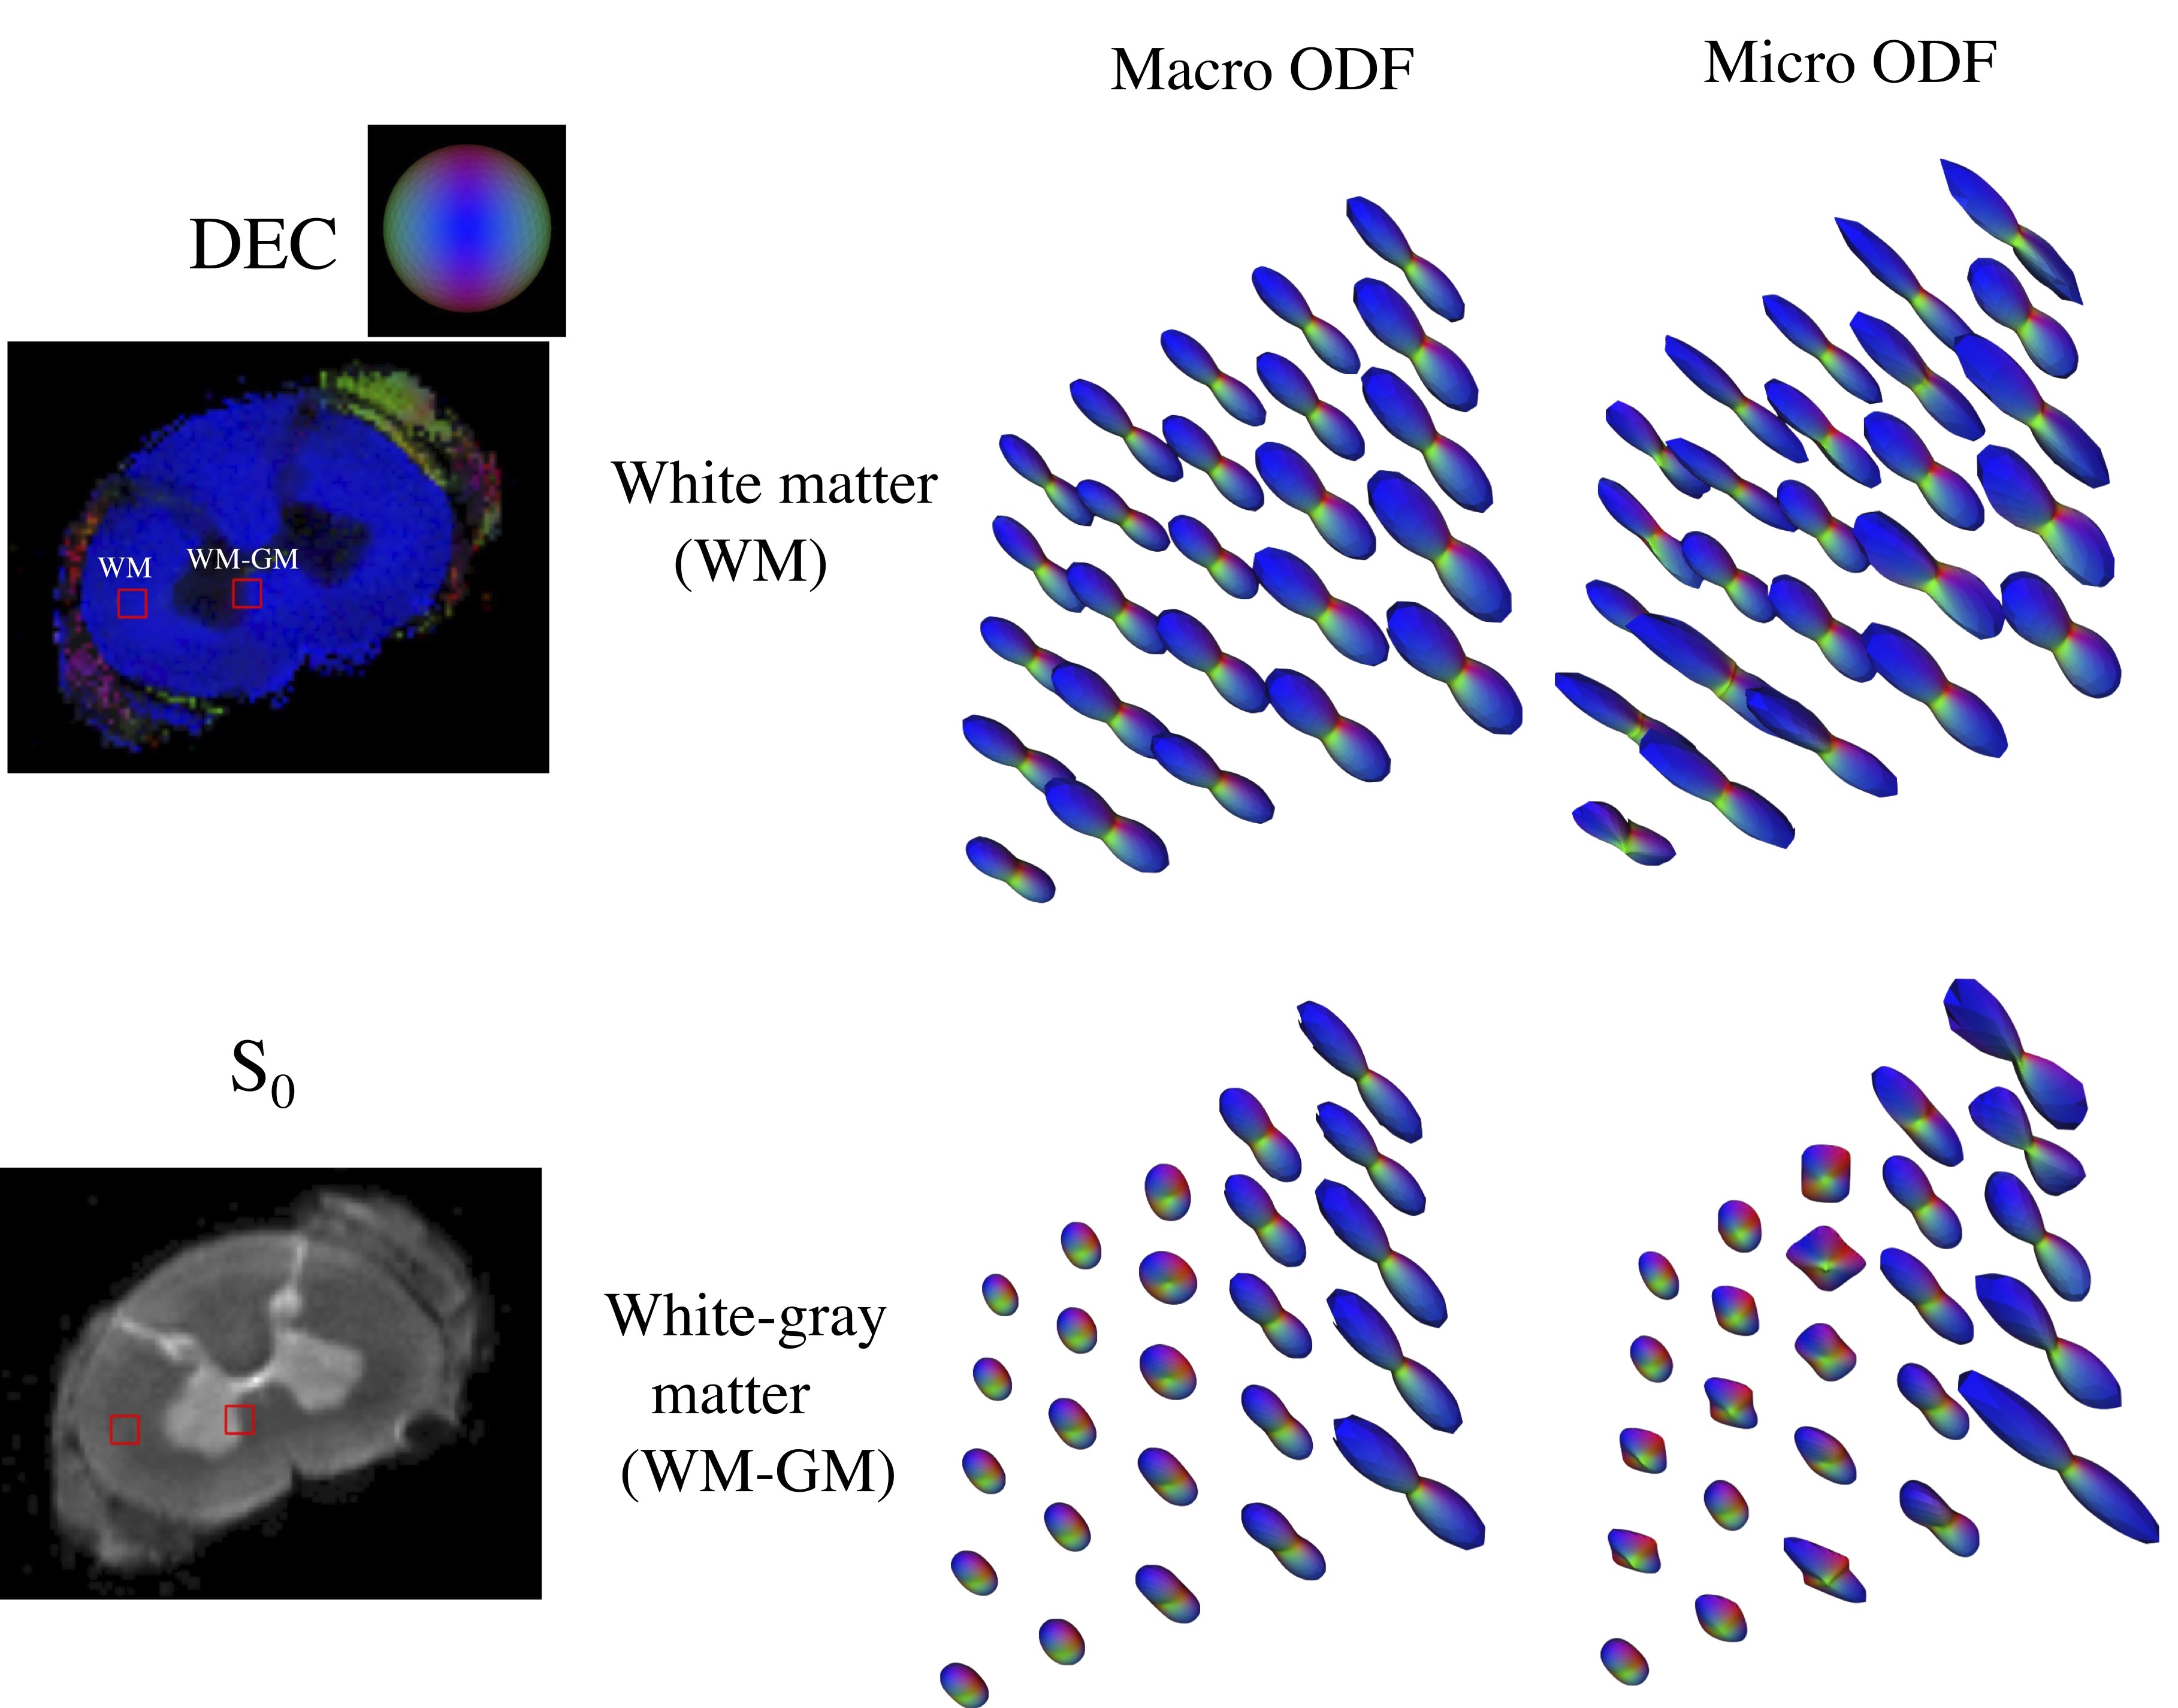
DTD derived stains obtained from a section of the visual cortex along with its overall location in the macaque brain is shown in Figure 1. The white matter tract adjacent to the cortex, on either side of the inferior occipital sulcus (ios), despite having similar FA values were distinguished in the ADC skewness map. Microscopic anisotropy was detected in the cortex shown by elevated μFA (~ 0.6) which may be due to high shape and orientation heterogeneity resulting from heterogeneously shaped neuronal soma and penetrating white matter tracts. The μODF shown in Figure 2 provides evidence of crossing and splaying of white matter fibers as they penetrate the cortex.DTD derived stains obtained in cervical spinal cord are shown in Figure 3. In the gray matter, the intermediate zone (iz) exhibited high size heterogeneity while shape and orientation heterogeneity were zero thus indicating a spherical emulsion type DTD in this region. Microscopic anisotropy was detected in gray and peripheral white matter as shown by elevated μFA in this region with concomitant increase in shape and orientation heterogeneity. The μODFs shown in Figure 4 show the fibers start splaying as they penetrate the gray matter with increased presence of orthogonal lateral fibers.
Conclusion
In this study, we present DTD measured in neural tissue demonstrating that our experimental design and signal inversion framework in capturing the heterogeneity. New heterogeneity stains may one day be useful in assessing disease, normal and abnormal developmental processes, degeneration and trauma in the brain and other soft tissues.Acknowledgements
This work was funded by the Intramural Research Program of the Eunice Kennedy Shriver National Institute of Child Health and Human Development, and with some support from the NIH BRAIN Initiative: “Connectome 2.0: Developing the next generation human MRI scanner for bridging studies of the micro-, meso- and macro-connectome”, U01EB026996. The opinions expressed herein are those of the authors and are not necessarily representative of those of the Uniformed Services University of the Health Sciences (USUHS), the Department of Defense (DOD), the NIH or any other US government agency, or the Henry M. Jackson Foundation for the Advancement of Military Medicine, Inc.References
1. Jian, B., Vemuri, B. C., Ozarslan, E., Carney, P. R. & Mareci, T. H. A novel tensor distribution model for the diffusion-weighted MR signal. Neuroimage 37, 164–76 (2007).
2. Bretthorst, G. L. Characterizing Water Diffusion In Fixed Baboon Brain. in AIP Conference Proceedings vol. 735 3–15 (AIP, 2004).
3. Magdoom, K. N., Pajevic, S., Dario, G. & Basser, P. J. A new framework for MR diffusion tensor distribution. Sci. Rep. 11, 2766 (2021).
4. Veraart, J. et al. Denoising of diffusion MRI using random matrix theory. Neuroimage 142, 394–406 (2016).
5. Jenkinson, M., Beckmann, C. F., Behrens, T. E. J., Woolrich, M. W. & Smith, S. M. FSL. Neuroimage 62, 782–790 (2012).
6. Saleem, K. S. & Logothetis, N. K. A combined MRI and histology atlas of the rhesus monkey brain in stereotaxic coordinates. (Elsevier/Academic Press, 2012).
Figures