0975
Effects of exchange on spherical vs. linear diffusion tensor encodings: A simulation study1Department of Radiology, Johns Hopkins University School of Medicine, Baltimore, MD, United States
Synopsis
To investigate the influence of exchange on microscopic anisotropy estimates derived from kurtosis differences between linear-tensor-encoding (LTE) and spherical-tensor-encoding (STE) diffusion weighting waveforms, random walk simulations were performed in a substrate of packed spheres of varying permeability. A pronounced μFA bias was observed with spectrally detuned LTE due to restricted diffusion and kurtosis time dependence, decreasing with rate of exchange, but also with tuned LTE due to inherent differences in exchange sensitivity, increasing with exchange. Our results suggest a need for caution in interpreting MDE-derived microscopic anisotropy estimates in the presence of exchange.
Introduction
Multi-dimensional diffusion encoding (MDE) sensitizes the diffusion MRI (dMRI) signal to different components of the microscopic diffusion tensor distribution within tissue.1,2 In particular, acquiring simultaneous linear-tensor-encoding (LTE) and spherical-tensor-encoding (STE) measurements allows for estimation of the microscopic fractional anisotropy (μFA), using the difference in LTE and STE kurtoses.1-3 Such an interpretation of the kurtosis difference relies on the absence of competing contributions, effectively the assumption of Gaussian diffusion within non-exchanging compartments. However, the effects of exchange in conjunction with non-Gaussian time-dependent diffusion may be important, for example in gray matter at short time/length scales.4 While this may be partially alleviated by tuning the waveform trace spectra between LTE and STE, which has been shown to account for differences in apparent diffusion coefficients (D)5, spectral tuning may be insufficient to account for differences in exchange sensitivity.6 To investigate the associated bias, we performed simulations of the dMRI signal in a substrate with negligible expected microscopic anisotropy, thus demonstrating the confounding influence of exchange on MDE-based microscopic anisotropy estimates.Methods
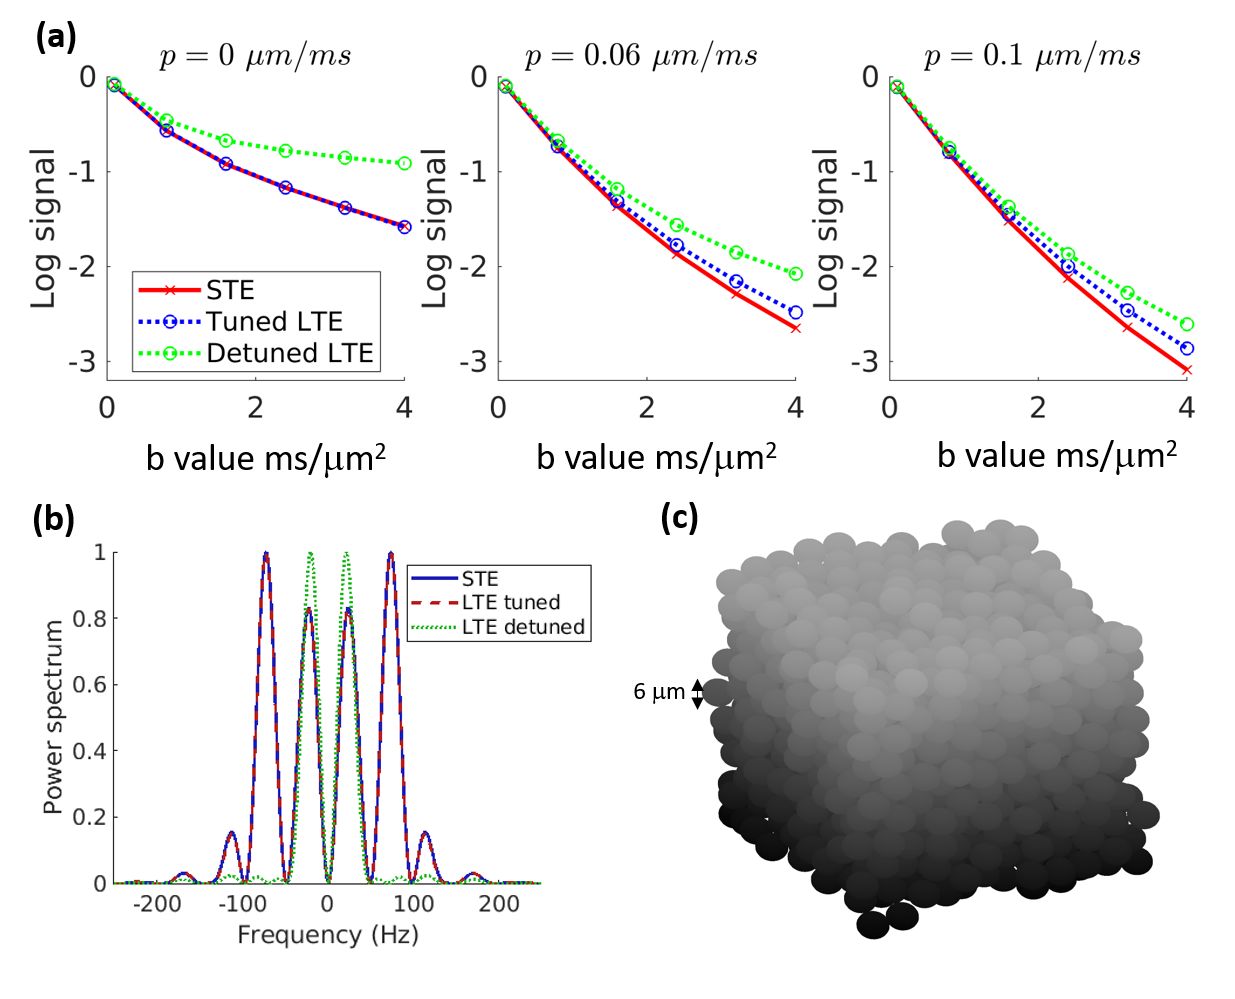
We focused on the (reversed-polarity) q-vector magic angle spinning (qMAS) STE waveform along with LTE waveforms tuned and detuned with respect to its trace spectrum, as proposed by Lundell et al.5 dMRI signals were simulated using Monte Carlo (MC) random walk simulations (diffusivity D0 = 2 μm2 / ms) in a digital substrate of randomly packed spheres of 3 μm radius embedded in a free external compartment (external compartment volume fraction ECF = 0.5). The signals were simulated for and (powder-)averaged over 10 orientations generated by electrostatic repulsion, achieved for the STE waveforms by rotating the x-axis to the orientations. The sphere surface permeability and diffusion waveform encoding duration were varied at 6 b-values, and the apparent diffusivity (D) and kurtosis (K) estimated by fitting the log signal (log(S)) curves to log(S)=-D b+(K D2/6)b2.6Results
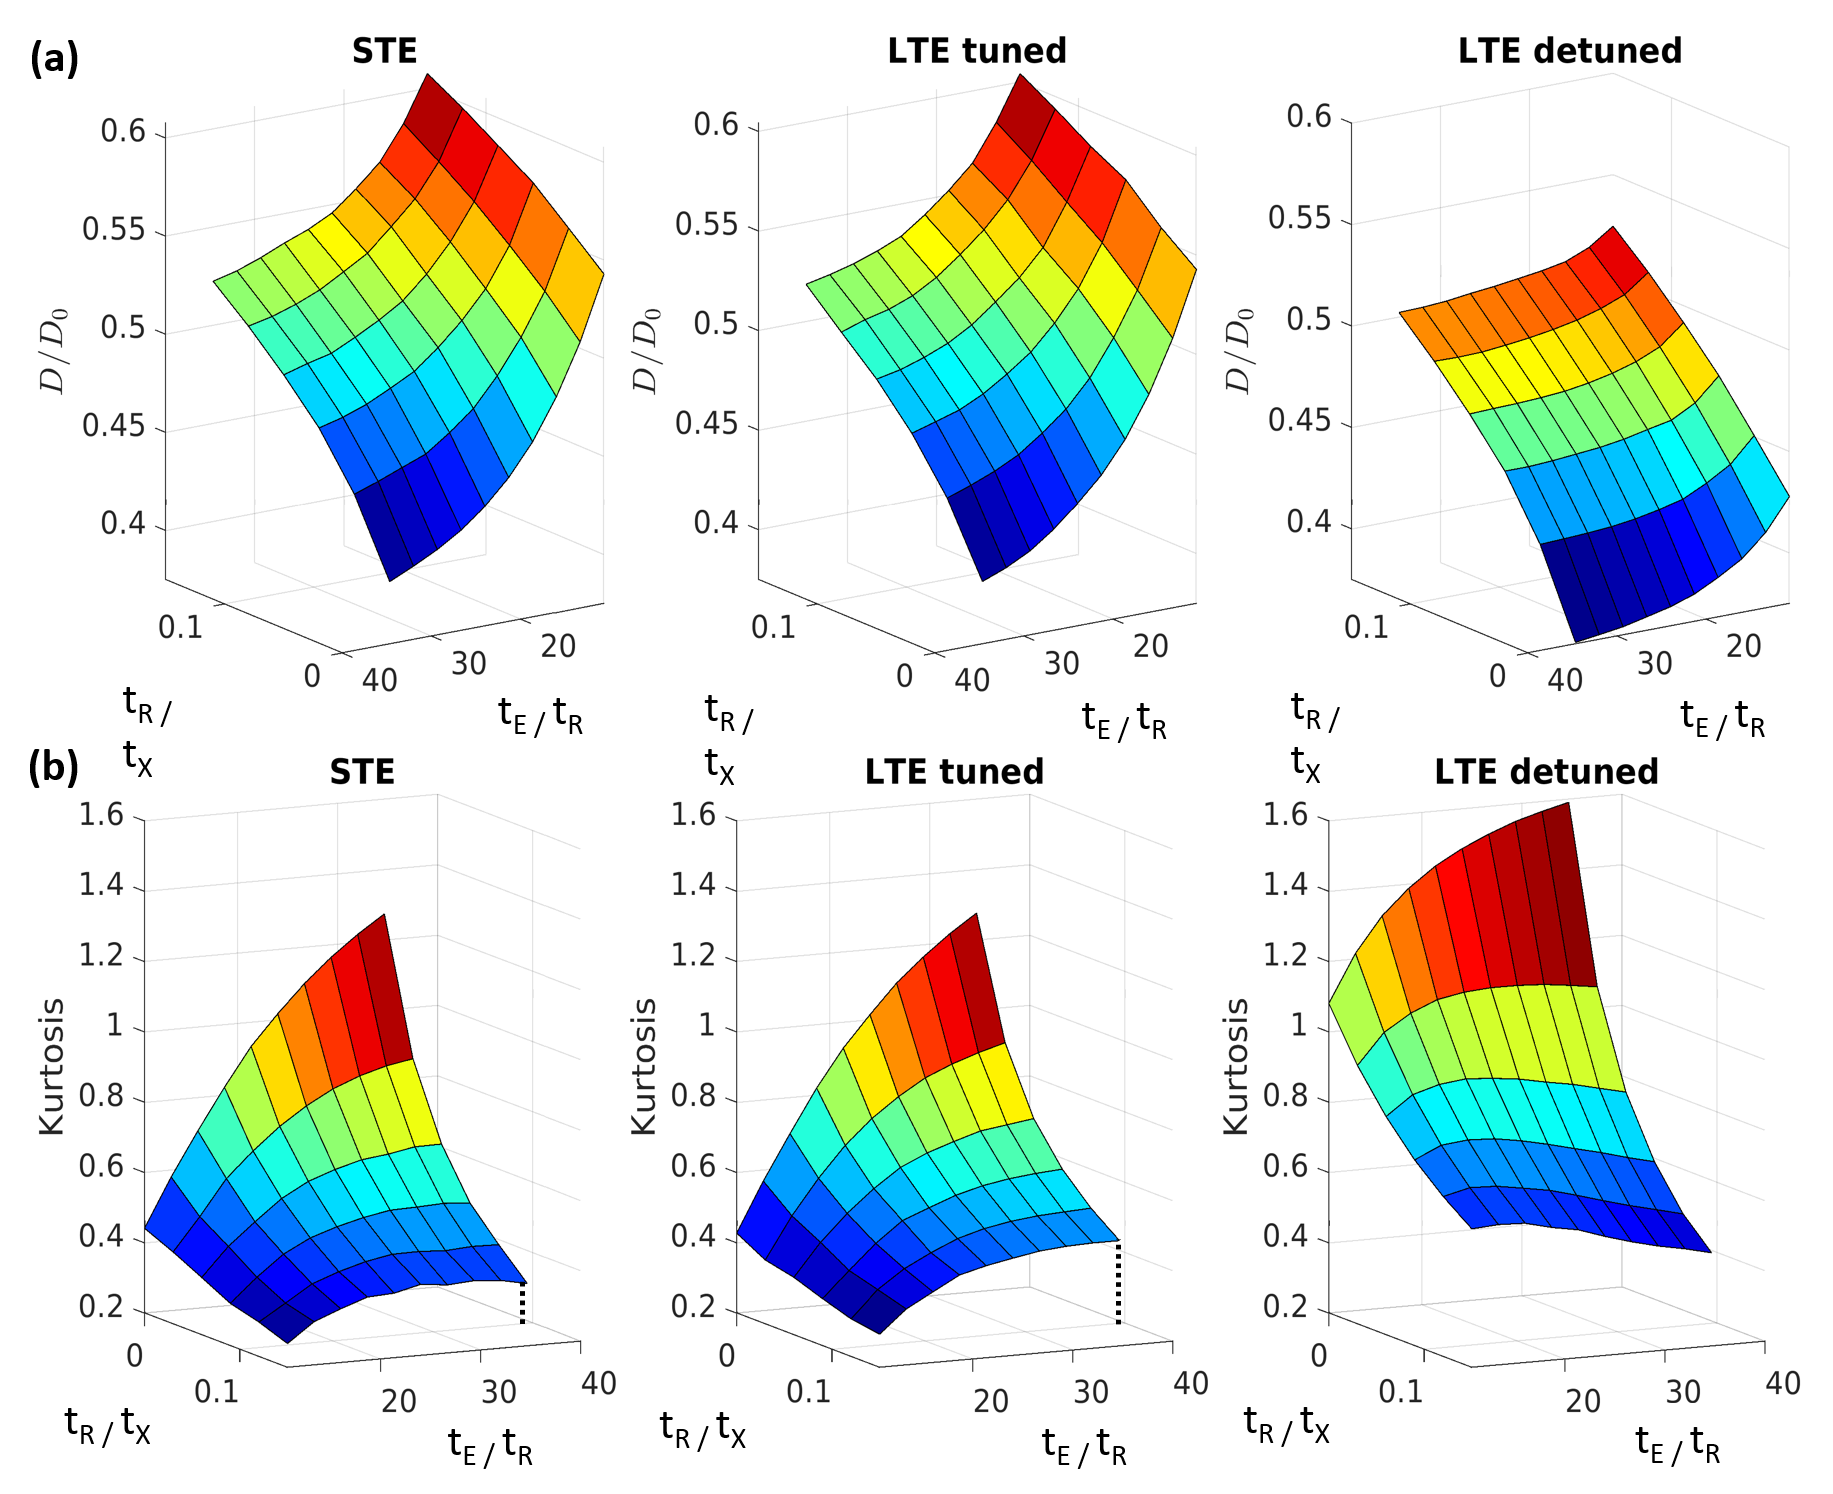
Fig. 1a shows simulated log signal curves for increasing permeability p at a single encoding time, along with the trace spectra (Fig. 1b) and an illustration of the substrate (Fig. 1c). At p=0, spectral tuning perfectly matched the signals between LTE and STE. However, at increasing permeabilities, the non-linearity (kurtosis) changed such that LTE diverged from STE despite the tuning.The diffusivity surfaces in Fig. 2a show a pronounced dependence on both effective exchange time tX and encoding duration tE (both shown relative to the inter-barrier diffusion time tR). Within the considered range of tE, the tuned LTE and STE kurtoses shown in Fig. 2b both displayed universal increases with tE, which differed in shape and magnitude only for non-zero tR/tx (with exchange). The trend of tE dependence varied for the detuned LTE kurtosis with tR/tx, increasing only for low values (slow exchange), and monotonically decreasing for high values (fast exchange).
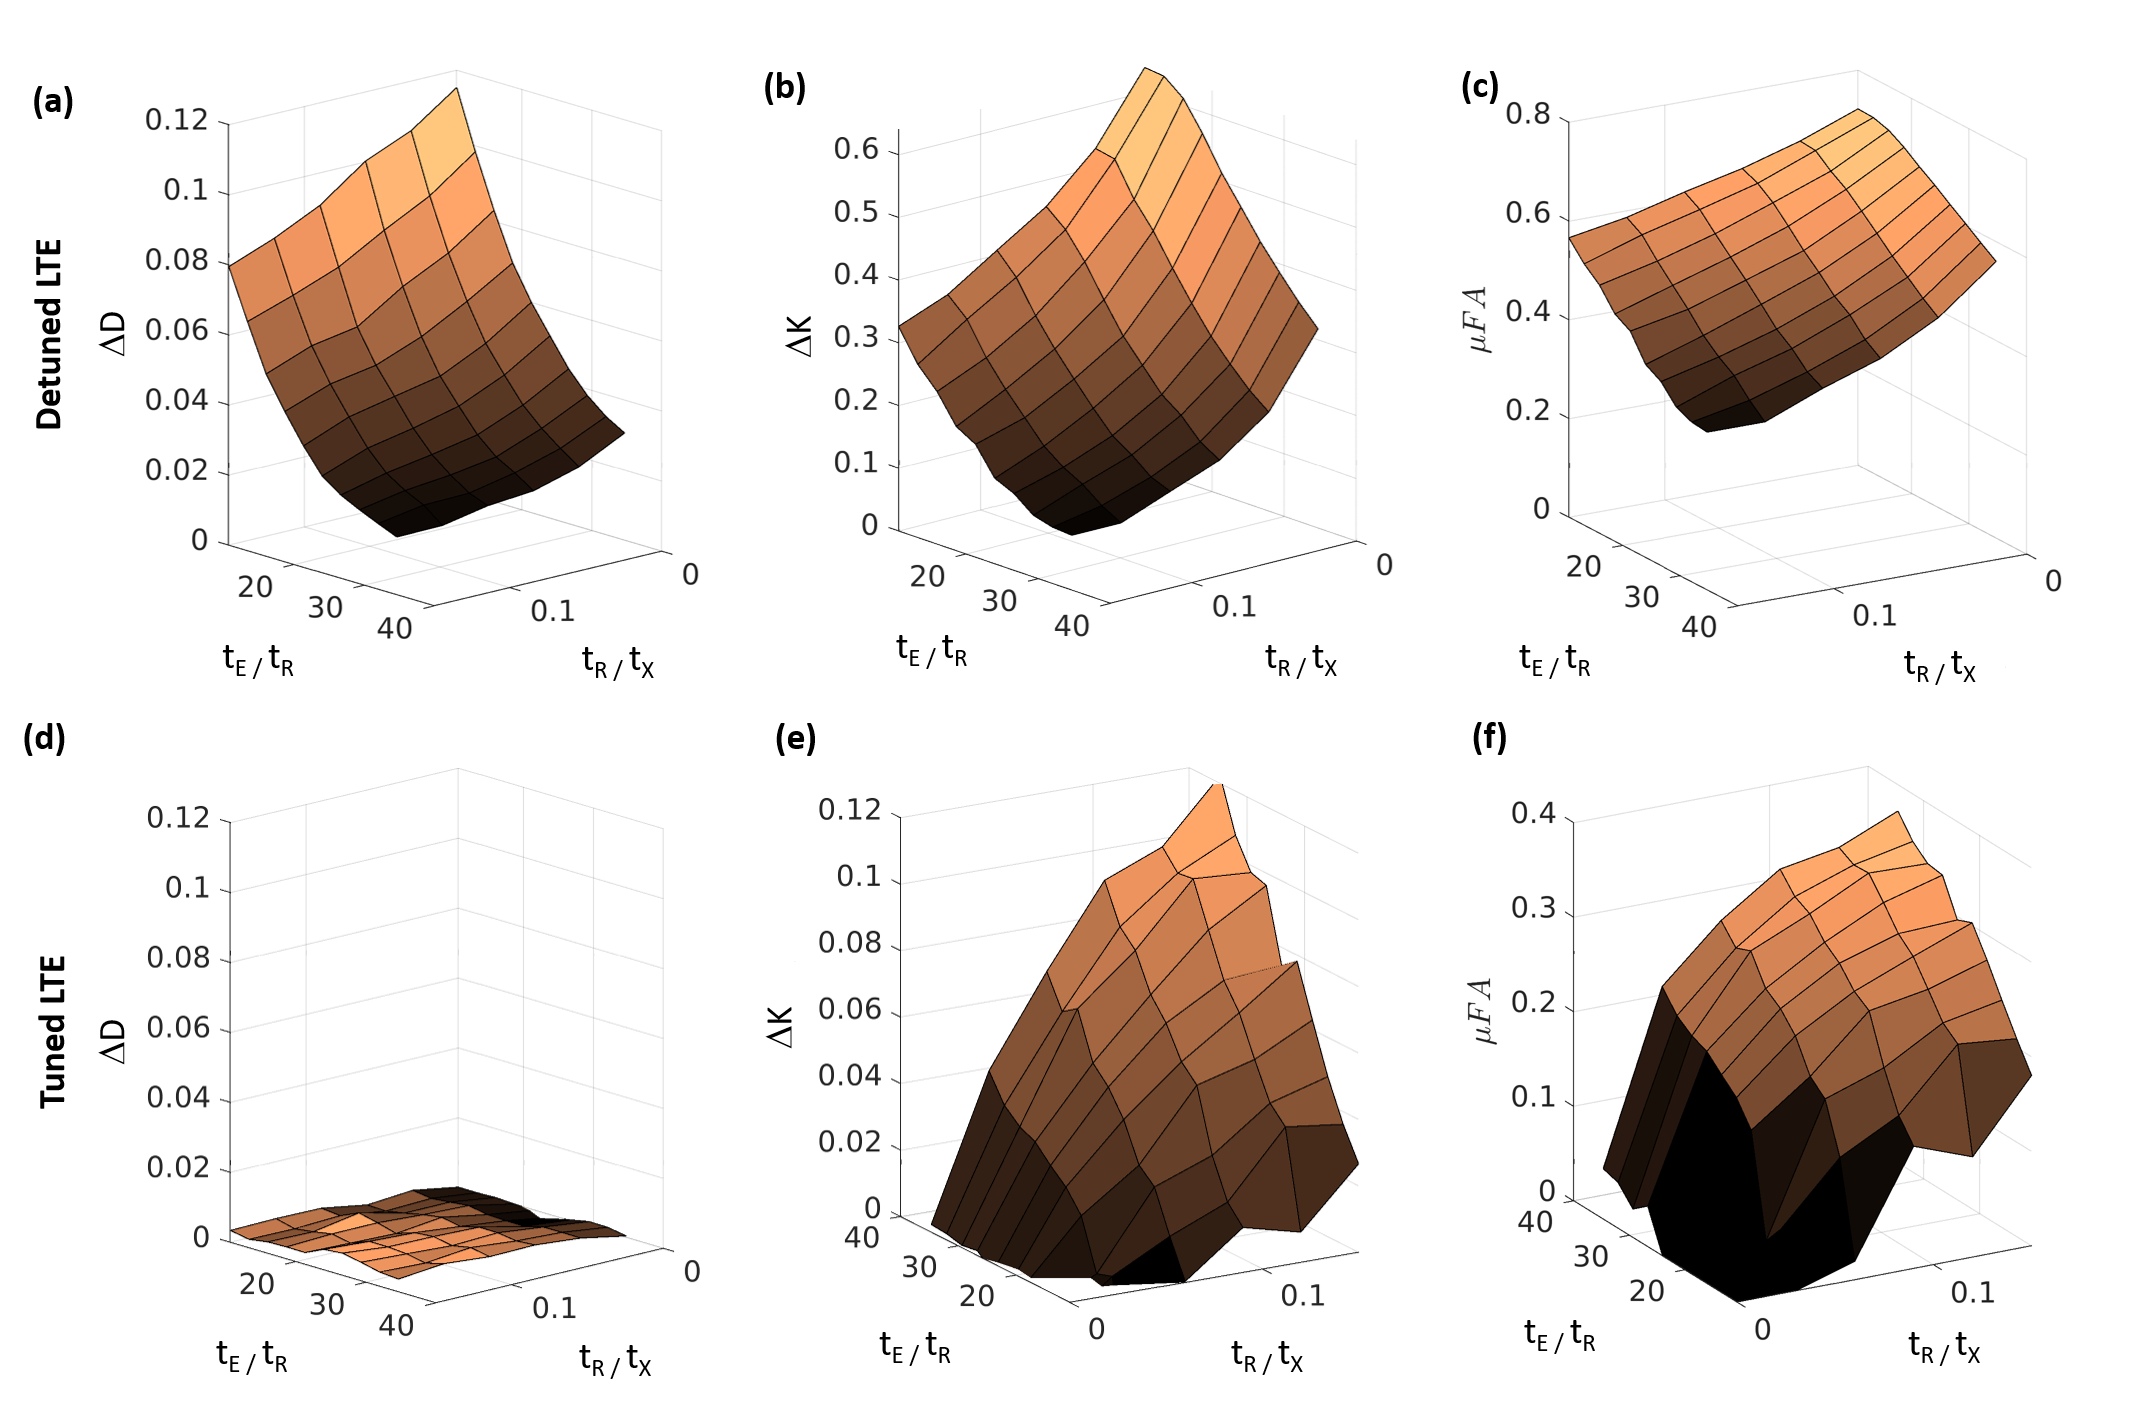
Fig. 3 shows the differences between STE and LTE diffusivities (ΔD) and kurtosis (ΔK) for both tuned and detuned LTE. ΔD decreased with both tE/tR and tR/tx for detuned LTE (fig. 3a), but was 0 for tuned LTE (Fig. 3d). ΔK decreased from ~0.6 to ~0.1 for detuned LTE (fig. 3b) with both parameters, but increased from zero for tuned LTE (fig. 3e). Calculating μFA from the ΔK values led to decreases from ~0.7 to ~0.35 for detuned LTE (fig. 3c), but increases from ~0 to ~0.4 for tuned LTE (fig. 3f).
Discussion and Conclusions
The simulations showed varying tE dependencies of the kurtosis for the different waveforms, demonstrating variations in exchange sensitivity due to differences inherent to the waveform shapes. The detuned and tuned waveforms displayed qualitatively distinct behaviors: A decreasing kurtosis with the detuned waveform for faster exchange (larger tR/tX), and universal increases for the tuned LTE and STE. The differences for the detuned waveform are consistent with the trace spectra in fig. 1b, as a kurtosis decrease is expected for longer diffusion times (lower frequencies) and kurtosis increases for shorter times.6 The ΔK in this case were a consequence of the spectral mismatch and time dependence of kurtosis; in our simulations, this effect led to a maximal μFA ~ 0.7 at tR/tx=0, i.e., without exchange, which is high compared to the value of ~0 expected for a substrate of packed spheres.5Even with spectral tuning, the simulations showed kurtosis differences between LTE and STE and associated μFA misestimates that, counterintuitively, increased with exchange up to a value of ~0.4. This demonstrates the insufficiency of the trace spectrum to account for waveform exchange sensitivity. While the exchange sensitivity of general waveforms has been analyzed in the long-time, slow-exchange regime covered by the Karger model7, it may not be possible in general to simultaneously tune the trace spectra and exchange sensitivities. Therefore, in situations with both time-dependent diffusion and non-negligible exchange at the probed time scales, our results suggest a need for caution in interpreting MDE-derived parameters such as microscopic anisotropies.
Acknowledgements
This work was supported by the National Institutes of Health (NIH) grants R21NS096249 and R01AG057991.References
1. Westin C-F, Knutsson H, Pasternak O, et al. Q-space trajectory imaging for multidimensional diffusion MRI of the human brain. NeuroImage. 2016;135:345-362. doi:10.1016/j.neuroimage.2016.02.0392.
2. Topgaard D. Diffusion tensor distribution imaging. NMR Biomed. May 2019;32(5):e4066. doi:10.1002/nbm.40663.
3. Lasič S, Szczepankiewicz F, Eriksson S, Nilsson M, Topgaard D. Microanisotropy imaging: quantification of microscopic diffusion anisotropy and orientational order parameter by diffusion MRI with magic-angle spinning of the q-vector. Frontiers in Physics. 2014;2:1-14. doi:10.3389/fphy.2014.000114.
4. Jespersen SN, Olesen JL, Ianus A, Shemesh N. Effects of nongaussian diffusion on "isotropic diffusion" measurements: An ex-vivo microimaging and simulation study. J Magn Reson. Mar 2019;300:84-94. doi:10.1016/j.jmr.2019.01.0075.
5. Lundell H, Nilsson M, Dyrby TB, et al. Multidimensional diffusion MRI with spectrally modulated gradients reveals unprecedented microstructural detail. Sci Rep. Jun 21 2019;9(1):9026. doi:10.1038/s41598-019-45235-76.
6. Aggarwal M, Smith MD, Calabresi PA. Diffusion-time dependence of diffusional kurtosis in the mouse brain. Magn Reson Med. Sep 2020;84(3):1564-1578. doi:10.1002/mrm.281897
7. Ning L, Nilsson M, Lasič S, Westin C-F, Rathi Y. Cumulant expansions for measuring water exchange using diffusion MRI. The Journal of Chemical Physics. 2018/02/21 2018;148(7):074109. doi:10.1063/1.5014044
Figures