0973
NOE imaging in tumors using asymmetric analysis of 2pi-CEST signals1Vanderbilt University Institute of Imaging Science, Nashville, TN, United States, 2Department of Radiology and Radiological Sciences, Vanderbilt University Medical Center, Nashville, TN, United States
Synopsis
Nuclear overhauser enhancement (NOE) mediated chemical exchange saturation transfer (CEST) effect at -3.5 ppm has shown clinical interests in diagnosing tumors. Asymmetric analysis is a fast and simple method to measure and quantify the NOE effect, but has contamination from the downfield amide proton transfer (APT) effect at 3.5 ppm. In this abstract, we provide a new NOE quantification method using asymmetric analysis of CEST signals acquired with 2pi saturation pulses (2pi-CEST) which is also fast but has reduced contamination from the APT effect.
METHODS: The 2pi-CEST saturation block contains a series of Gaussian RF saturation pulses with pulse duration of 13ms and pulse repetition time (PTR) of 72.2ms (corresponding to average saturation power of 1µT) and with total saturation time of 5s (corresponding to 69 PTR). The conventional continuous-wave (CW)-CEST was also studied to compare with the asymmetric analysis of 2pi-CEST. The saturation block of the CW-CEST contains a 5s rectangular RF pulse with saturation power of 1µT. Both the 2pi- and CW-CEST saturation blocks are followed by single-shot spin-echo echo planar imaging (SE-EPI) readout and a recovery time of 2s. Previously, an inverse subtraction analysis with correction of apparent water longitudinal relaxation rate (R1obs), termed apparent exchange-dependent relaxation (AREX), has been used to improve the specificity in quantifying CEST effect 10. Here, we combine the AREX with asymmetric analysis of CEST signals, termed AREXasym, to quantify the NOE effect,
$$ AREX_{asym}(Δω)=(S_0/S_+(Δω) - S_0/S\_(Δω))R_{1obs} (1+f_m) $$ (1)
where (+) represents the offset of the upfield NOE component and (-) is the offset on the symmetrically opposite side of the water peak. S0 is the control signal acquired without RF saturation; Δω is the RF saturation pulse frequency offset from water; fm is macromolecular pool size ratio.
A two-pool (solute and water) model simulations of coupled Bloch equations were performed to evaluate the dependence of the asymmetric analysis of CW-CEST signals (AREXasym_cw) and the asymmetric analysis of 2pi-CEST signals (AREXasym_2pi) on the exchange/coupling rate (ksw) and the solute T2 (T2s). Experiments were performed on three rat brains bearing 9L tumors to evaluate the ability of the asymmetric analysis of 2pi-CEST to remove the contamination from APT. All measurements were performed on a Varian 9.4 T magnet with a 38-mm Litz RF coil. Z-spectra were acquired with RF offsets from -2000 to 2000 Hz with a step of 50 Hz (-5 to 5ppm on 9.4 T). Control signal was obtained by setting the RF offset to 100000 Hz (250ppm on 9.4T). R1obs and fm were obtained using a selective inversion recovery (SIR) quantitative MT method11. All images were acquired with matrix size 64 ´ 64, field of view 30 mm ´ 30 mm, and one average. All animal procedures were approved by the local Animal Care and Usage Committee.
RESULTS:
Fig. 1 shows the simulated AREXasym_CW, AREXasym_2pi, and AREXasym_2pi/AREXasym_CW as a function of ksw and T2s, respectively. Compared with the AREXasym_CW, AREXasym_2pi is less sensitive to slow-intermediate exchanging pools with relatively long T2s (e.g., amide at 3.5ppm, guanidino amine at 2ppm), but is sensitive to short T2s components with slow exchange/coupling rate (e.g. the NOE at 3.5ppm) and fast exchanging pools with relatively long T2s (e.g. lysine amine at 3ppm). This simulation suggests that the AREXasym_2pi can be applied to reduce the contamination from the APT effect in quantifying the NOE effect. Fig. 2 shows the averaged CW-, 2pi-CEST Z-spectrum as well as AREXasym_CW and AREXasym_2pi spectra from the tumor and the contralateral normal tissue. Note that although the APT at 3.5ppm and amine at 2ppm are apparent in the CW-CEST spectra, they become weak in the 2pi-CEST spectra; Also note that a dip at -3.5ppm is overlaid on a broad NOE peak on the AREXasym_CW spectra which is due to the contamination from the APT effect, but not on the AREXasym_2pi spectra. Fig. 3 shows the statistical differences of AREXasym_CW(-3.5ppm) and AREXasym_2pi(-3.5ppm) between tumor and the contralateral normal tissue. Fig. 4 shows the maps of the AREXasym_CW(-3.5ppm) and AREXasym_2pi(-3.5ppm) from a representative rat brain.
DISCUSSION AND CONCLUSION:
The asymmetric analysis of 2pi-CEST signals only needs the acquisition of the label, reference, and control signals which is fast and easy to be performed. By reducing the APT effect, it is more accuracy than the conventional asymmetric analysis of CEST signals in quantifying the NOE effect. Asymmetric MT effect12 and the CEST effect from fast exchanging pools are other contamination factors. But they should be relatively small compared with the NOE effect acquired with low saturation powers.
Acknowledgements
The authors acknowledge grant support from NIH (R21 AR074261, R03 EB029078, and R01 EB029443).References
1. van Zijl PCM, Zhou J, Mori N, et al. Mechanism of magnetization transfer during on-resonance water saturation. A new approach to detect mobile proteins, peptides, and lipids. Magn Reson Med. 2003;49:440-449
2.Mori S, Eleff SM, Pilatus U, et al. Proton nmr spectroscopy of solvent-saturable resonances: A new approach to study ph effects in situ. Magn Reson Med. 1998;40:36-42
3. Jones CK, Huang A, Xu JD, et al. Nuclear overhauser enhancement (noe) imaging in the human brain at 7 t. Neuroimage. 2013;77:114-124
4. Zaiss M, Kunz P, Goerke S, et al. Mr imaging of protein folding in vitro employing nuclear-overhauser-mediated saturation transfer. Nmr Biomed. 2013;26:1815-1822
5. Paech D, Zaiss M, Meissner JE, et al. Nuclear overhauser enhancement mediated chemical exchange saturation transfer imaging at 7 tesla in glioblastoma patients. Plos One. 2014;9
6. Mehrabian H, Desmond KL, Soliman H, et al. Differentiation between radiation necrosis and tumor progression using chemical exchange saturation transfer. Clin Cancer Res. 2017;23:3667-3675
7. Zhang XY, Wang F, Jin T, et al. Mr imaging of a novel noe-mediated magnetization transfer with water in rat brain at 9.4t. Magn Reson Med. 2017;78:588-597
8. Xu JZ, Zaiss M, Zu ZL, et al. On the origins of chemical exchange saturation transfer ( cest) contrast in tumors at 9.4 t. Nmr Biomed. 2014;27:406-416
9. Zhang XY, Wang F, Li H, et al. Accuracy in the quantification of chemical exchange saturation transfer (cest) and relayed nuclear overhauser enhancement (rnoe) saturation transfer effects. Nmr Biomed. 2017;30
10. Zaiss M, Zu ZL, Xu JZ, et al. A combined analytical solution for chemical exchange saturation transfer and semi-solid magnetization transfer. Nmr Biomed. 2015;28:217-230
11. Gochberg DF, Gore JC. Quantitative magnetization transfer imaging via selective inversion recovery with short repetition times. Magn Reson Med. 2007;57:437-441
12. Hua J, Jones CK, Blakeley J, et al. Quantitative description of the asymmetry in magnetization transfer effects around the water resonance in the human brain. Magn Reson Med. 2007;58:786-793
Figures
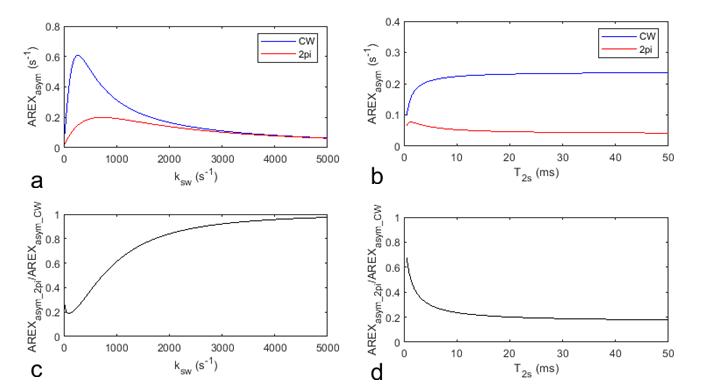
Fig. 1 Two-pool model simulated AREXasym_CW (blue line) and AREXasym _2pi (red line) as a function of ksw (a) and T2s (b) respectively. Two-pool model simulated AREXasym_CW/AREXasym_2pi as a function of ksw (c) and T2s (d) respectively. Δω = -3.5ppm; Solute concentration is 0.005; T2s in (a, c) is 20ms; ksw in (b, d) is 50s-1.
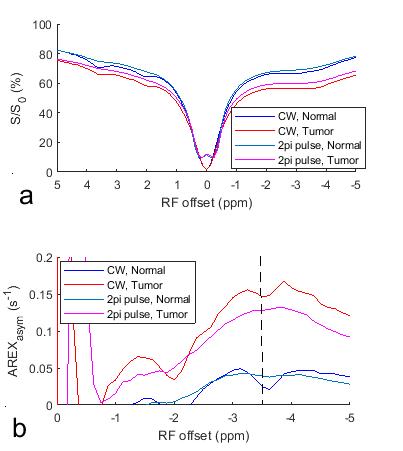
Fig. 2 Averaged CW- and 2pi-CEST Z-spectra (a) and AREXasym_CW and AREXasym_2pi spectra (b) from the tumor and the contralateral normal tissue of three rat brains. The dashed line in (b) indicates the Δω of -3.5ppm.
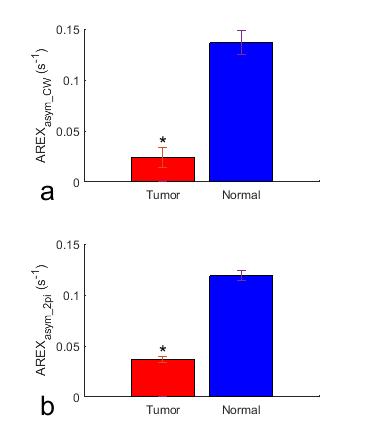
Fig. 3 Statistical differences of AREXasym_CW(-3.5ppm) (a) and AREXasym_2pi(-3.5ppm) (b) between tumor and the contralateral normal tissue in rat brain. (N=3, *P<0.05)
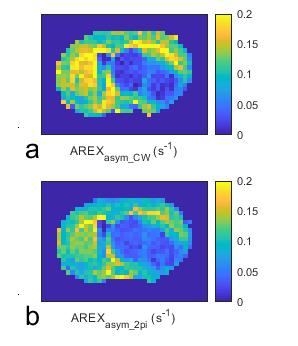
Fig. 4 Maps of the AREXasym_CW(-3.5ppm) (a) and AREXasym_2pi(-3.5ppm) (b) from a representative rat brain.