0971
The relationship between structural asymmetry and shear stiffness asymmetry in the human brain1University of Edinburgh, Edinburgh, United Kingdom, 2University of Bath, Bath, United Kingdom, 3University of Delaware, Newark, DE, United States
Synopsis
On average the human brain has a global structural asymmetry comprising a counter-clockwise twist in the transverse plane and which is referred to as the cerebral torque. We have investigated whether there is a relationship between the magnitude of the torque and measures of brain shear stiffness obtained using Magnetic Resonance Elastography (MRE) in a group of Older Adults (AD) and a group of patients with Alzheimers DIsease (AD).
2. Method
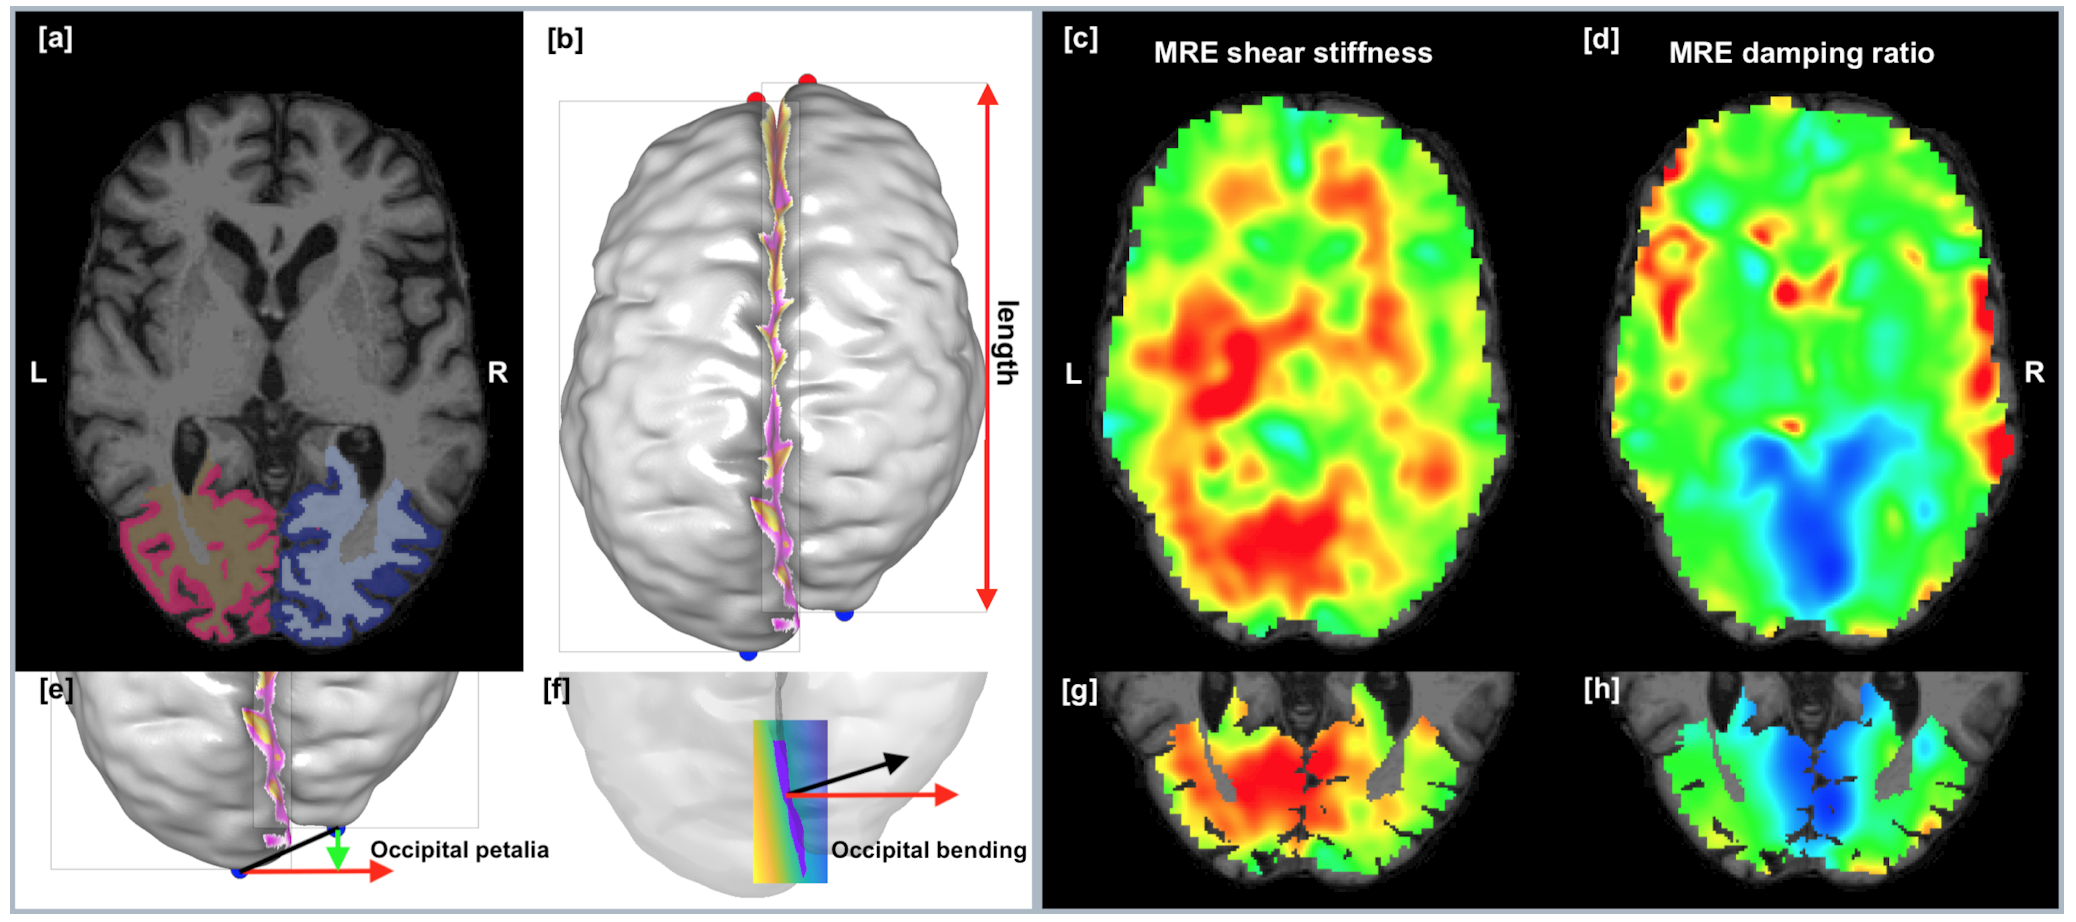
Shear stiffness values were computed for the occipital lobe and related to indices of the cerebral torque. First, we examined brain structural asymmetry based on structural MRI data, namely occipital petalia, occipital bending and inter-hemispheric brain length asymmetry of individual diagnostic groups using the protocol proposed in (Xiang et al. 2019) (see Figure 1). Secondly, we computed average values of MRE measures, namely shear stiffness and damping ratio of the occipital lobe and examined the inter-hemispheric asymmetry, in the form of an asymmetry index (AI) defined as the normalized difference between the left and right cerebral hemispheres. As FreeSurfer allows the classification of brain voxel into gray matter, white matter, major subcortical regions and also specific neuroanatomical regions based on the atlas-based labelling function, the occipital lobe was extracted automatically, and the statistics of MRI and MRE measures can be computed for the relevant regions (Figure 1). Lastly, we investigated the correlation between the indices of cerebral torque and MRE asymmetries of the occipital lobe.
3. Results
3.1. MRI Asymmetries (12 OA and 12 AD subjects)
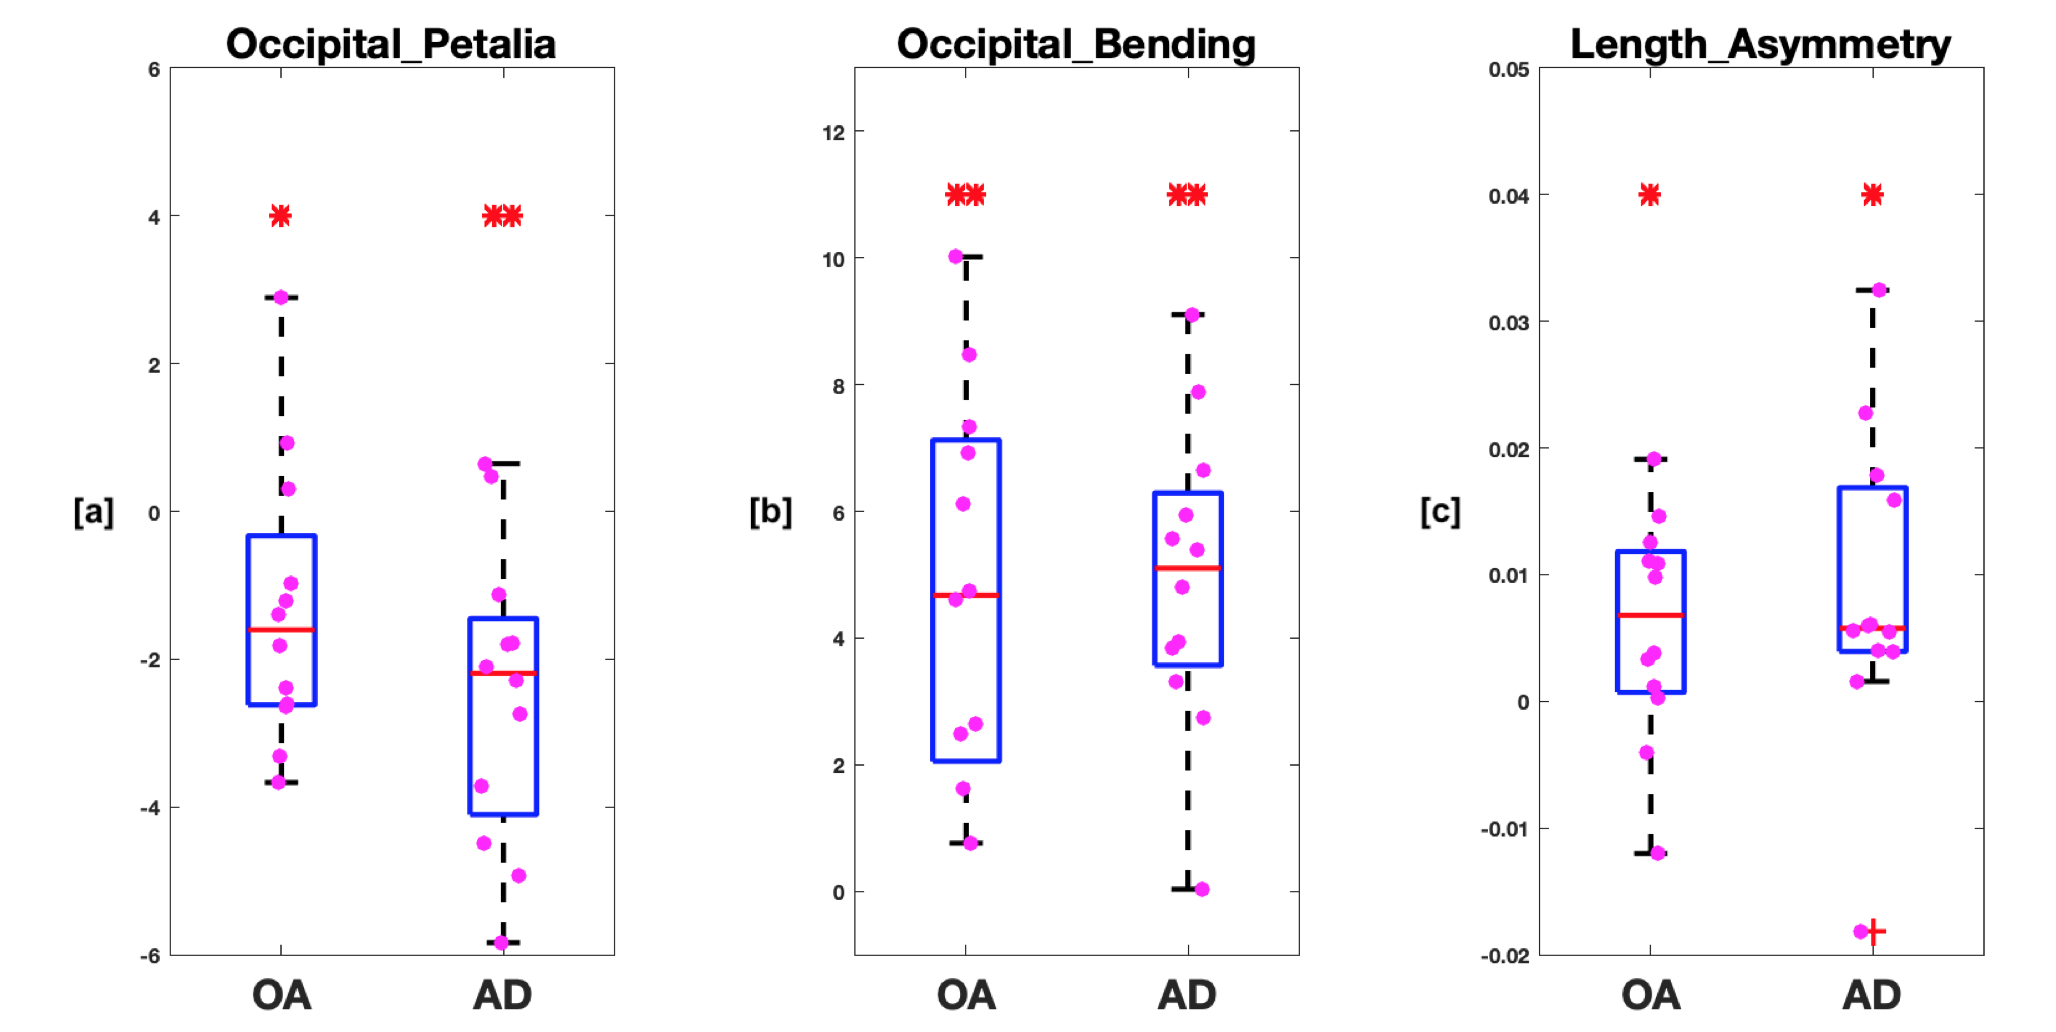
Two-sample t-tests revealed no significant difference in structural asymmetries between OA and AD groups (occipital petalia: [t(22)=1.44, p=0.16]; occipital bending: [t(22)=-0.59, p=0.56]; length asymmetry: [t(22)=-0.61, p=0.55]) (see Figure 2). Although one-sample t-tests revealed that both groups have significant (i) leftward occipital petalia (OA: [t(11)=-2.41, p=0.03]; AD: [t(11)=-4.27, p<0.005]) and (ii) rightward occipital bending (OA: [t(11)=3.14, p=0.01]; AD: [t(11)=7.06, p<0.005]), as well as (iii) leftward length asymmetry (OA: [t(11)=2.32, p=0.04]; AD: [t(11)=2.36, p=0.04]).
3.2. MRE asymmetries (12 OA and 11 AD subjects)
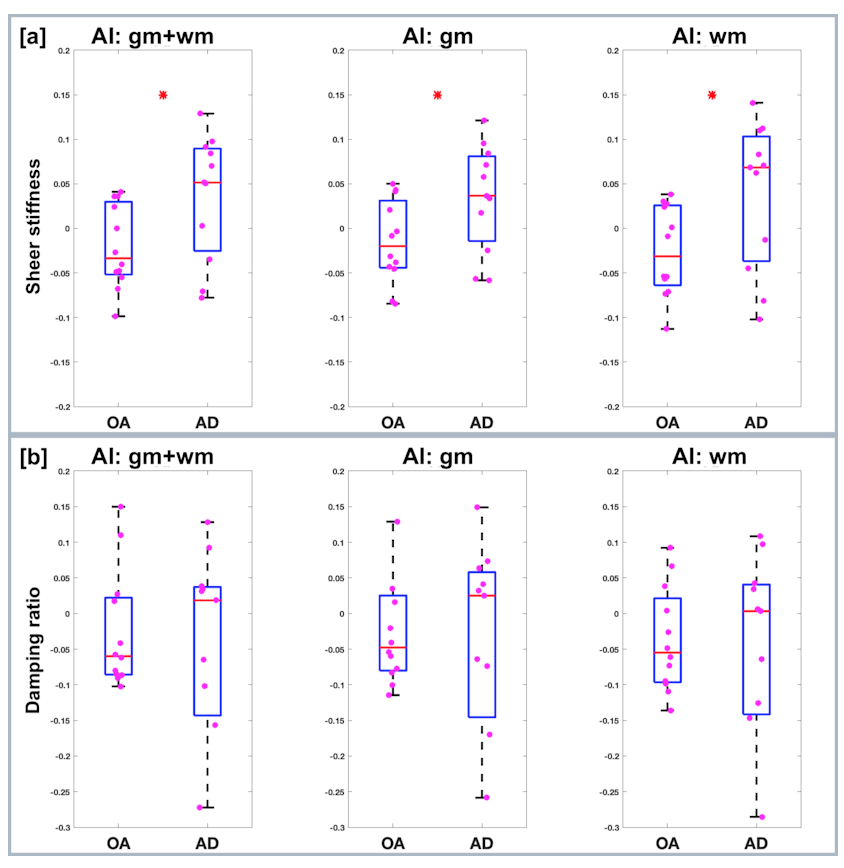
For the MRE shear stiffness measure, there is a significant reduction in the occipital lobe in AD compared to OA for gray+white matter volume by 7.40% and 12.86%, respectively, for the left cerebral hemisphere [t(21)=2.76, p=0.01] and right cerebral hemisphere [t(21)=4.00, p<0.005], on gray matter volume by 7.17% 11.96%, respectively, for the left cerebral hemisphere [t(21)=2.51, p=0.02] and right cerebral hemisphere [t(21)=3.75, p<0.005] and for white matter volume by 7.69% and 13.73%, respectively, for the left [t(21)=2.92, p=0.01] and right cerebral hemisphere [t(21)=4.07, p<0.005] (see Figure 3). Two-sample t-tests of the AI values revealed significantly increased shear stiffness asymmetry of the occipital lobe in AD compared to OA, respectively in gray+white matter volume [t(21)=-2.28, p=0.03], gray matter volume [t(21)=-2.21, p=0.04] and white matter volume [t(21)=-2.21, p=0.04]. The correlation analysis showed that the increasing of asymmetry in AD is significantly related to the reduction of shear stiffness in the right cerebral hemisphere [gm+wm: r=-0.67, p<0.005; gm: r=-0.61, p<0.005; wm: r=-0.72, p<0.005], but not the left cerebral hemisphere. For the MRE damping ratio measure, there was no significant difference between AD and OA in either absolute values of individual cerebral hemispheres or the inter-hemispheric asymmetry.
3.3. Relationship between MRI and MRE asymmetries (12 OA and 11 AD subjects)
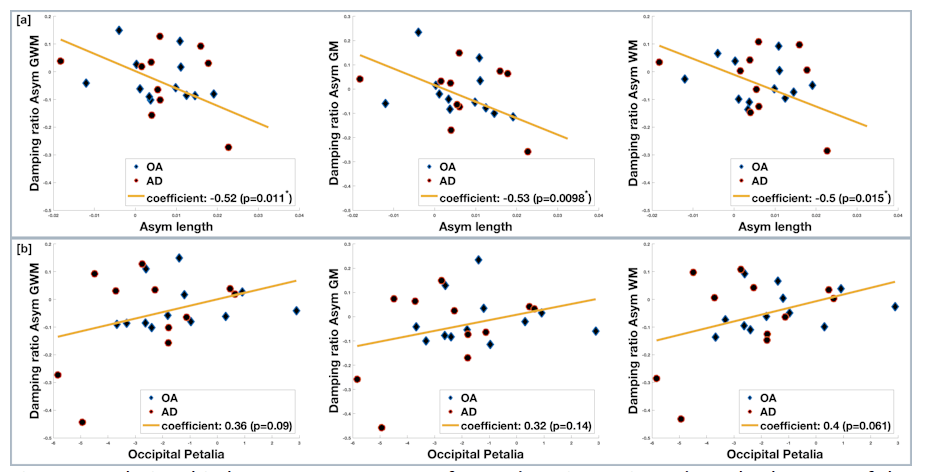
For the damping ratio measure, the correlation analysis revealed (i) significant association between the inter-hemispheric asymmetry of the occipital lobe and brain length asymmetry [gm+wm: r=-0.52, p=0.01; gm: r=-0.53, p=0.01; wm: r=-0.50, p=0.02] and (ii) marginal association between inter-hemispheric asymmetry of the occipital lobe and brain occipital petalia [gm+wm: r=0.36, p=0.09; wm: r=0.40, p=0.06], indicating that the smaller the relative damping ratio of the left occipital lobe, the greater the brain length and the posterior protrusion of the left cerebral hemisphere (see Figure 4).
4. Discussion
In this study, we report (i) a significant increase of shear stiffness asymmetry in the occipital lobe in AD compared to OA and reduction of shear stiffness of the occipital lobe in both cerebral hemispheres, more prominent in the right compared to the left, (ii) significant occipital petalia, bending and length asymmetry in both AD and OA groups, with no significant difference between diagnostic groups and (iii) a significant relationship between damping ratio asymmetry of the occipital lobe and brain length asymmetry.
Acknowledgements
No acknowledgement found.References
Barrick TR, Lawes N, Mackay CE, Clark CA. 2007. White matter pathway asymmetry underlies functional lateralization Cerebral Cortex. 17: 591-598.
Fischl B, van der Kouwe A, Destrieux C, Halgren E, Segonne F, Salat DH, Busa E, Seidman LJ, Goldstein J, Kennedy D et al. 2004. Automatically parcellating the human cerebral cortex. Cereb Cortex. 14: 11-22.
Josse G, Kherif G, Flandin G, Seghier ML, Price CJ. 2009. Predicting language lateralization from gray matter J Neurosci. 29: 13516-13523.
Xiang
L, Crow T, Roberts N. 2019. Cerebral torque is human specific and unrelated to
brain size. Brain Struct Funct. 224: 1141-1150.
Figures