0970
The Effect of Label Crossing the Blood-CSF barrier on Partial Volume Correction: source of error or opportunity for quantification?1C.J. Gorter Center for High Field MRI, Department of Radiology, Leiden University Medical Center, Leiden, Netherlands, 2Leiden Institute for Brain and Cognition (LIBC), Leiden, Netherlands, 3Department of Radiology, Leiden University Medical Center, Leiden, Netherlands, 4Clinical Imaging Science Center, University of Sussex, Sussex, United Kingdom, 5Biomedical Engineering, Rochester Institute of Technology, Rochester, NY, United States
Synopsis
Partial volume correction in ASL typically neglects CSF signal, however we have recently shown that some labeled signal crosses the blood-CSF barrier at a measurable level. Here we show the effect of including CSF in PVC, in simulated and in-vivo data. CSF-PVC reduced error on GM perfusion by ~10% in simulated data, with higher error when more CSF is present (including at longer LD and PLD). The difference between CSF-PVC and non-CSF-PVC GM signal in vivo was also ~10%. Comparing PVC signal in CSF to long-TE ASL signal suggests that BCSFB characterization may be possible without the acquisition of ultra-long-TE.
Introduction
Arterial spin labeling (ASL) is a perfusion method using coarse image resolution, consequently suffering from partial volume effects. Partial volume correction (PVC) was introduced to extract pure perfusion parameters for gray matter (GM) and white matter (WM).[1] PVC algorithms commonly neglect signal from other compartments. However, we have recently shown[2] that ASL signal crossing the Blood-CSF barrier (BCSFB) can be observed in both cortical and ventricular CSF with a relative intensity of ≈10% of GM-signal, which could affect PVC. Here we investigate the effect of including CSF in PVC on pure GM signal and CBF measurements, and compare PVC-CSF signal to long-echo ASL used for characterization of BCSFB.Methods
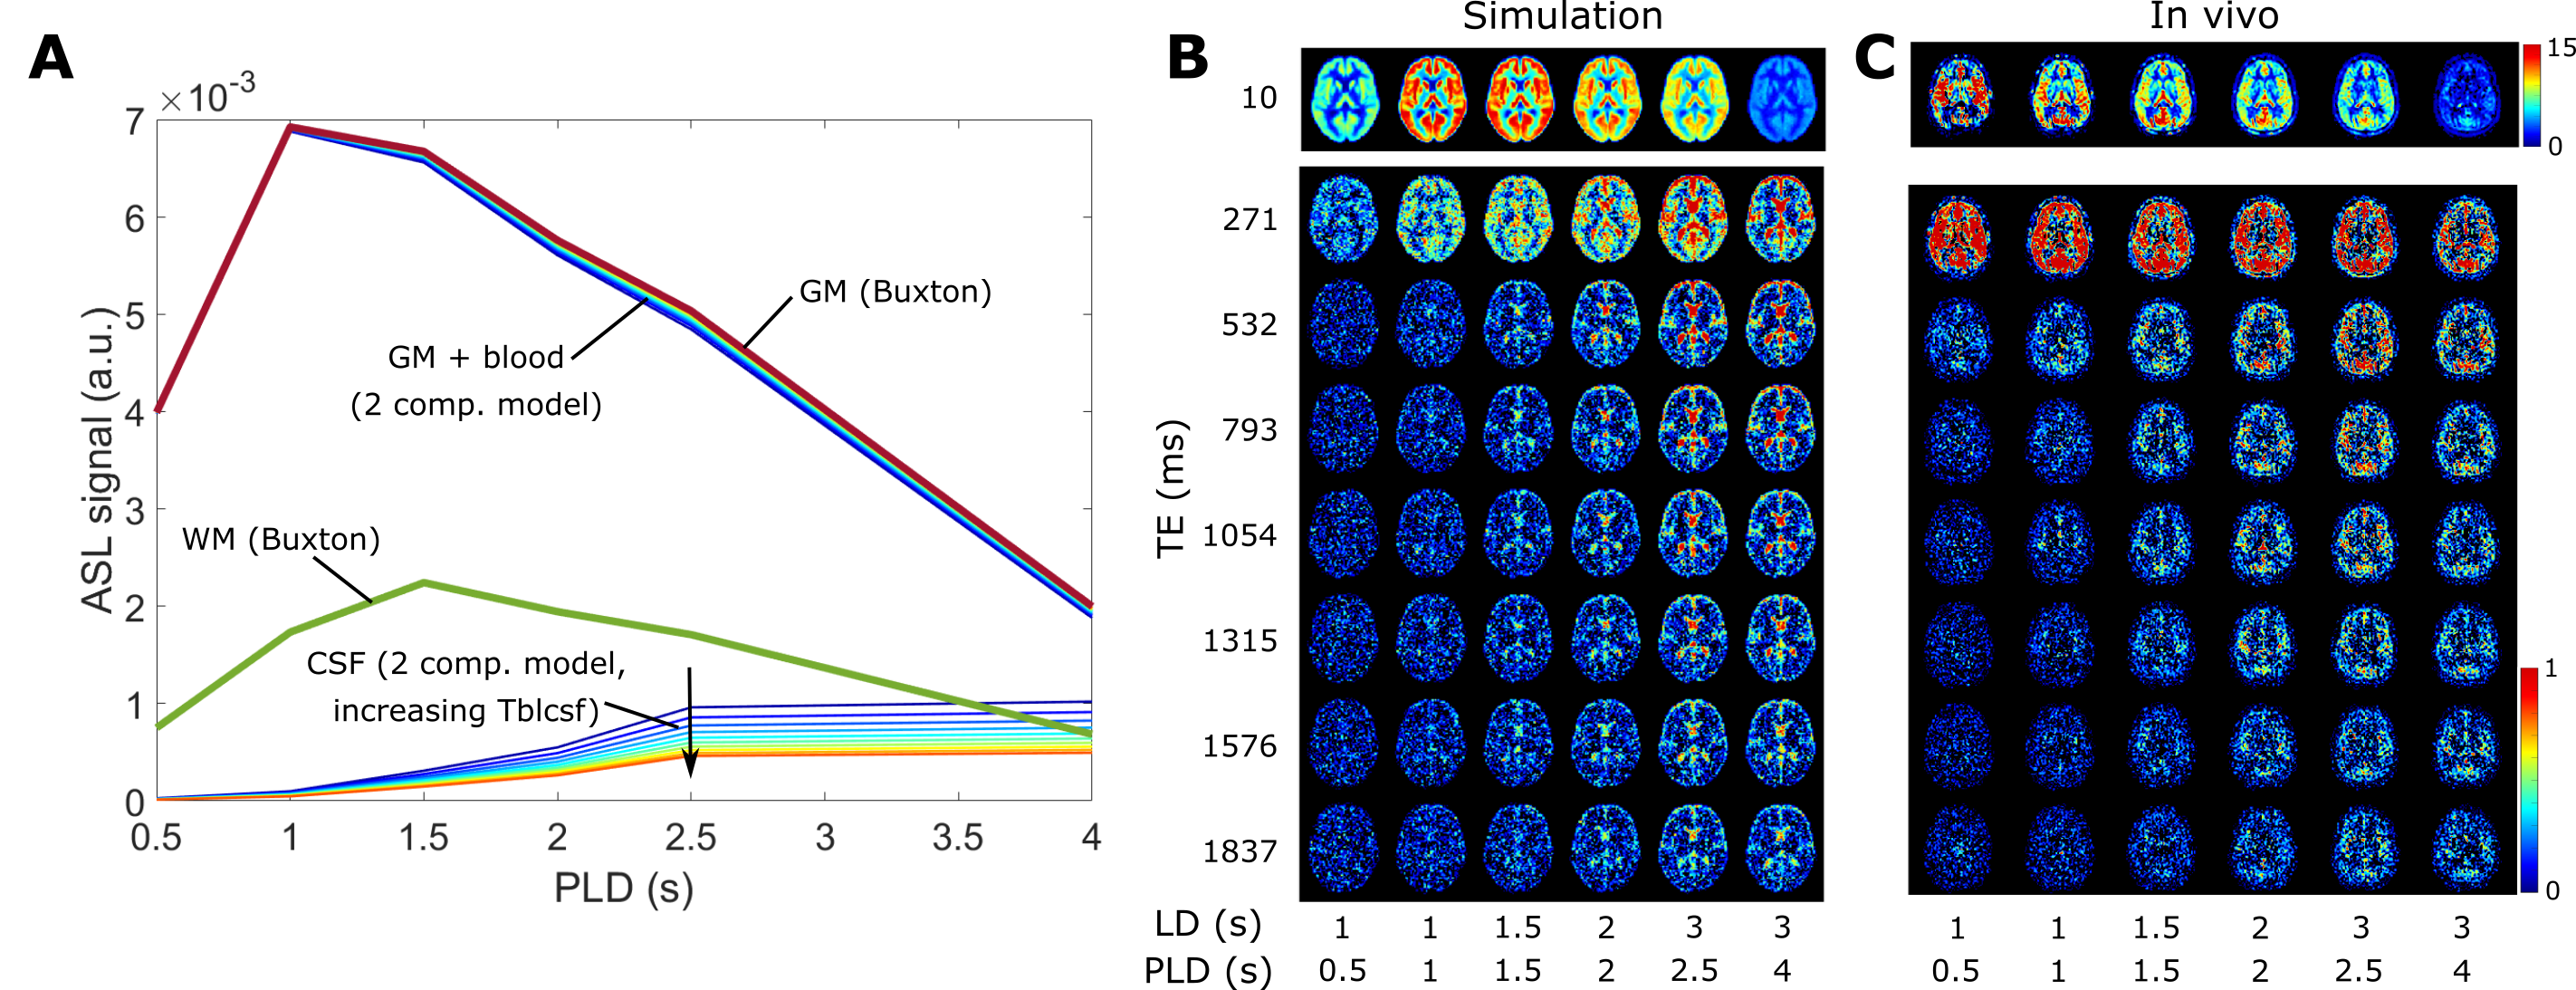
The linear PVC algorithm was extended to three contributions: GM, WM, and CSF and was validated using a simulation dataset replicating the labeling durations (LD), post-labeling delays (PLD) and echo times (TE) of existing in-vivo data (see [2]). All analyses were performed in MATLAB. Pure GM and WM signals were calculated using the Buxton model[3] with a CBF of 60 and 20 ml/100g/min, and ATT of 1 and 1.2s, respectively. CSF signal was simulated using the exchange model in [2], simplified to include only two compartments (blood + gray matter, and CSF), with 10 values for Tbl->CSF (40-85s, see figure 1A). ASL signal maps were created by weighting the pure signals by corresponding tissue probability maps from SPM12 (London, UK) downsampled to ASL resolution (3x3x6 mm3). White gaussian noise (SNR=20) was added. Figure 1B shows the simulated dataset is qualitatively comparable to the in-vivo dataset in 1C. PVC was performed with and without CSF, and error-maps were computed. ROIs were created using 10% bins of GM probability (figure 3C). CBF was calculated after PVC both using the single-PLD method in [4] with LD/PLD = 2/2s, and model-fitting all time points.The same PVC procedures were applied to the in-vivo dataset. Instead of error maps, the relative difference between pure GM signal with and without CSF correction was used. The PVC CSF signal time-course was compared to long-echo ASL signal (averaged over TEs 1315-1837ms which only contains ASL-signal in CSF) as an indication of whether PVC on traditional ASL-data can extract CSF-signal without the use of ultra-long-TE acquisitions.
Results and Discussion
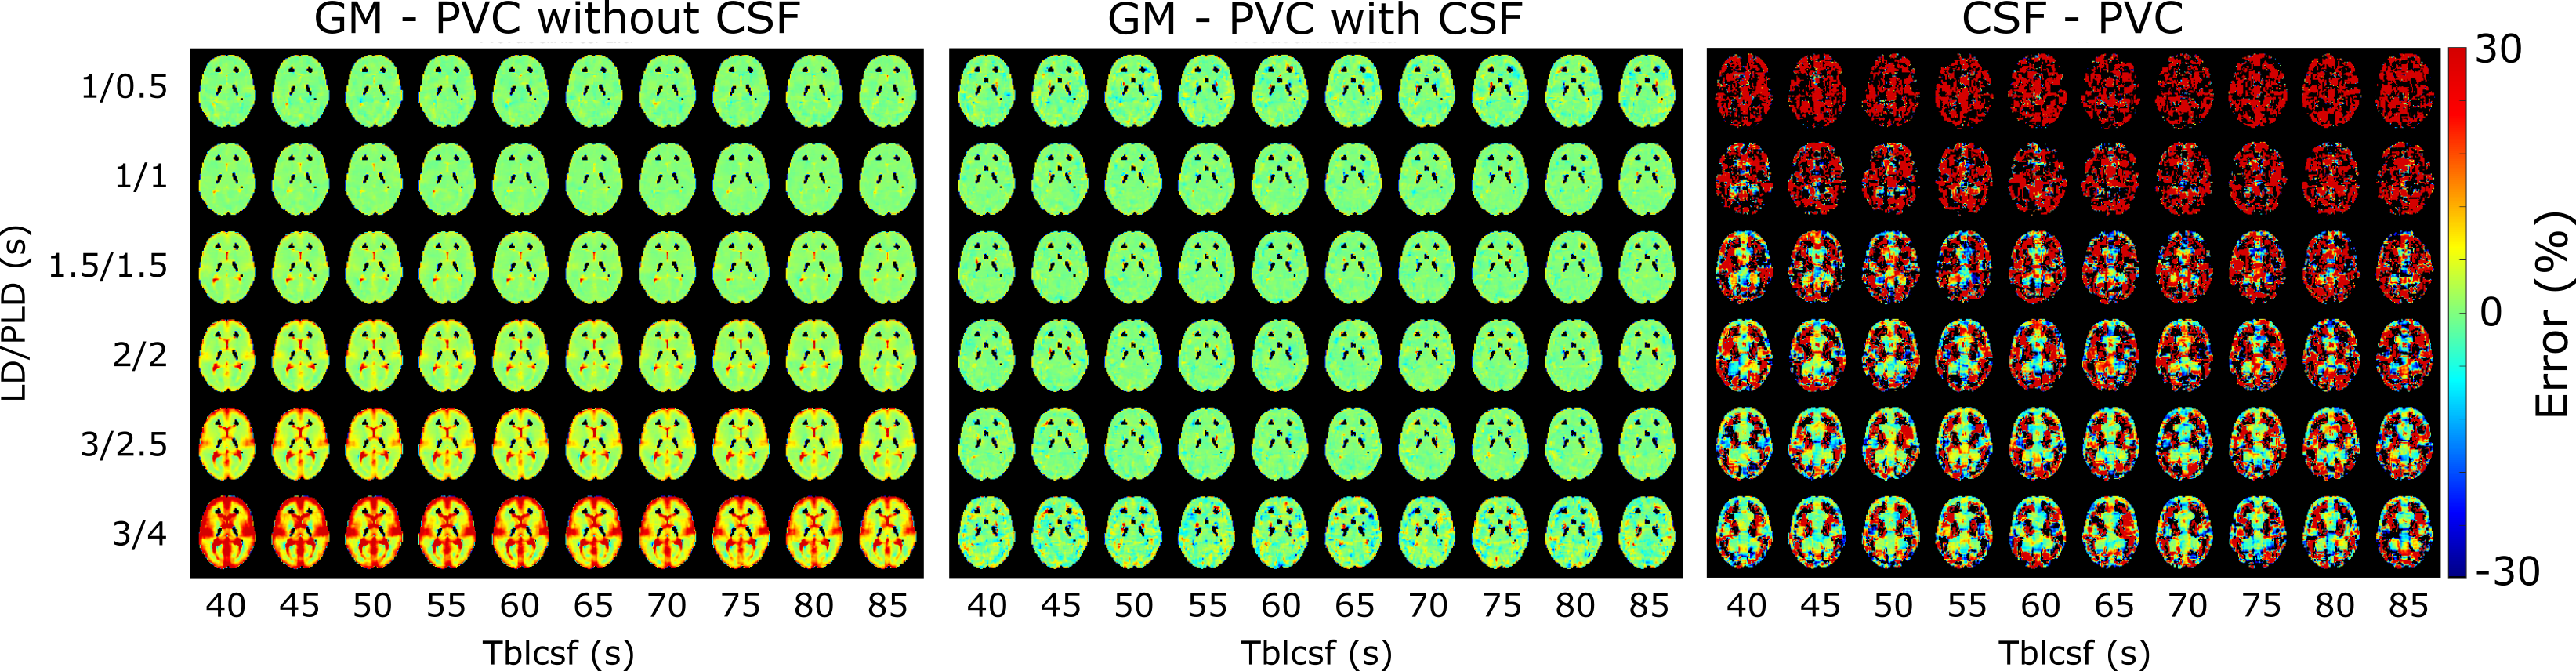
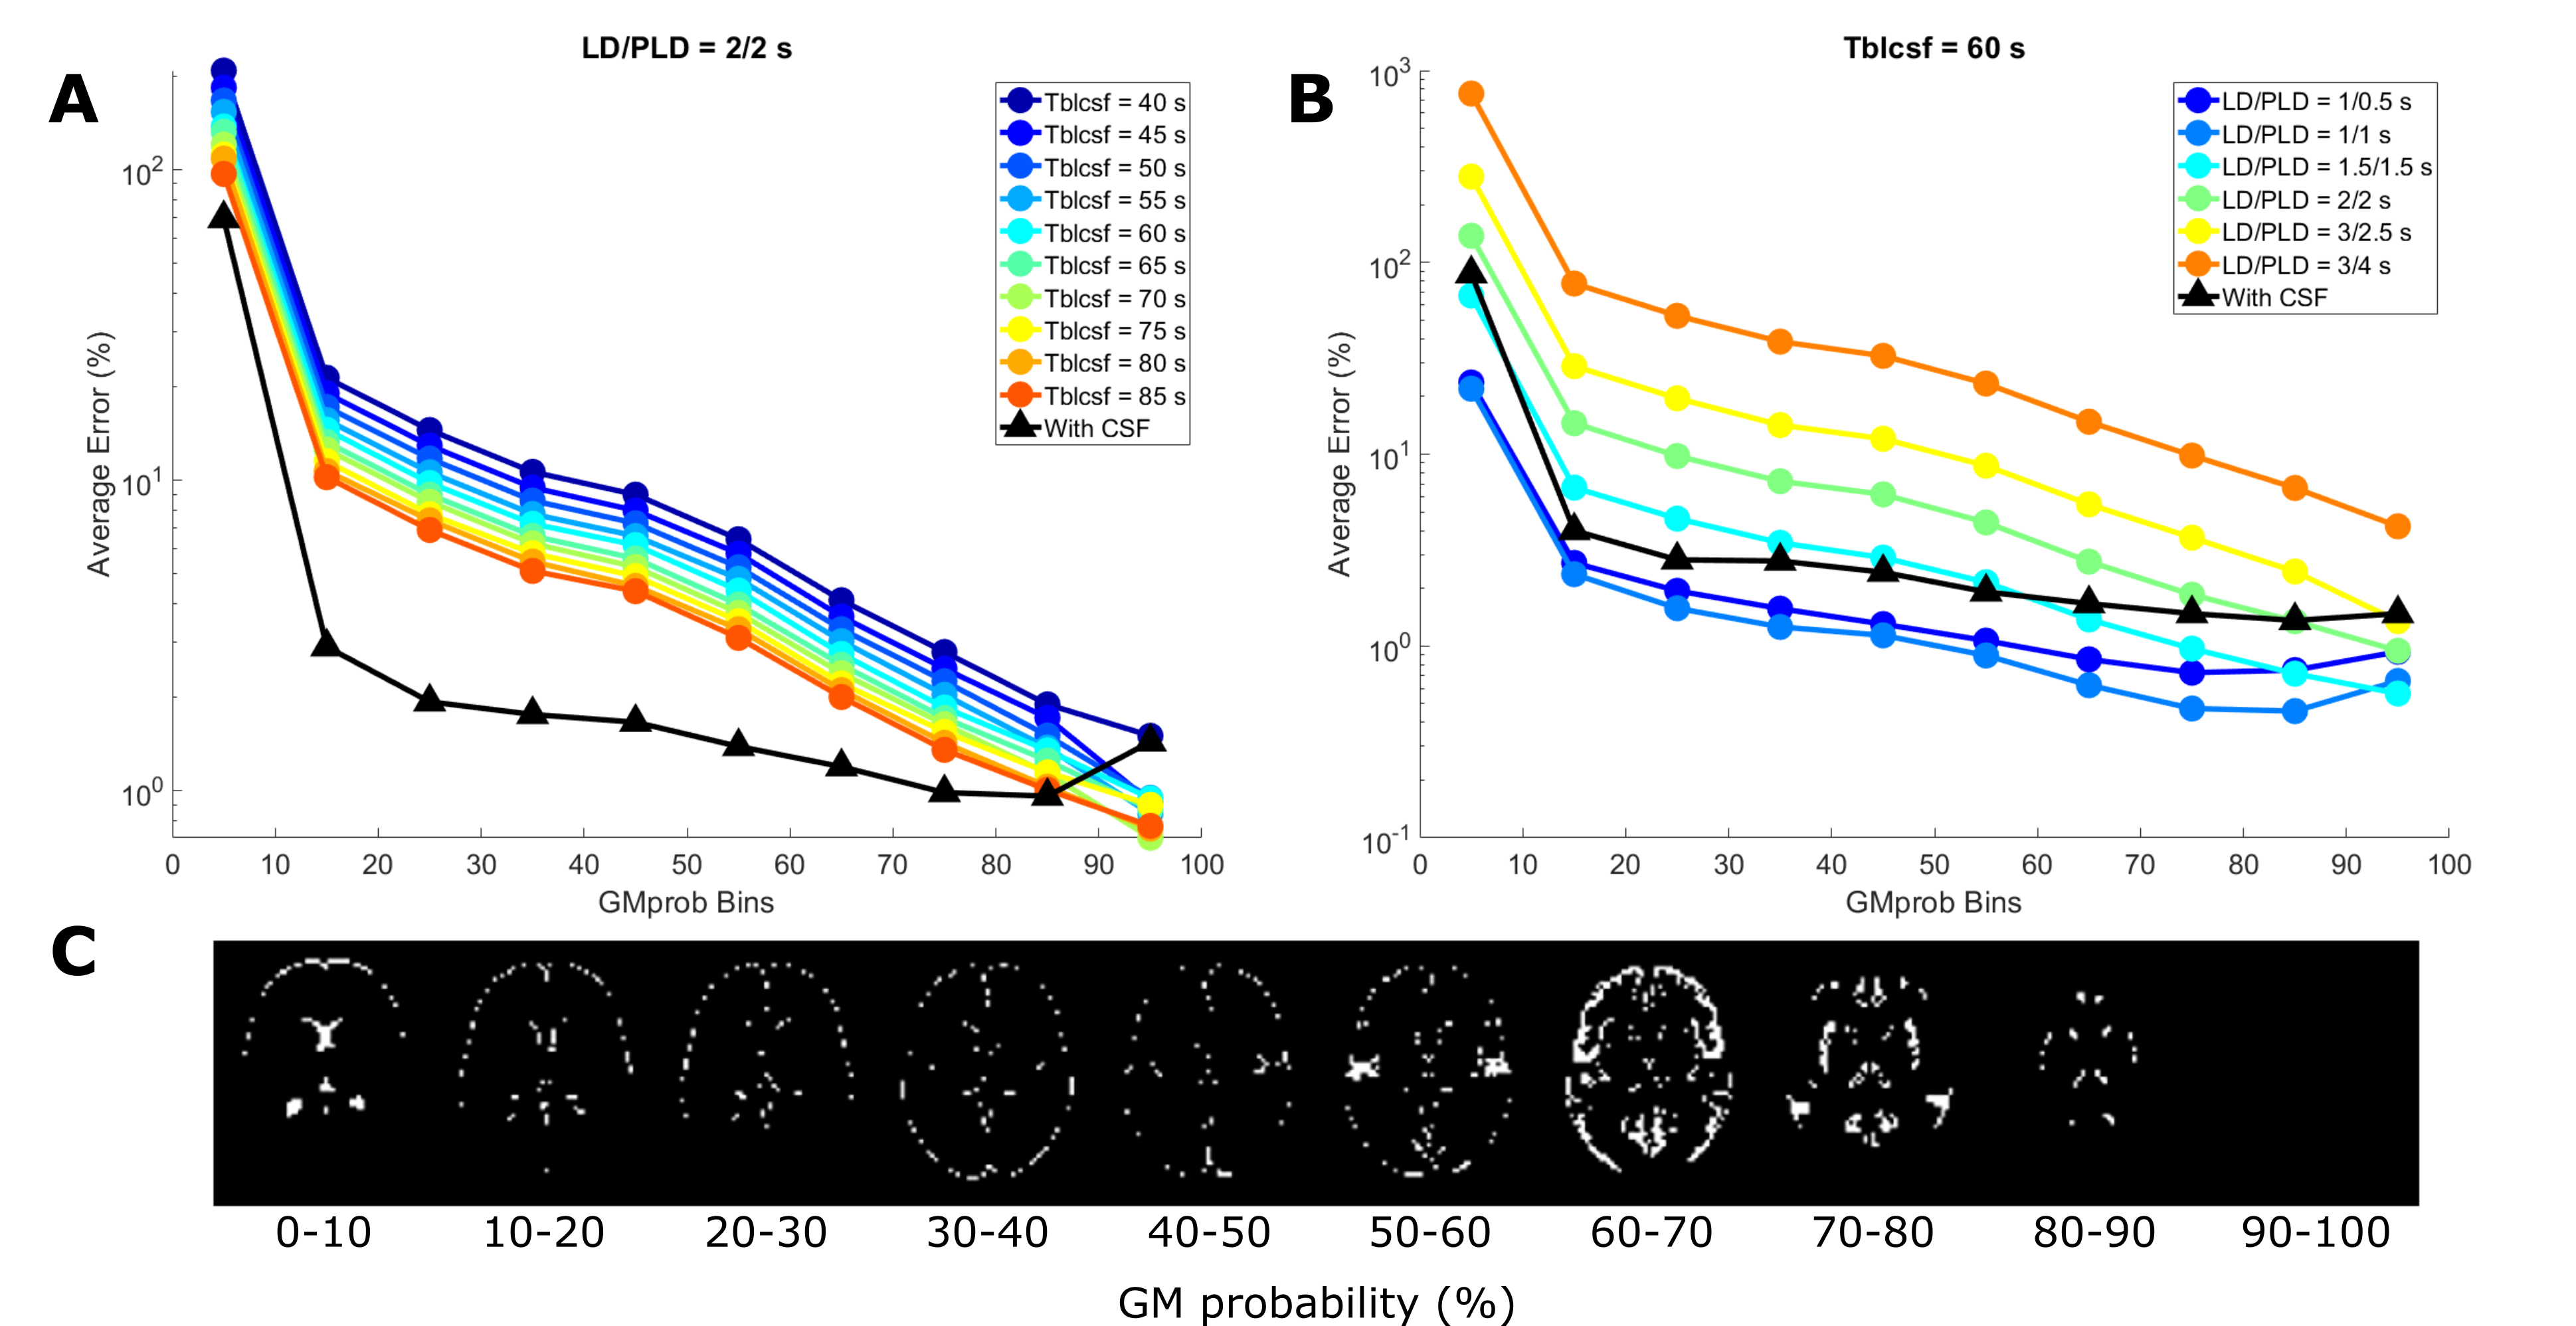
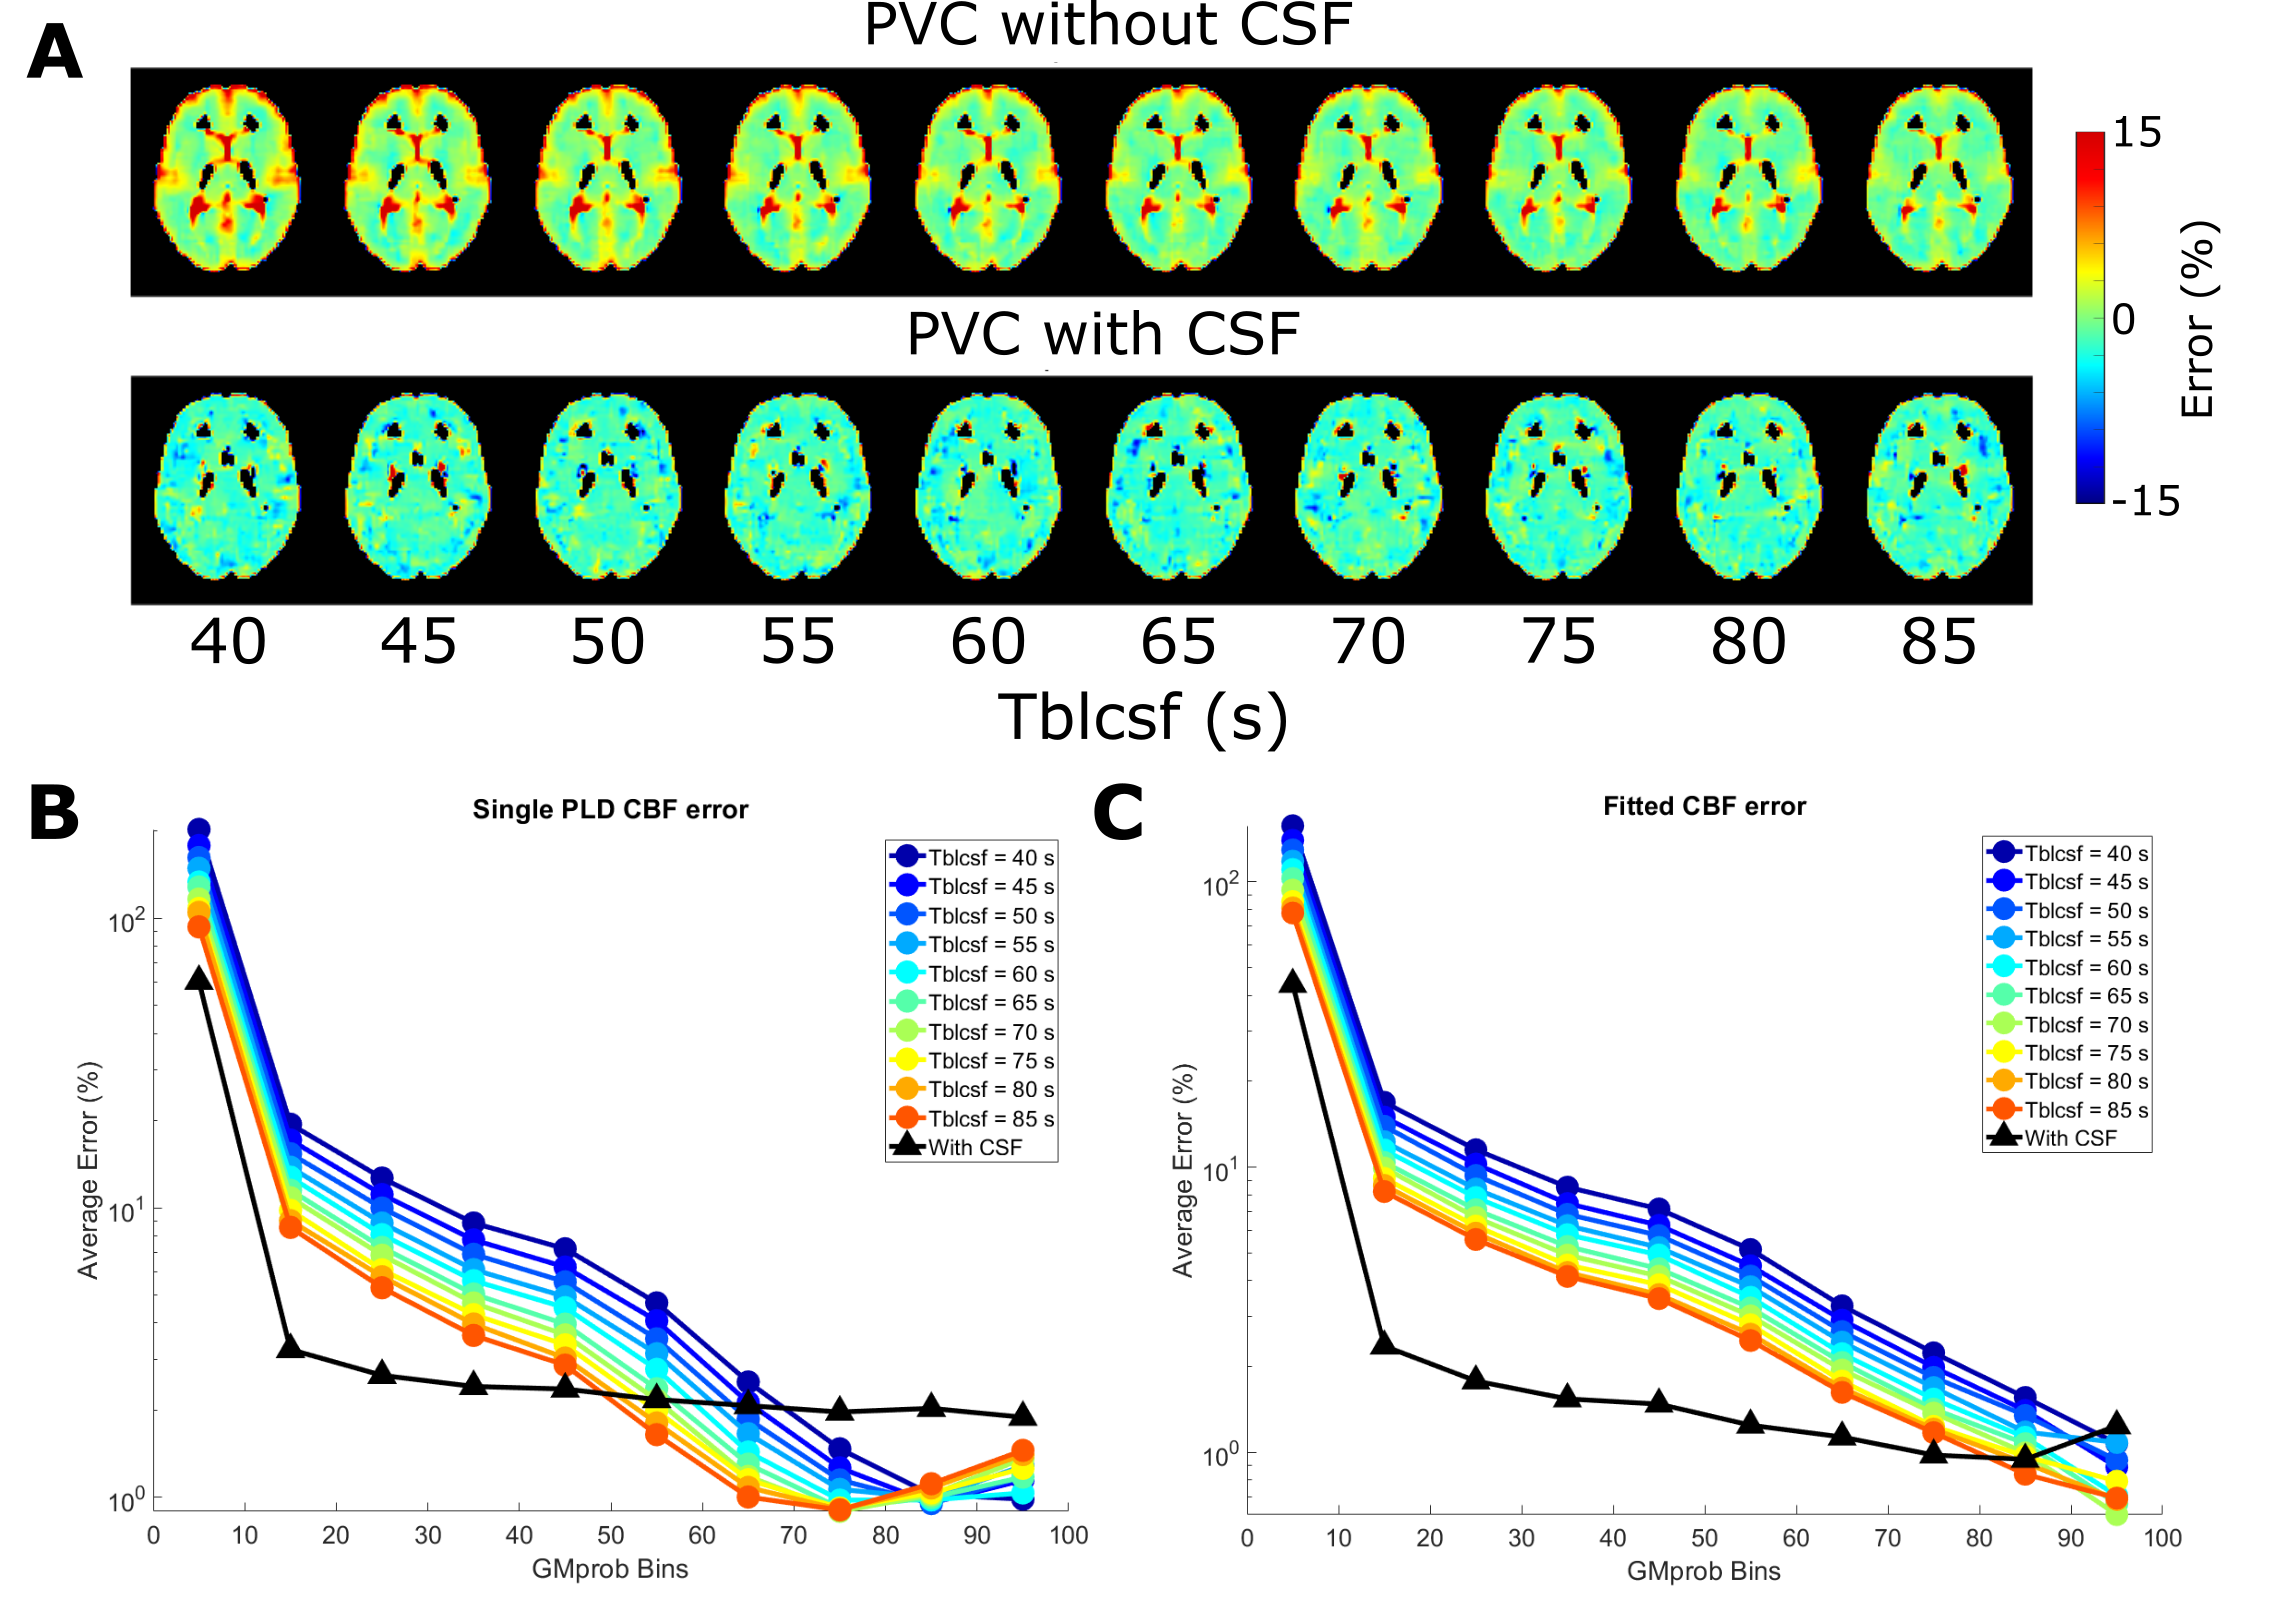
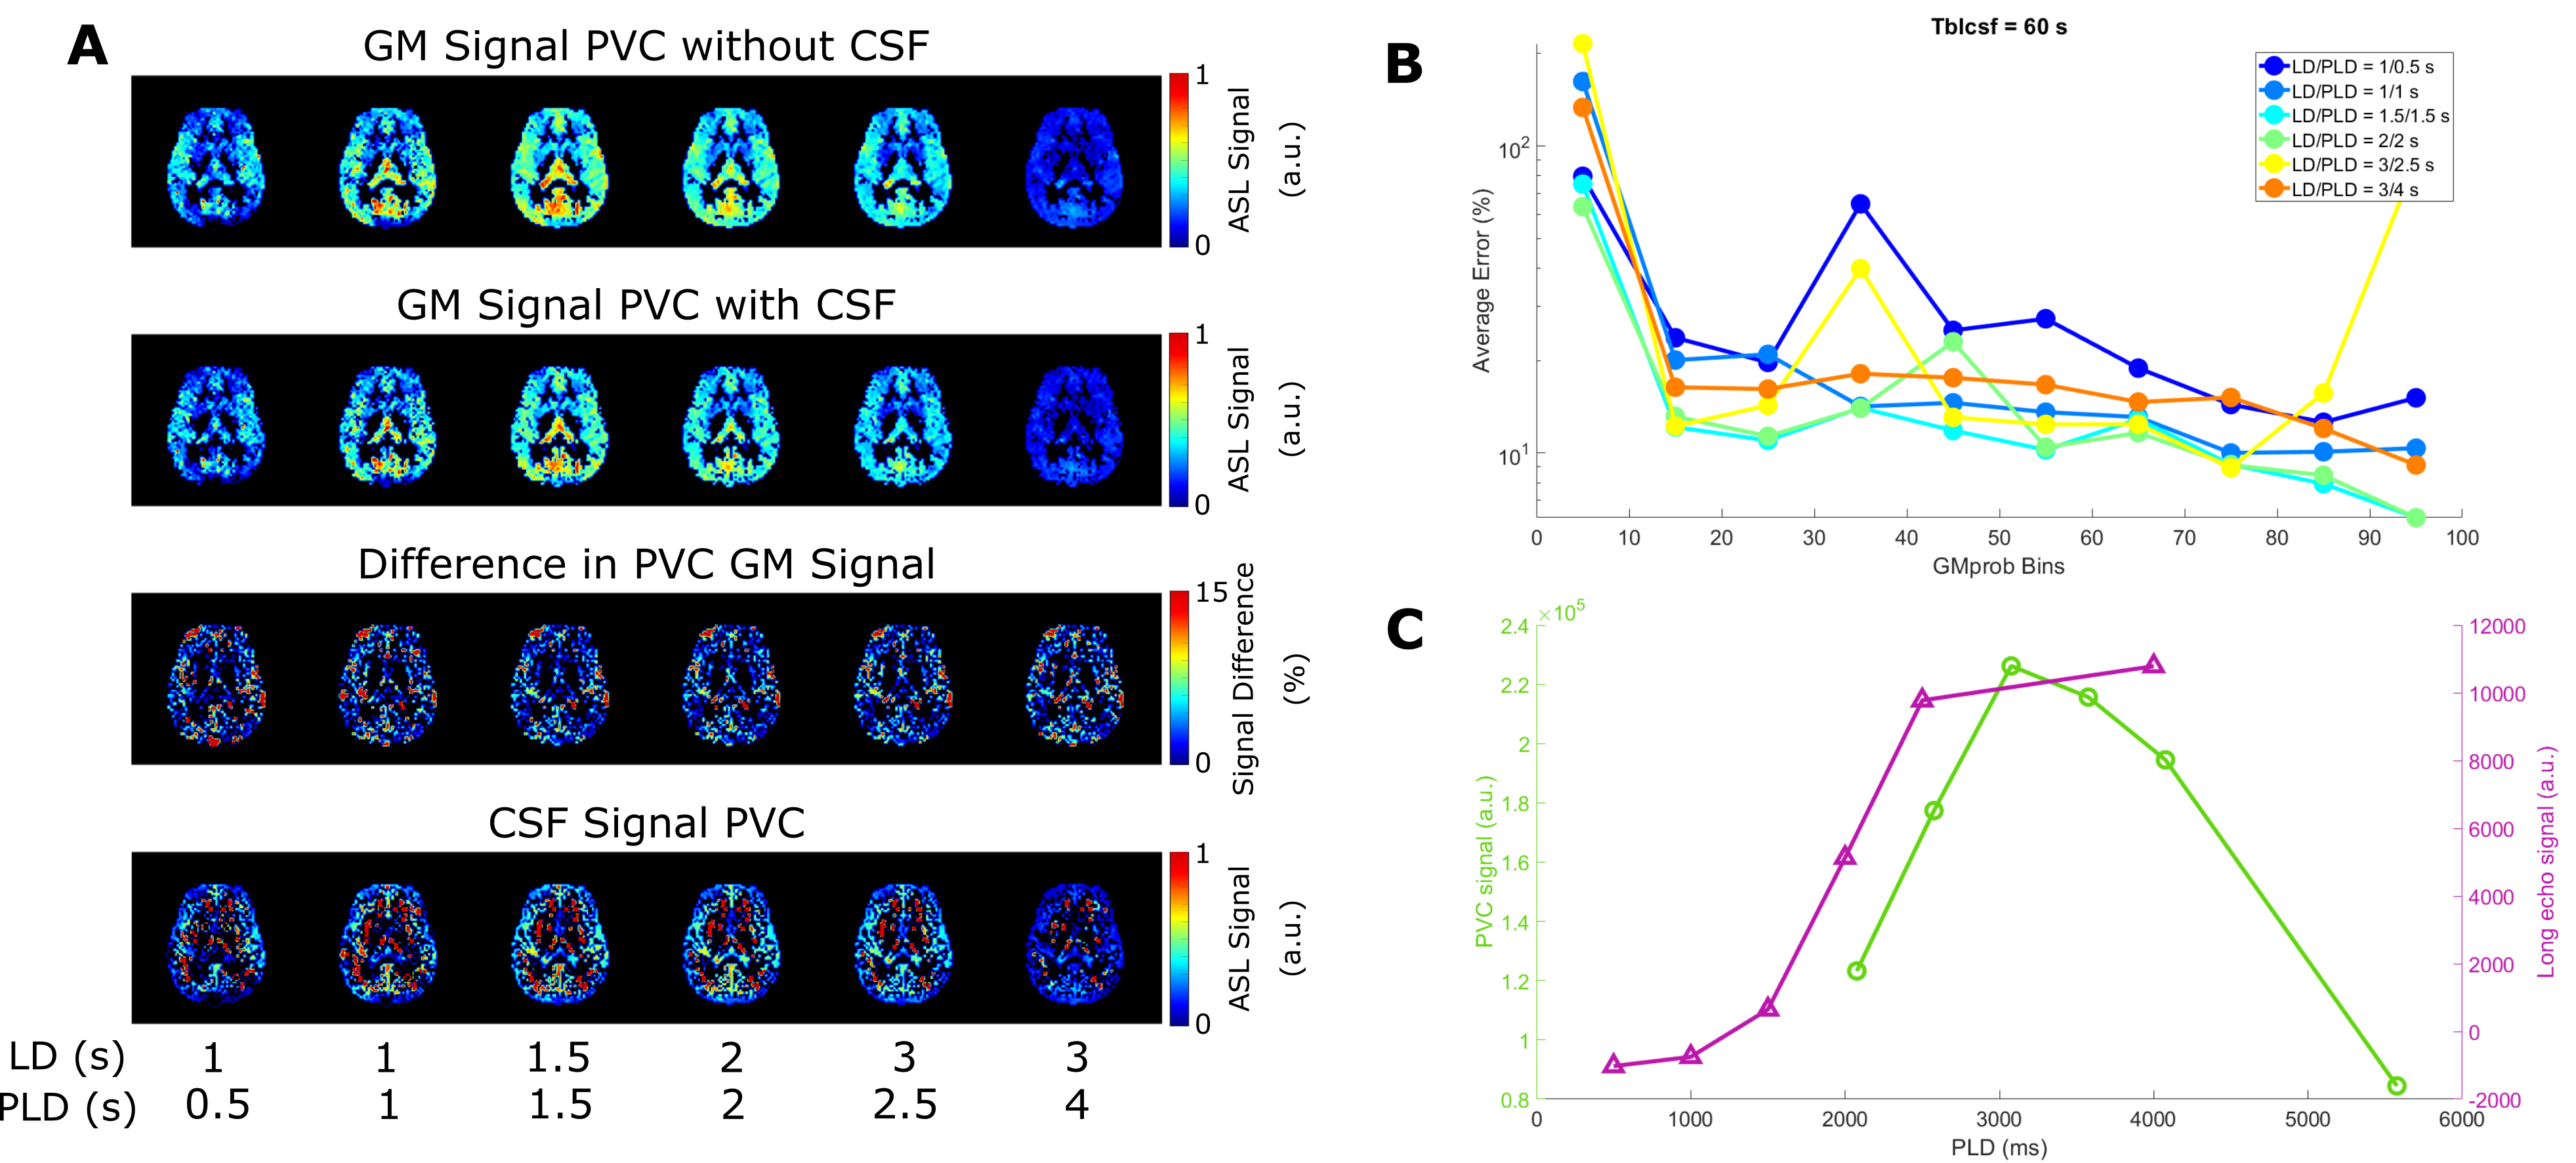
In figure 2, PVC GM signal error maps are shown for an assumed CSF signal of zero (left) and with CSF inclusion (middle). GM signal is more erroneous when LD/PLD is longer and when Tbl->CSF is shorter (indicating more exchange into CSF). Including CSF in PVC retrieves GM signal with a lower error. Due to its low signal, CSF PVC (right) is more affected by the presence of noise and shows higher error outside of areas with large pools of CSF (like the ventricles) and for short LDs/PLDs. Figure 3A shows this error as a function of GMprob for a single LD/PLD, conversely, B shows a single Tbl->CSF. These results demonstrate that without CSF in PVC, GM signal values in a typical pCASL scan may suffer from a 5-10% error (overestimation) in most voxels, in large part corrected by CSF inclusion into PVC. However, for short LDs/PLDs, where CSF signal is truly negligible, including CSF in PVC may in fact increase the GM signal error. This is likely due to noise being mistaken for CSF signal when it is very low. In figure 4A, error maps on single-PLD CBF quantification are shown to suffer from similar errors as the ASL signal. In B, we see an interesting phenomenon: single-PLD quantification results in underestimation of the CBF (seen in bottom row of A), introducing a baseline level of error with the ground truth. However, without CSF PVC, GM CBF is overestimated, partially compensating for this. Nonetheless, CBF error is more uniform over the GM when CSF PVC is used. Finally, model-fitted CBF quantification (C), shows significantly reduced error for most GM voxels by including CSF in PVC. Figure 5 shows the results of in-vivo PVC. Differences between GM signal with and without CSF PVC are more constant over the LDs/PLDs, and are consistently in excess of 10% in most GM-containing voxels. In C the average long-echo CSF signal is shown in purple, contrasted with the average CSF signal from PVC (green). This second curve has been shifted by TE7 to compensate for the longer effective PLD when using very long TEs. There appears to be similarity between the shape of these signals, suggesting the possibility of quantifying BCSFB water exchange with CSF-PVC, however the small amount of overlap between curves makes it difficult to effectively assess correspondence. Data from more subjects may increase the confidence in this result, and modifications to the acquisition scheme could also provide better correspondence.Conclusion
Including CSF in the PVC algorithm was shown to provide more accurate estimates of GM signal and Buxton-CBF, which otherwise suffered from ~10% overestimation. This improvement was more subtle for single-PLD CBF estimates. In vivo, the difference in GM signal between PVC methods also reached around 10%. CSF signal may be extracted using PVC without the use of long TEs, however higher statistical power is needed to confirm this.Acknowledgements
This work is part of the research programme Innovational Research Incentives Scheme Vici with project number 016.160.351, which is financed by the Netherlands Organisation for Scientific Research.References
[1] I. Asllani, C. Habeck, A. Borogovac, T. R. Brown, A. M. Brickman, and Y. Stern, “Separating function from structure in perfusion imaging of the aging brain,” Hum. Brain Mapp., vol. 30, no. 9, pp. 2927–2935, 2009.
[2] L. Petitclerc, L. Hirschler, J. A. Wells, D. L. Thomas, and M. J. P. Van Osch, “Blood-CSF Barrier Imaging in the Human Brain with Arterial Spin Labeling,” (abstract) ISMRM, 2020.
[3] R. B. Buxton, L. R. Frank, E. C. Wong, B. Siewert, S. Warach, and R. R. Edelman, “A general kinetic model for quantitative perfusion imaging with arterial spin labeling.,” Magn. Reson. Med., vol. 40, no. 3, pp. 383–396, 1998.
[4] D. C. Alsop et al., “Recommended implementation of arterial spin-labeled Perfusion mri for clinical applications: A consensus of the ISMRM Perfusion Study group and the European consortium for ASL in dementia,” Magn. Reson. Med., vol. 73, no. 1, pp. 102–116, 2015.
Figures