0965
Characterisation and Removal of Slice Dependent Artifacts in EPI Phase Images1Medical Physics and Biomedical Engineering, UCL, London, United Kingdom
Synopsis
Although EPI phase images are useful (e.g. for Quantitative Susceptibility Mapping), they often contain phase inconsistencies in the slice-select direction which persist and can degrade QSM results. Here, we analysed three EPI datasets in healthy volunteers to characterise these phase inconsistencies and understand whether they occur or interact with interleaved or sequential slice acquisition order. We characterised a ~2Hz cryogen pump artifact in sequential data and slice-to-slice phase jumps in interleaved data. We modified a previously proposed QSM processing pipeline, including 2D (VSHARP) and 3D (PDF) background field removal that removed all through-slice artifacts observed.
Introduction
The phase of high-resolution Echo-Planar (EPI) Images is useful in applications such as distortion correction for functional MRI[1], rapid structural Quantitative Susceptibility Mapping (QSM)[2] and functional QSM (fQSM)[3,4]. However these EPI phase images contain physiological and instrumental noise[6]. Given the very short slice acquisition times in EPI, these noise artifacts often manifest as phase inconsistencies along the slice-select direction. Interleaved slice acquisition is often used in fQSM to minimise cross-talk artifacts between adjacent slices that lowers temporal SNR[5]. Interleaved slice acquisition also prevents a monotonic offset delay that accumulates with sequential slice acquisition[6]. It is not clear how slice ordering interacts with these slice-dependent EPI phase artifacts or whether sequential acquisition could aid artifact removal: a previous artifact reduction strategy was only proposed and tested for interleaved EPI QSM[7]. Therefore, we aimed to characterise these slice-dependent EPI phase artifacts, investigate any interaction between them and slice acquisition order, and demonstrate their removal.Methods
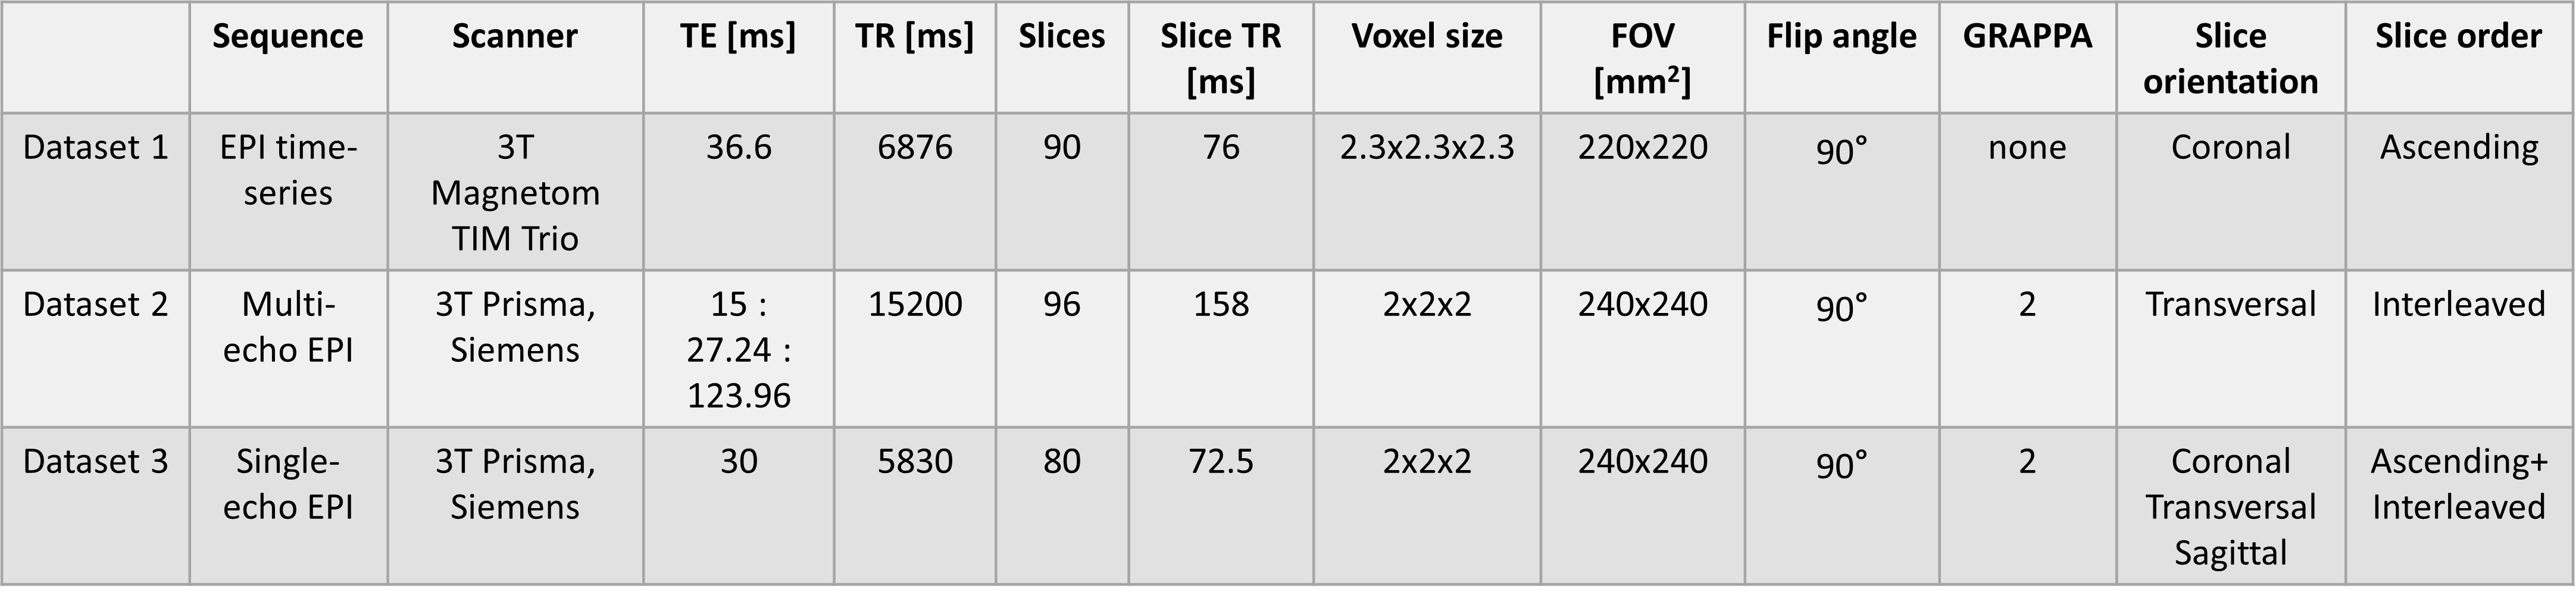
To investigate, we used three datasets acquired at 3T in three healthy volunteers. Dataset 1 was a historic fQSM dataset with sequential acquisition, Dataset 2 was a multi-echo EPI dataset with interleaved acquisition, and we acquired Dataset 3 with both interleaved and sequential slice order and single-echo EPI for this study. The parameters for each dataset are shown in Figure 1.Image Processing
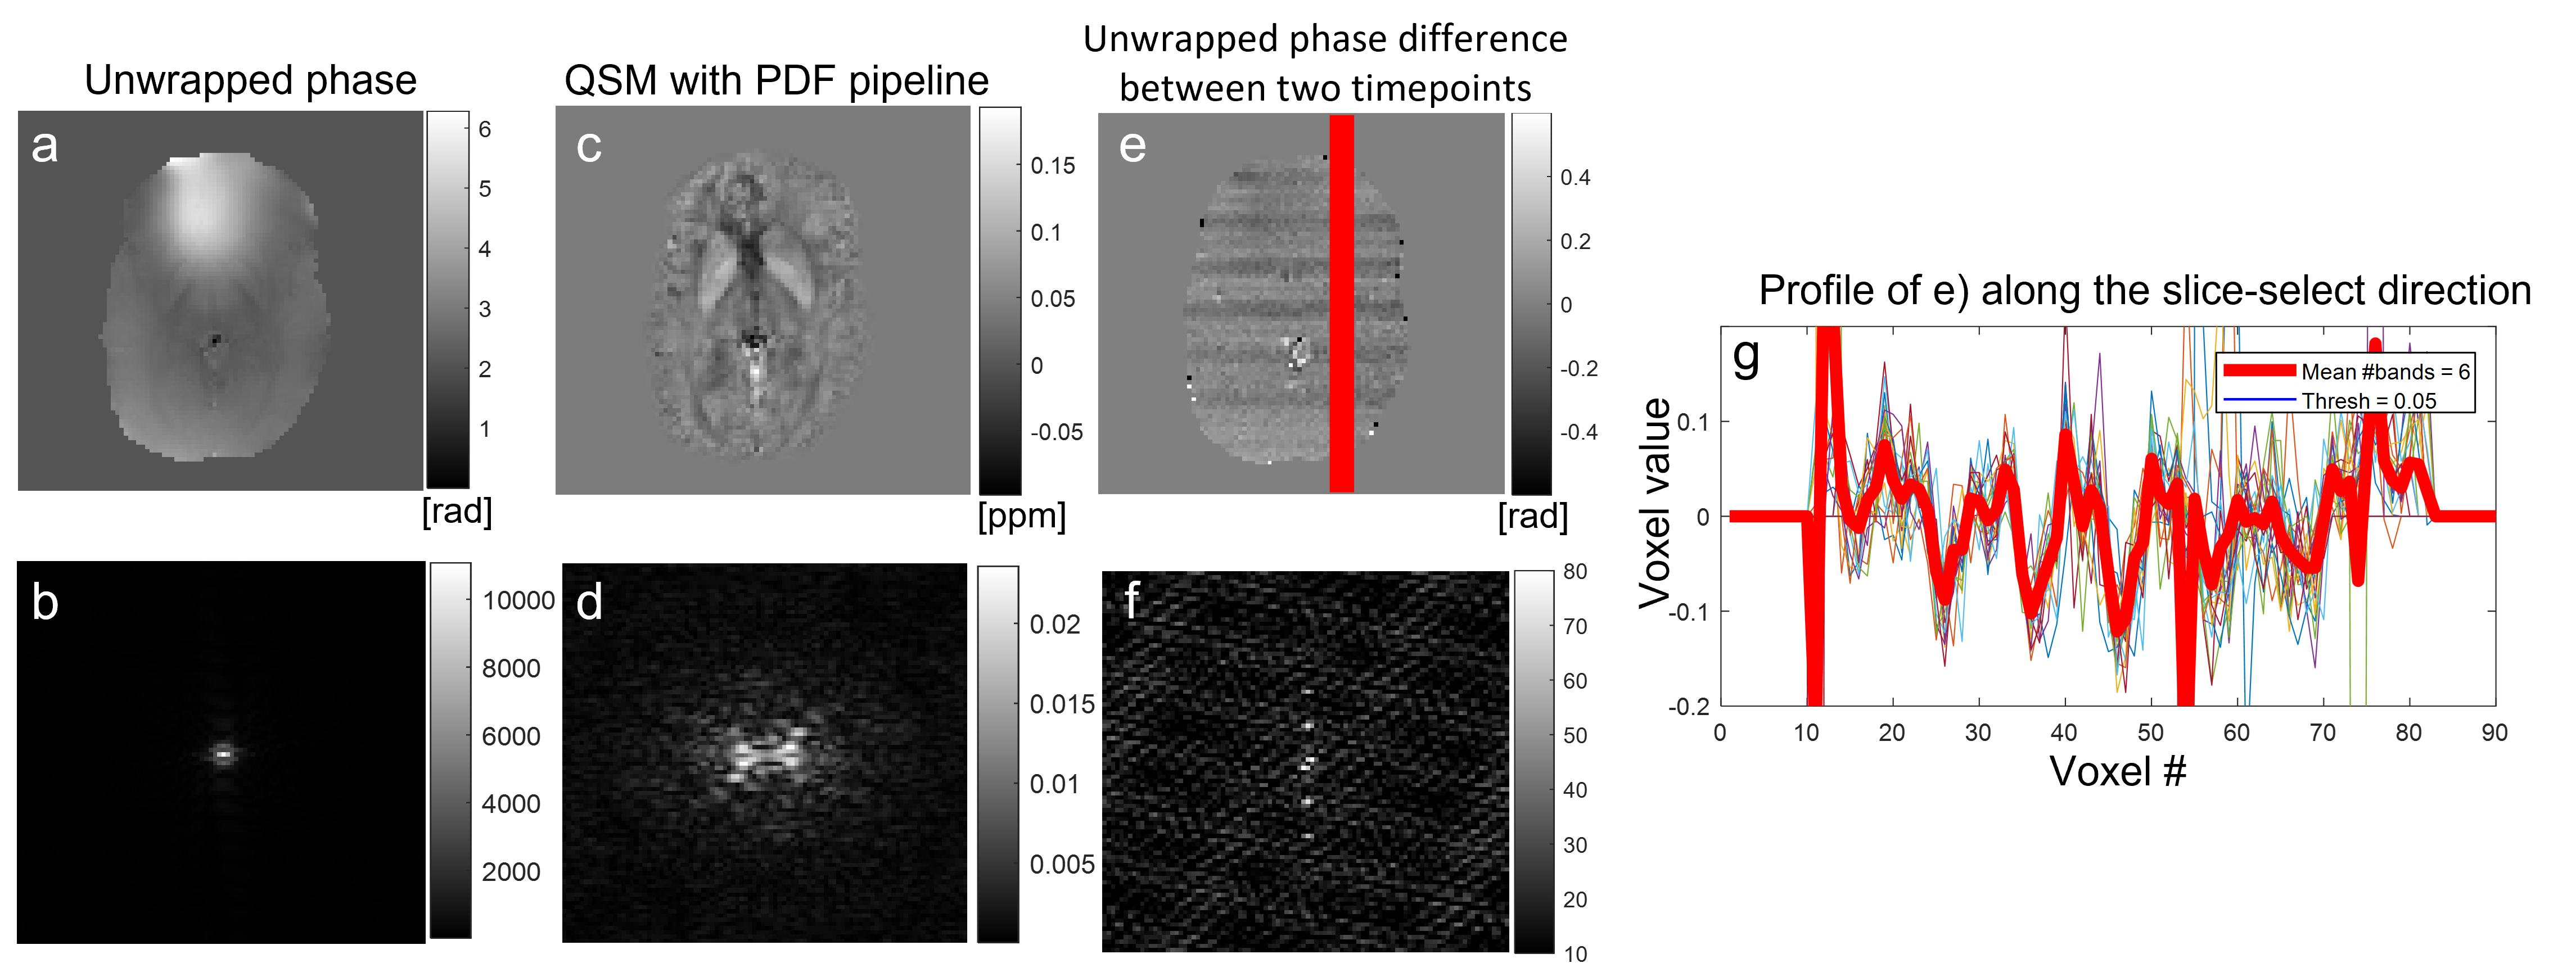
As Dataset 2 was multi-echo data, we performed a nonlinear fit of the complex data[8] to provide a total field map scaled to radians. For all datasets, we unwrapped the phase images using SEGUE[9], followed by one of two background field removal strategies: either PDF[10] “PDF pipeline” or 2D-VSHARP[11] followed by PDF “2D+3D pipeline” similar to the 2D-VSHARP + 3D-VSHARP strategy recommended in[5]. We used PDF as it is more robust than V-SHARP[12]. We then calculated susceptibility maps using an iterative Tikhonov approach with a=0.05[13,14].We characterised the frequency of the phase artifact shown in Figure 2 using an in-house algorithm (with a 5% threshold) to calculate the number of slices between each phase jump in a 20-voxel profile through the unwrapped phase difference image between two EPI timepoints:
$$Frequency = 1/(slice TR * Nslices)$$
Results
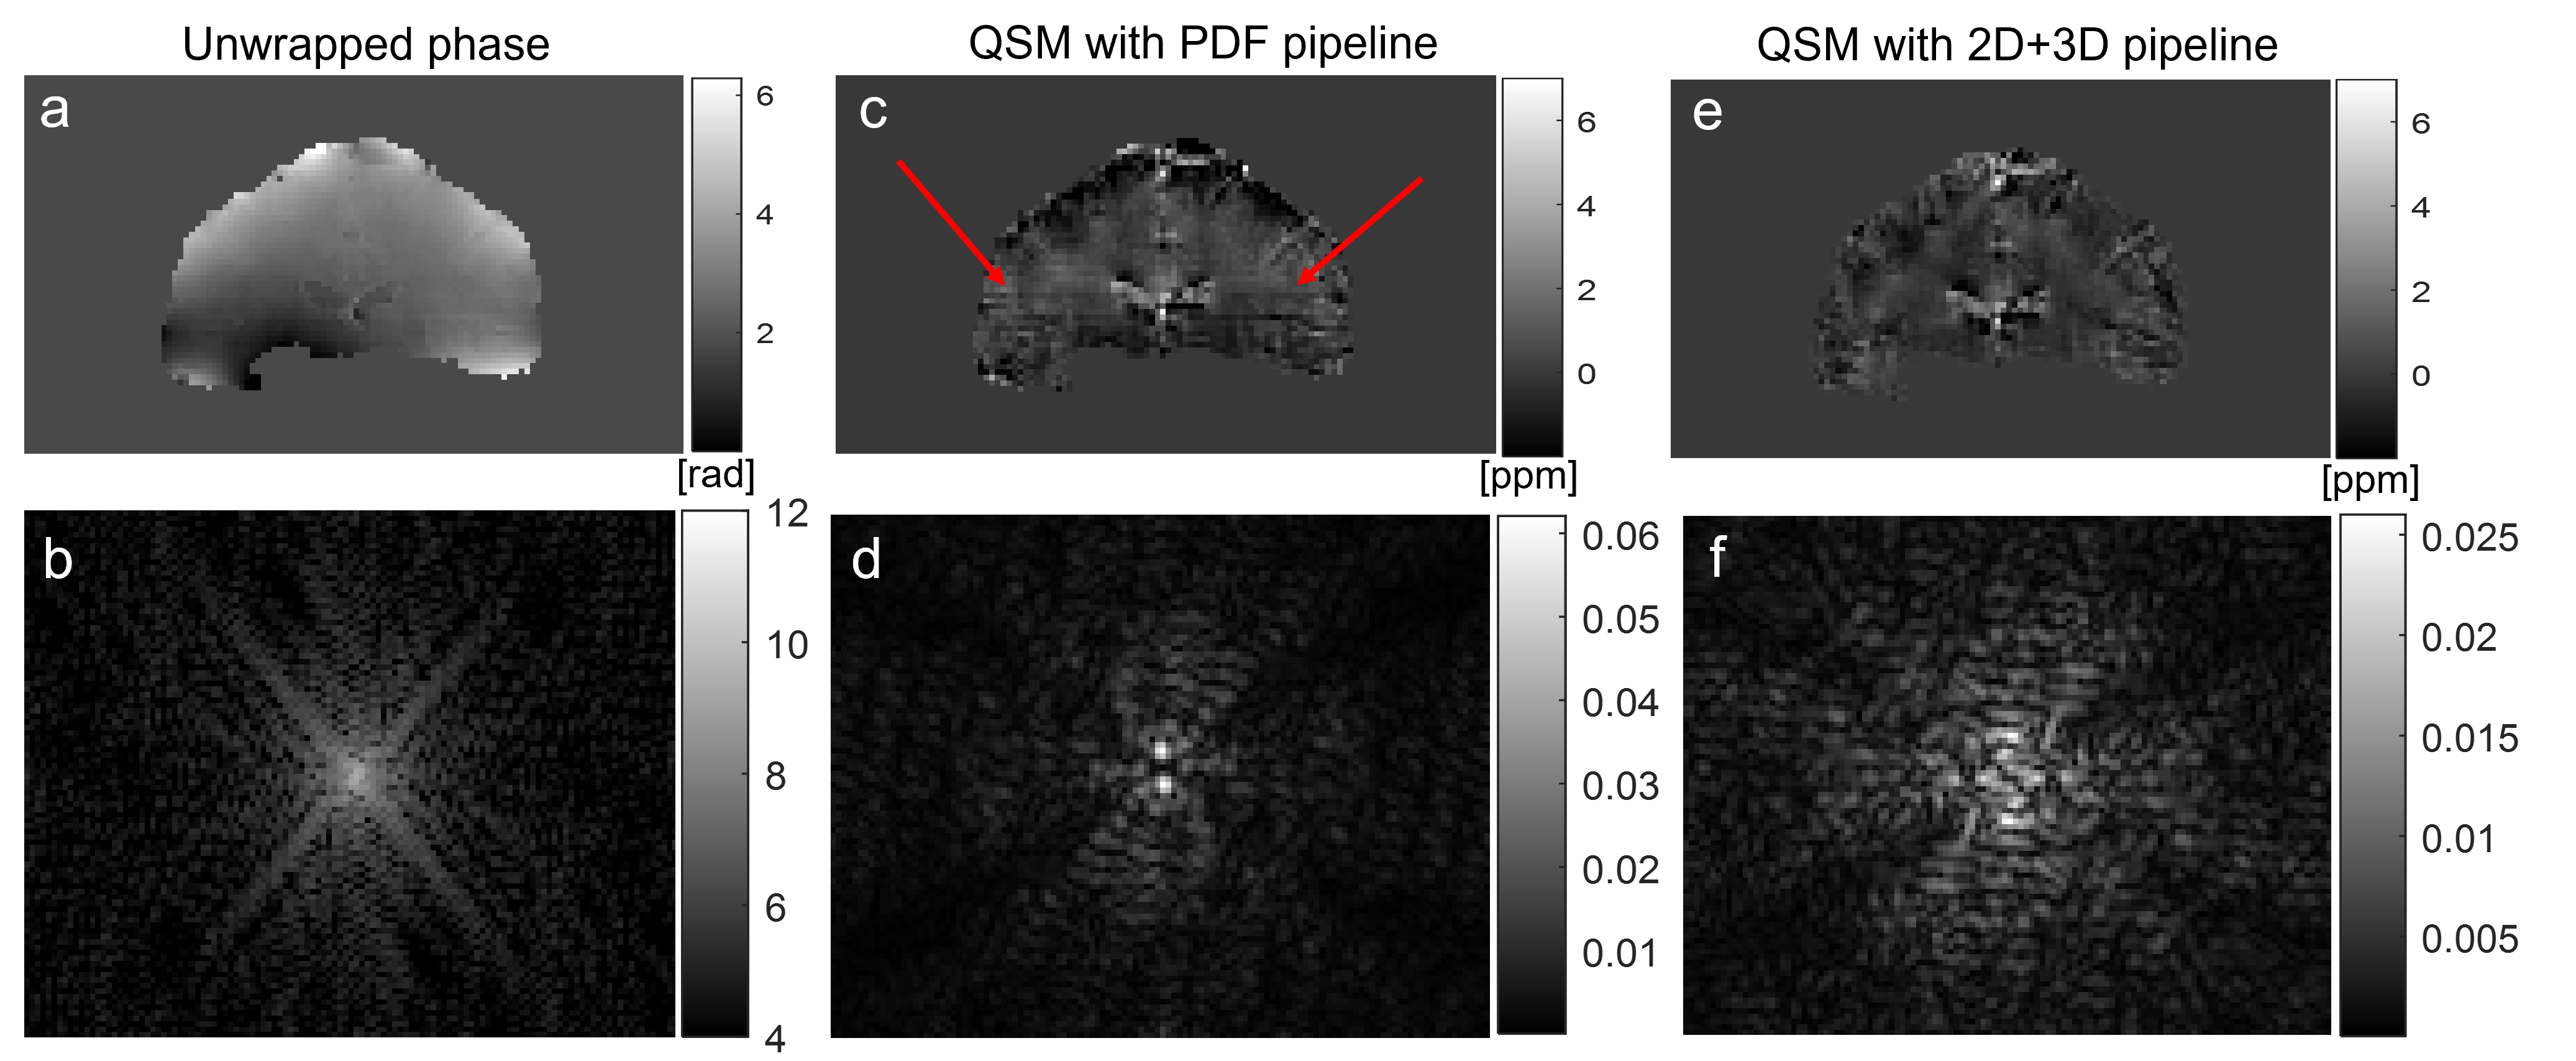
In every figure, slices in the orientation perpendicular to the slice orientation from each dataset are presented to highlight phase inconsistencies in the slice-select direction. The first sequential dataset shows a 2.19 Hz regular artifact (Figure 2) only visible in the unwrapped phase difference between two timepoints (and the corresponding k-space).In the interleaved multi-echo dataset with interleaved slice order (Figure 3), this regular artifact did not appear. However, there were slice-to-slice jumps visible in the PDF QSM (red arrows). These jumps disappeared when the 2D+3D QSM pipeline was used.
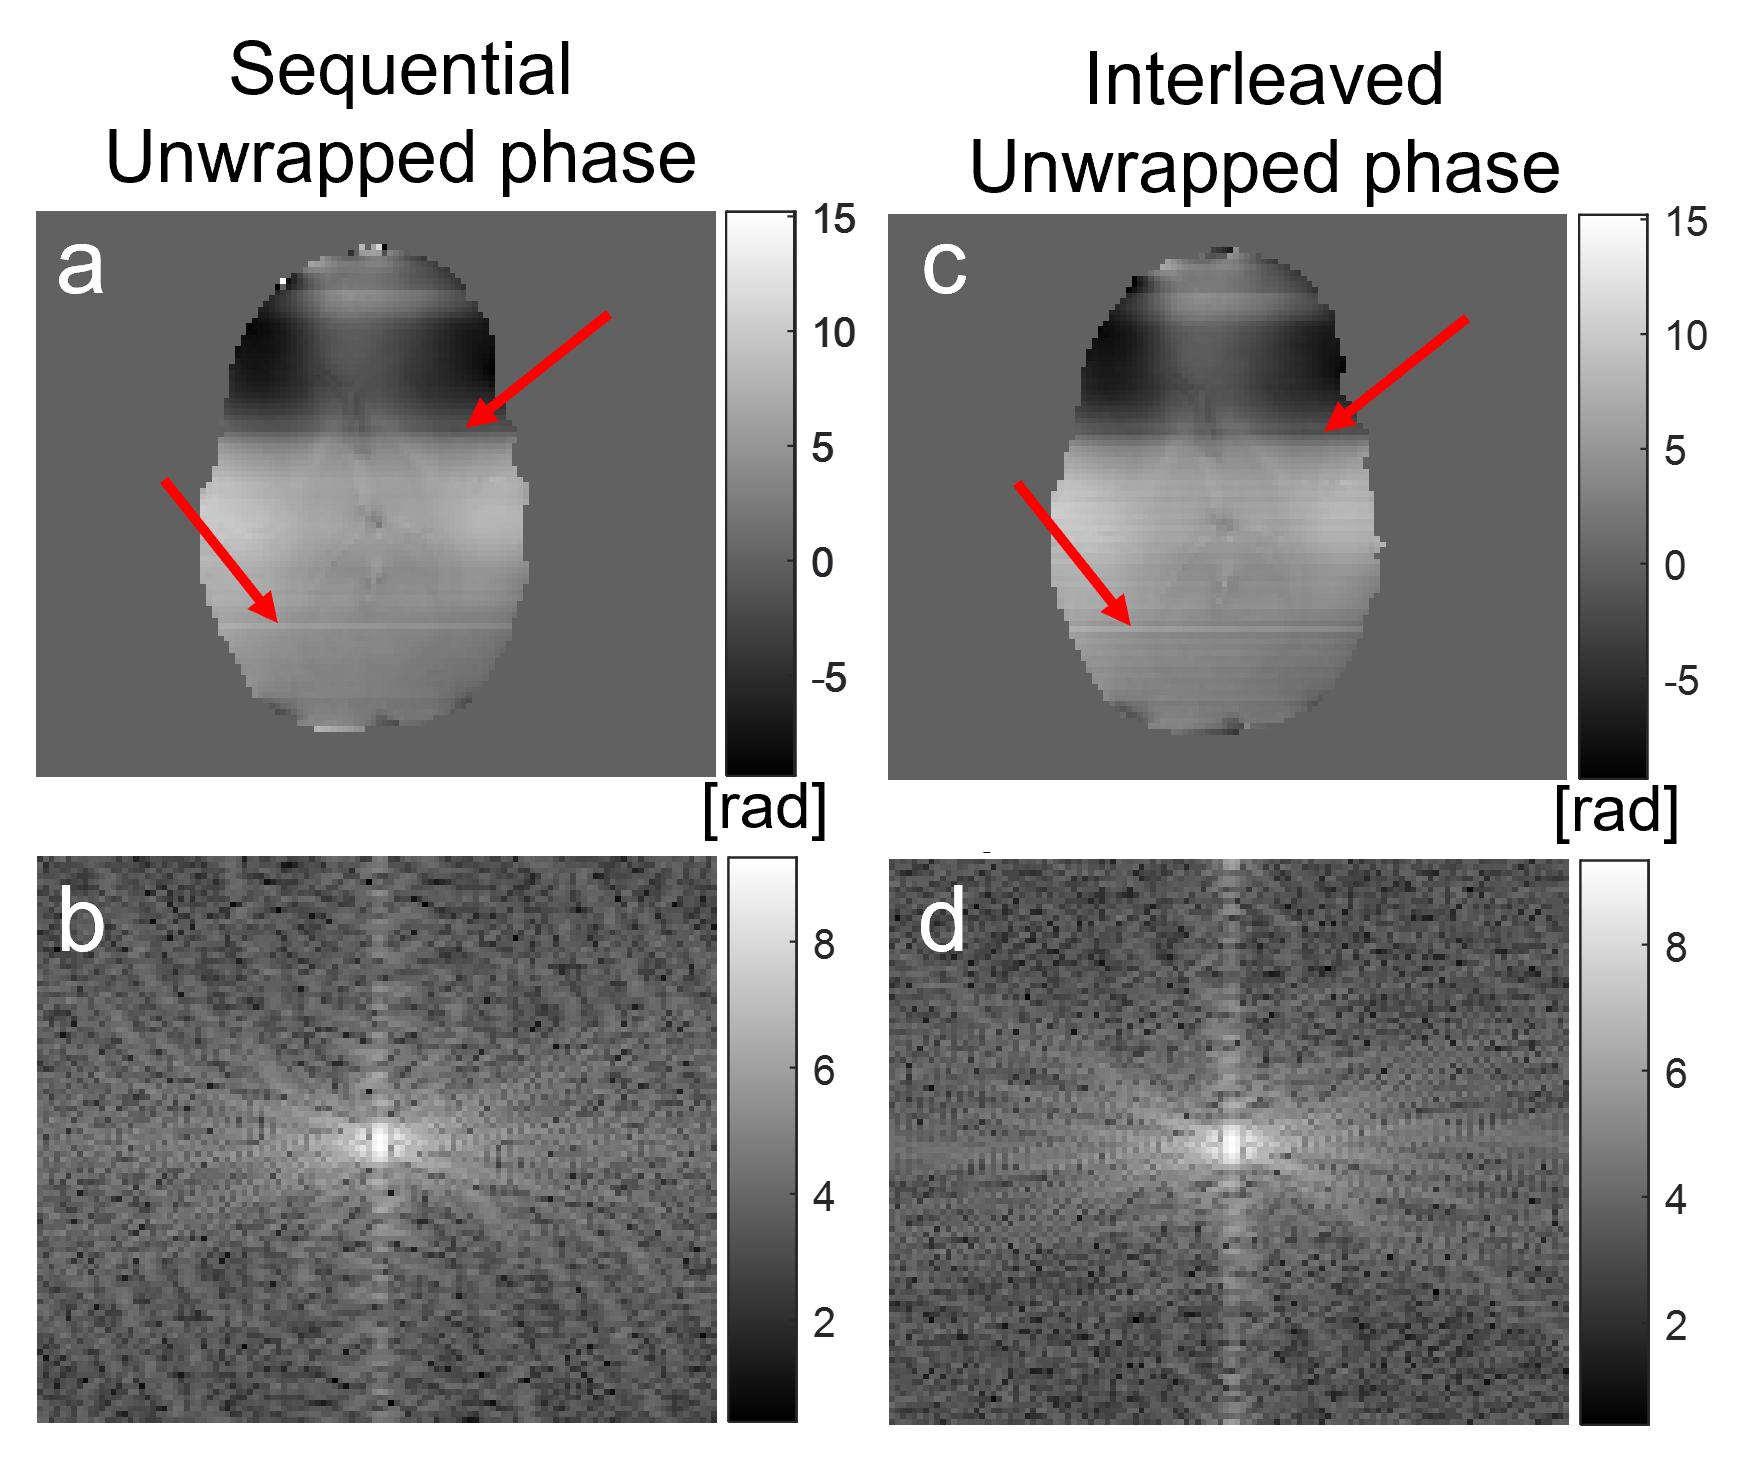
In sequential single-echo acquisitions (Figures 4-5), no regular through-slice artifact (similar to Figure 2) is visible (Figure 4) but the interleaved image does show jumps similar to Figure 3. There are new irregularly spaced slice phase inconsistencies with an identical appearance in both sequential and interleaved unwrapped phase images (red arrows). These artifacts persist into the PDF QSM (red arrows, Figure 5a-d) but disappear with 2D+3D processing (Figure 5 e-h).
Discussion
The artifact with a regular frequency could only be observed in a historic fQSM Dataset 1 with sequential acquisition in the unwrapped phase difference between two timepoints (Figure 2). Given its frequency close to 2Hz it is likely that this was caused by the magnet’s cryogenic pump. This artifact has been described as a sinusoidal ~2 Hz wave, that travels in the slice-select direction[3,4]. The fact that this is a travelling wave may explain why it was only visible in the phase difference between two timepoints. As expected, this cryopump artifact could not be clearly characterised in images acquired with interleaved slice order but it may have contributed to the consistent alternating slice phase jumps observed in interleaved images (Figures 3a, c, 4c, 5c). The cryopump artifact was removed in the QSM with PDF pipeline (Figure 2c). However, the 2D+3D QSM pipeline was needed to remove the inter-slice jumps in the interleaved image (Figure 3e). Therefore, we hypothesized that the 2D+3D QSM pipeline would only be needed for interleaved acquisitions. Unfortunately, this was not the case as an additional artifact was observed in the slice-select direction that was identical for both sequential and interleaved acquisitions (Figures 4-5). This artifact may be due to coil combination being applied on a slice-by-slice basis in this EPI sequence designed for simultaneous multislice acquisition[15]. Fitting the phase over multiple echoes seemed to remove these additional phase inconsistencies (Figure 3a) which supports this idea. Fortunately, the 2D+3D QSM pipeline efficiently removed all through-slice phase artifacts (Figure 5e-h).Conclusion
We characterised a ~2Hz artifact in the slice-select direction in EPI phase with sequential slice order which was probably caused by the magnet’s cryogenic pump. All interleaved EPI acquisitions had slice-to-slice phase inconsistencies which required a 2D+3D processing pipeline to remove them from QSM. We could not replicate the 2Hz cryopump artifact in newer sequential acquisitions but observed additional phase inconsistencies at consistent positions in the slice-select direction across both sequential and interleaved acquisitions. Fortunately, the 2D+3D QSM pipeline could remove all phase inconsistencies in the slice-select direction.Acknowledgements
All authors were supported by European Research Council Consolidator Grant DiSCo MRI SFN 770939.References
[1] Dymerska B, Poser BA, Bogner W, Visser E, Eckstein K, Cardoso P, Barth M, Trattnig S, Robinson SD. Correcting dynamic distortions in 7T echo planar imaging using a jittered echo time sequence. Magn Reson Med. 2016 Nov;76(5):1388-1399. doi: 10.1002/mrm.26018. Epub 2015 Nov 19. PMID: 26584148; PMCID: PMC5082535.
[2] Sun H, Seres P, Wilman AH. Structural and functional quantitative susceptibility mapping from standard fMRI studies. NMR Biomed. 2017 Apr;30(4). doi: 10.1002/nbm.3619. Epub 2016 Sep 30. PMID: 27687150.
[3] Balla, D., Sanchez-Panchuelo, R., Wharton, S., Hagberg, G., Scheffler, K., Francis, S., et al. (2014). Functional quantitative susceptibility mapping (fQSM). NeuroImage, 100, 112-124. doi:10.1016/j.neuroimage.2014.06.011.
[4] Gisela E. Hagberg, Marta Bianciardi, Valentina Brainovich, Antonino Mario Cassarà, Bruno Maraviglia. The effect of physiological noise in phase functional magnetic resonance imaging: from blood oxygen level-dependent effects to direct detection of neuronal currents. Magnetic Resonance Imaging, Volume 26, Issue 7, 2008, Pages 1026-1040, ISSN 0730-725X, https://doi.org/10.1016/j.mri.2008.01.010.
[5] Cheng H, Puce A. Reducing respiratory effect in motion correction for EPI images with sequential slice acquisition order. J Neurosci Methods. 2014 Apr 30;227:83-9. doi: 10.1016/j.jneumeth.2014.02.007. Epub 2014 Feb 19. PMID: 24561185.
[6] David Parker, Xueqing Liu, Qolamreza R. Razlighi. Optimal slice timing correction and its interaction with fMRI parameters and artifacts. Medical Image Analysis, Volume 35, 2017, Pages 434-445, ISSN 1361-8415,
https://doi.org/10.1016/j.media.2016.08.006.
[7] Wei H, Zhang Y, Gibbs E, Chen NK, Wang N, Liu C. Joint 2D and 3D phase processing for quantitative susceptibility mapping: application to 2D echo-planar imaging. NMR Biomed. 2017 Apr;30(4). doi: 10.1002/nbm.3501. Epub 2016 Feb 17. PMID: 26887812.
[8] Liu T, Liu J, de Rochefort L, Spincemaille P, Khalidov I, Ledoux JR, Wang Y. Morphology enabled dipole inversion (MEDI) from a single-angle acquisition: comparison with COSMOS in human brain imaging. Magn Reson Med. 2011 Sep;66(3):777-83. doi: 10.1002/mrm.22816. Epub 2011 Apr 4. PMID: 21465541.
[9] Karsa A, Shmueli K. SEGUE: A Speedy rEgion-Growing Algorithm for Unwrapping Estimated Phase. IEEE Trans Med Imaging. 2019 Jun;38(6):1347-1357. doi: 10.1109/TMI.2018.2884093. Epub 2018 Dec 11. PMID: 30561341.
[10] Liu T, Khalidov I, de Rochefort L, Spincemaille P, Liu J, Tsiouris AJ, Wang Y. A novel background field removal method for MRI using projection onto dipole fields (PDF). NMR Biomed. 2011 Nov;24(9):1129-36. doi: 10.1002/nbm.1670. Epub 2011 Mar 8. PMID: 21387445; PMCID: PMC3628923.
[11] Li W, Wu B, Liu C. Quantitative susceptibility mapping of human brain reflects spatial variation in tissue composition. Neuroimage. 2011 Apr 15;55(4):1645-56. doi: 10.1016/j.neuroimage.2010.11.088. Epub 2011 Jan 9. PMID: 21224002; PMCID: PMC3062654.
[12] Schweser F, Robinson SD, de Rochefort L, Li W, Bredies K. An illustrated comparison of processing methods for phase MRI and QSM: removal of background field contributions from sources outside the region of interest. NMR Biomed. 2017 Apr;30(4):10.1002/nbm.3604. doi: 10.1002/nbm.3604. Epub 2016 Oct 7. PMID: 27717080; PMCID: PMC5587182.
[13] https://xip.uclb.com/product/mri_qsm_tkd
[14] Anita Karsa, Shonit Punwani and Karin Shmueli. An optimized and highly repeatable MRI acquisition and processing pipeline for quantitative susceptibility mapping in the head‐and‐neck region. Magn Reson Med. Vol. 84(6):3206-3222. DOI: 10.1002/mrm.28377
[15] Auerbach EJ, Xu J, Yacoub E, Moeller S, Uğurbil K. Multiband accelerated spin-echo echo planar imaging with reduced peak RF power using time-shifted RF pulses. Magn Reson Med. 2013 May;69(5):1261-7. doi: 10.1002/mrm.24719. Epub 2013 Mar 6. PMID: 23468087; PMCID: PMC3769699.
Figures