0950
New Denoising Neural Network for Diffusion Tensor Imaging Signal-to-Noise Ratio Enhancement1National Taiwan University, Taipei, Taiwan
Synopsis
本研究提出了一種新的神經網絡模型來提高 DTI 圖像的信噪比。從實驗結果來看,我們成功地將圖像的 SNR 提高了 3 倍,相當於減少了 9 倍的掃描時間。這將改善因信噪比不足而導致的 DTI 分析困難。
Abstract
Diffusion Tensor Imaging (DTI) is an indispensable tool in neuroscience and clinical studies which calculates the diffusion level and direction of brain water molecules, thereby indicating the direction of neural connections. However, DTI requires excessively prolonged scan time to deliver quality results. This study proposed an innovative neural network post-processing method to remove background noises of DTI images, increasing SNR while retaining the characteristics of the original image.We obtained high-SNR rat brain DTI images as the learning target and low-SNR DTI images as the training dataset. Through the residual learning method, the neural network studies the background noise pattern of DTI to reduce image noise. After training, we verified the learning results with our validation set. Quantitative indicators, including the structural similarity index (SSIM) of images, fractional anisotropy(FA) map, and the angle difference with the target, are used for analysis.
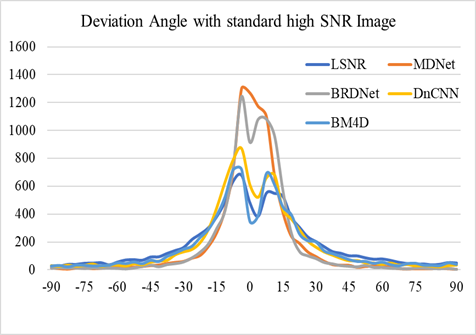
The quantitative analyses showed improvement over previous models, as our model achieved an image similarity index of 0.984 and a 16.076° angle difference compared with standard images. After denoising, the image is improved by 3x SNR effect.
In general, this paper provides a neural network model with notable results in denoising DTI. In the future, a continuous expansion of the training data set will considerably improve this network model to further contribute to neuroscience, psychological researches, and clinical interpretation.
INTRODUCTION
DTI is an analysis method for neural connections that require high SNR images to deliver accurate analysis results. A simple way to improve SNR is by increasing the average number of images, but the resulting prolonged scan time hinders this method’s practicality in clinical usages. Therefore, we like to propose a post-processing approach to improve this problem by using a neural network with powerful image processing capabilities. Our purpose is to design a novel time-saving model that also improves the shortcomings of the blur boundary problem of past neural networks in denoising medical images.METHOD
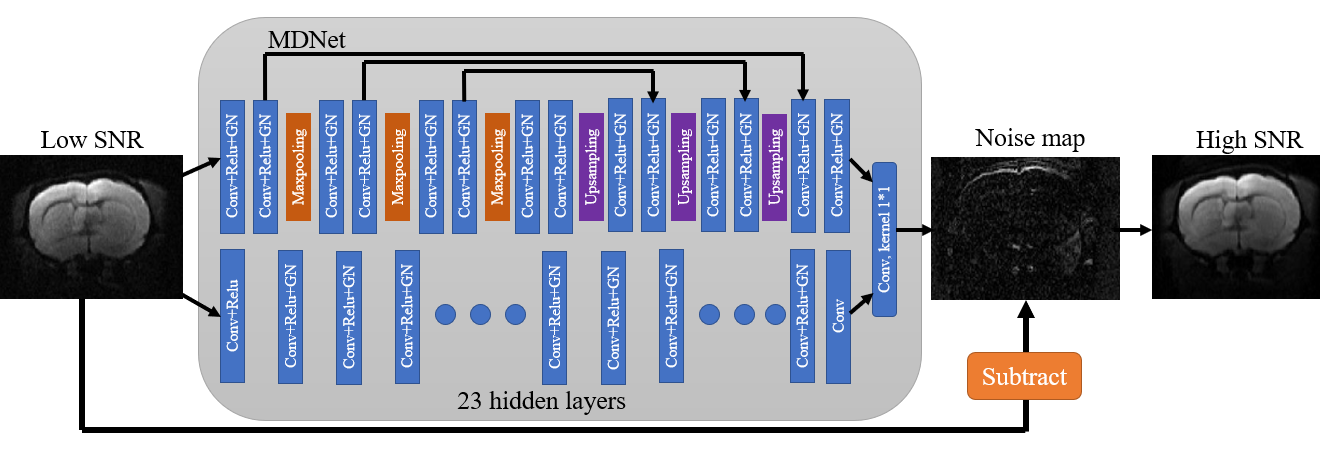
First, we acquired rat brain images and obtained high-SNR DTI images by increasing the number of averages as the target of neural network learning. Next, images with low average times will be collected as the training data set. Through the residual learning method, the neural network studies the background noise pattern of diffusion tensor imaging, and finally, the result after denoising will be obtained.The model structure is divided into upper and lower sections. The upper section provides complete image information by connecting the front and rear layers. The lower section is the DnCNN denoising ontology, and finally, a convolutional layer is used for output. As shown in Fig.1., The input image is a low SNR image, and the model outputs the MRI noise distribution map. By subtracting the map from the input image, a high-SNR image is obtained. Therefore, the target of the training data set to be approximated by the loss function calculation is the residual image, rather than directly comparing with the high-SNR images.
After training, we take the testing set for verification. The quantitative indicators, including the image similarity of the structural images, the FA value distribution, and the angle difference with the standard image, proved the credibility of the results of this neural network.
RESULT
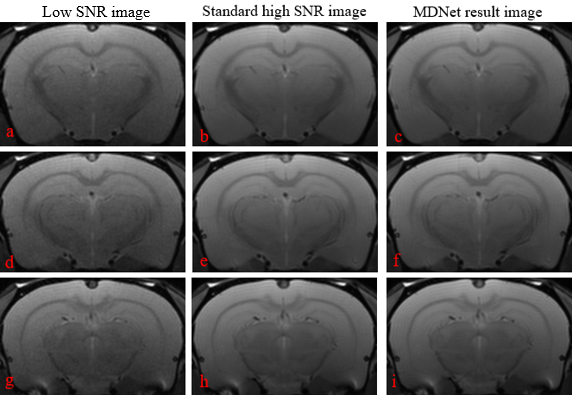
We compare the SSIM of low SNR(SNR=30~35) and standard high-SNR images(SNR=80~90) and confirm the SSIM index before denoising. As shown in Fig.2., (a), (b) and (d), (e) and (g), and (h) respectively show that the SSIM results of the three slices before denoising are 0.9004, 0.8913, and 0.8904. After denoising by the MDNet shown in c, f, i. The SSIM of the standard high-SNR image is 0.9836, 0.9842, 0.9803, respectively. The comparison shows that the denoised images are similar to standard high-SNR images, and the denoising effect is significant.We also performed statistic calculations of pixel values on B-Null and focused on the noise distribution. Among the distribution lines, the standard deviation for low-SNR images is much larger than for standard high-SNR images. The noise standard deviation result of high SNR and MDNet results are similar at 14.49 and 14.22, respectively. Therefore, it’s proven that MDNet successfully achieved 3x SNR enhancement by denoising in the image domain.
DISCUSSION
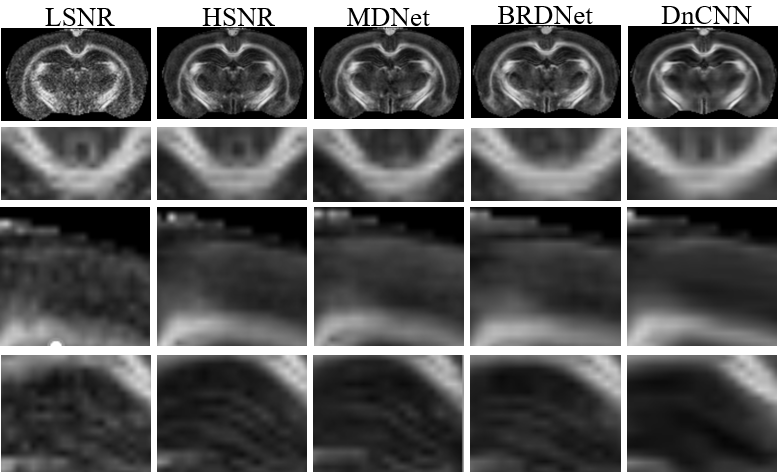
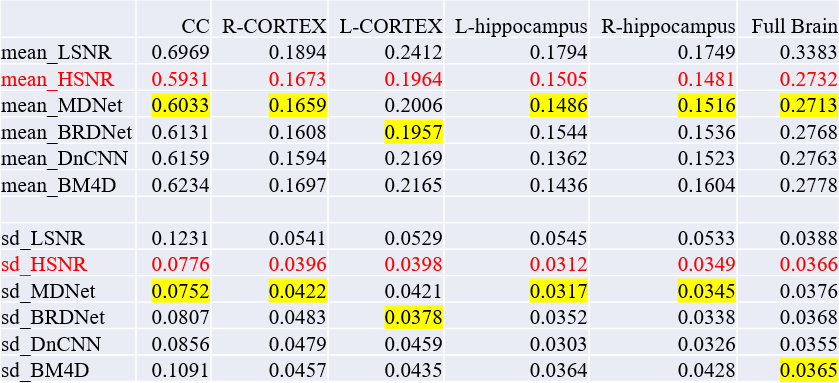
According to the analysis process of DTI is from B-Null to FA Map (as shown in Fig. 3 and Table 1) and finally to the neural tracking map (as shown in Fig. 4). It will be compared with the DnCNN model that was first proposed in 2017 for denoising topics and the BRDNet proposed in 2020. In addition to the above two, an additional BM4D, which is a traditional adaptive filter, is added to prove that the neural network can have better results.CONCLUSION
We proposed a new CNN denoising model called MDNet, which combines two different networks to enhance image denoising performance. ZDNet adopted DnCNN and an edge feature detection architecture. In addition, due to the problem of small batches, group normalization is used to make the model easier to train and improve denoising performance. According to the results, MDNet achieved 3x SNR enhancement for the DTI images while retaining the original information and shortening the scanning time by nine times, providing results comparable to other advanced image denoising methods.Acknowledgements
No acknowledgement found.References
1. Jespher L.R Andersson: ‘Maximum a posteriori estimation of diffusion tensor parameters using a Rician noise model: Why, how and but’, 2008,10, Pages 1340-1356
2. Dabov, K., Foi, A., Katkovnik, V., et al.: ‘Image denoising by sparse 3-D transform-domain collaborative filtering’, IEEE Trans. Image Process., 2007, 16, (8), pp. 2080–2095
3. K.Zhang, W.Zuo, Y.Chen.el: ‘Beyond a Gaussian Denoiser: Residual Learning of Deep CNN for Image Denoising’, IEEE Trans. Image Process. 2017, 7, pp. 3142-3155
4. Ronneberger, O., Fischer, P., Brox, T.: U-Net: convolutional networks for biomedical image segmentation. In: Navab, N., Hornegger, J., Wells, W.M., Frangi, A.F. (eds.) MICCAI 2015. LNCS, vol. 9351, pp. 234–241.
5. K. He, X. Zhang, S. Ren and J. Sun, "Deep residual learning for image recognition", Proc. IEEE Conf. Comput. Vis. Pattern Recognit., pp. 770-778, Jun. 2016.
6. Agarap, A. F.(2018). Deep learning using rectified linear units(relu). arXiv preprint arXiv:1803.08375.
7. Chen, G., Zhang, P., Wu, Y., Shen, D., & Yap, P. T.(2016). Denoising magnetic resonance images using collaborative non-local means. Neurocomputing, 177, 215-227.
8. Tian, C., Xu, Y., & Zuo, W.(2020). Image denoising using deep CNN with batch renormalization. Neural Networks, 121, 461-473.
9. Luo, W., Li, Y., Urtasun, R., & Zemel, R.(2016, December). Understanding the effective receptive field in deep convolutional neural networks. In Proceedings of the 30th International Conference on Neural Information Processing Systems(pp. 4905-4913).
10. Wu, Y., & He, K.(2018). Group normalization. In Proceedings of the European conference on computer vision(ECCV)(pp. 3-19).
11. Farrell, J. A., Landman, B. A., Jones, C. K., Smith, S. A., Prince, J. L., van Zijl, P. C., & Mori, S.(2007). Effects of SNR on the accuracy and reproducibility of DTI-derived fractional anisotropy, mean diffusivity, and principal eigenvector measurements at 1.5 T. Journal of magnetic resonance imaging:JMRI, 26(3), 756.
Figures