0943
Short- and long-term changes of ADC and rF% in patients with bone metastases from breast cancer1Division of Radiology, IEO European Institute of Oncology IRCCS, Milan, Italy, 2Degree course in Medical radiology, imaging and radiotherapy techniques, University of Milan, Milan, Italy, 3Precision Imaging and Research Unit, Department of Medical Imaging and Radiation Sciences, IEO European Institute of Oncology IRCCS, Milan, Italy, 4Department of Oncology and Hemato-Oncology, University of Milan, Milan, Italy
Synopsis
Evaluating short and long-term apparent diffusion coefficient (ADC) and relative fat fraction (rF%) changes could provide a better understanding of therapy response of bone metastases from breast cancer. Baseline ADC and rF% values computed from whole-body MRI, were compared with those measured at 12 and 36 week evaluations after treatment start. ADC and rF% significantly increased in responders at 12-weeks. At 36-weeks, ADC values range broadened, while rF% further increased. Short-term ADC and rF% changes are consistent with previous reports. Long-term changes highlight two patterns of response in which either high diffusion or fat repopulation prevail.
INTRODUCTION
Whole-body MRI (WB-MRI) is an established tool for therapy monitoring of bone marrow malignant lesions, given its ability to depict the morphological and functional changes.1,2 In published guidelines for response assessment of patients with advanced prostate cancer and myeloma, 3,4 the evaluation of apparent diffusion coefficient (ADC) and relative fat fraction (rF%) changes have a central role. Similar criteria may allow evaluation of metastatic breast cancer, however the use of WB-MRI in these patients is still limited.Published studies have focused on characterization of initial response of bone lesions.5 In the first months after therapy initiation, the processes of apoptosis and death of tumor cells lead to an initial increase of ADC values in responding bone lesions.6–8 The return of bone marrow fat in the site of bone lesion can lead to an increase of rF% values.9 However, long-term ADC and rF% changes have never been systematically assessed. A systematic evaluation of both short-term and long-term ADC and rF% changes in responding bone lesions could provide a better understanding of processes underlying therapy response of bone metastases and bone marrow healing.
MATERIALS AND METHODS
Patients enrolled in the prospective study RESPECT-MI, approved by the local ethics committee with the code IEO986, were considered for this analysis. The inclusion criteria of the RESPECT-MI study were histological diagnosis of breast cancer, single/multiple bone metastases, due to start a new line of systemic therapy, life expectancy over 6 months. Only patients who had performed at least the baseline and the 12 weeks evaluation WB-MRIs were considered in this analysis. All WB-MRI examinations were performed in one Institution at 1.5T or 3.0T.Up to 5 bone metastases per patient were selected on the baseline WB-MRI. For each selected lesion, the hyperintense area on diffusion-weighed images was contoured and then copied on the ADC map, low rF% areas of corresponding lesion locations were contoured separately. The contours were then transferred on the corresponding locations of the available follow-up examinations. Response classes were assigned on a per-lesion basis: each lesion was classified as responding, stable or progressing by the radiologist reporting the 12 weeks evaluation.
Considering all included patients, ADC and rF% values of bone metastases at baseline and at the 12 weeks evaluation were compared, stratifying analyses by response class. For responding lesions, changes between baseline values and those measured at 36 weeks was also assessed. Statistical significance was tested using Wilcoxon test.
RESULTS
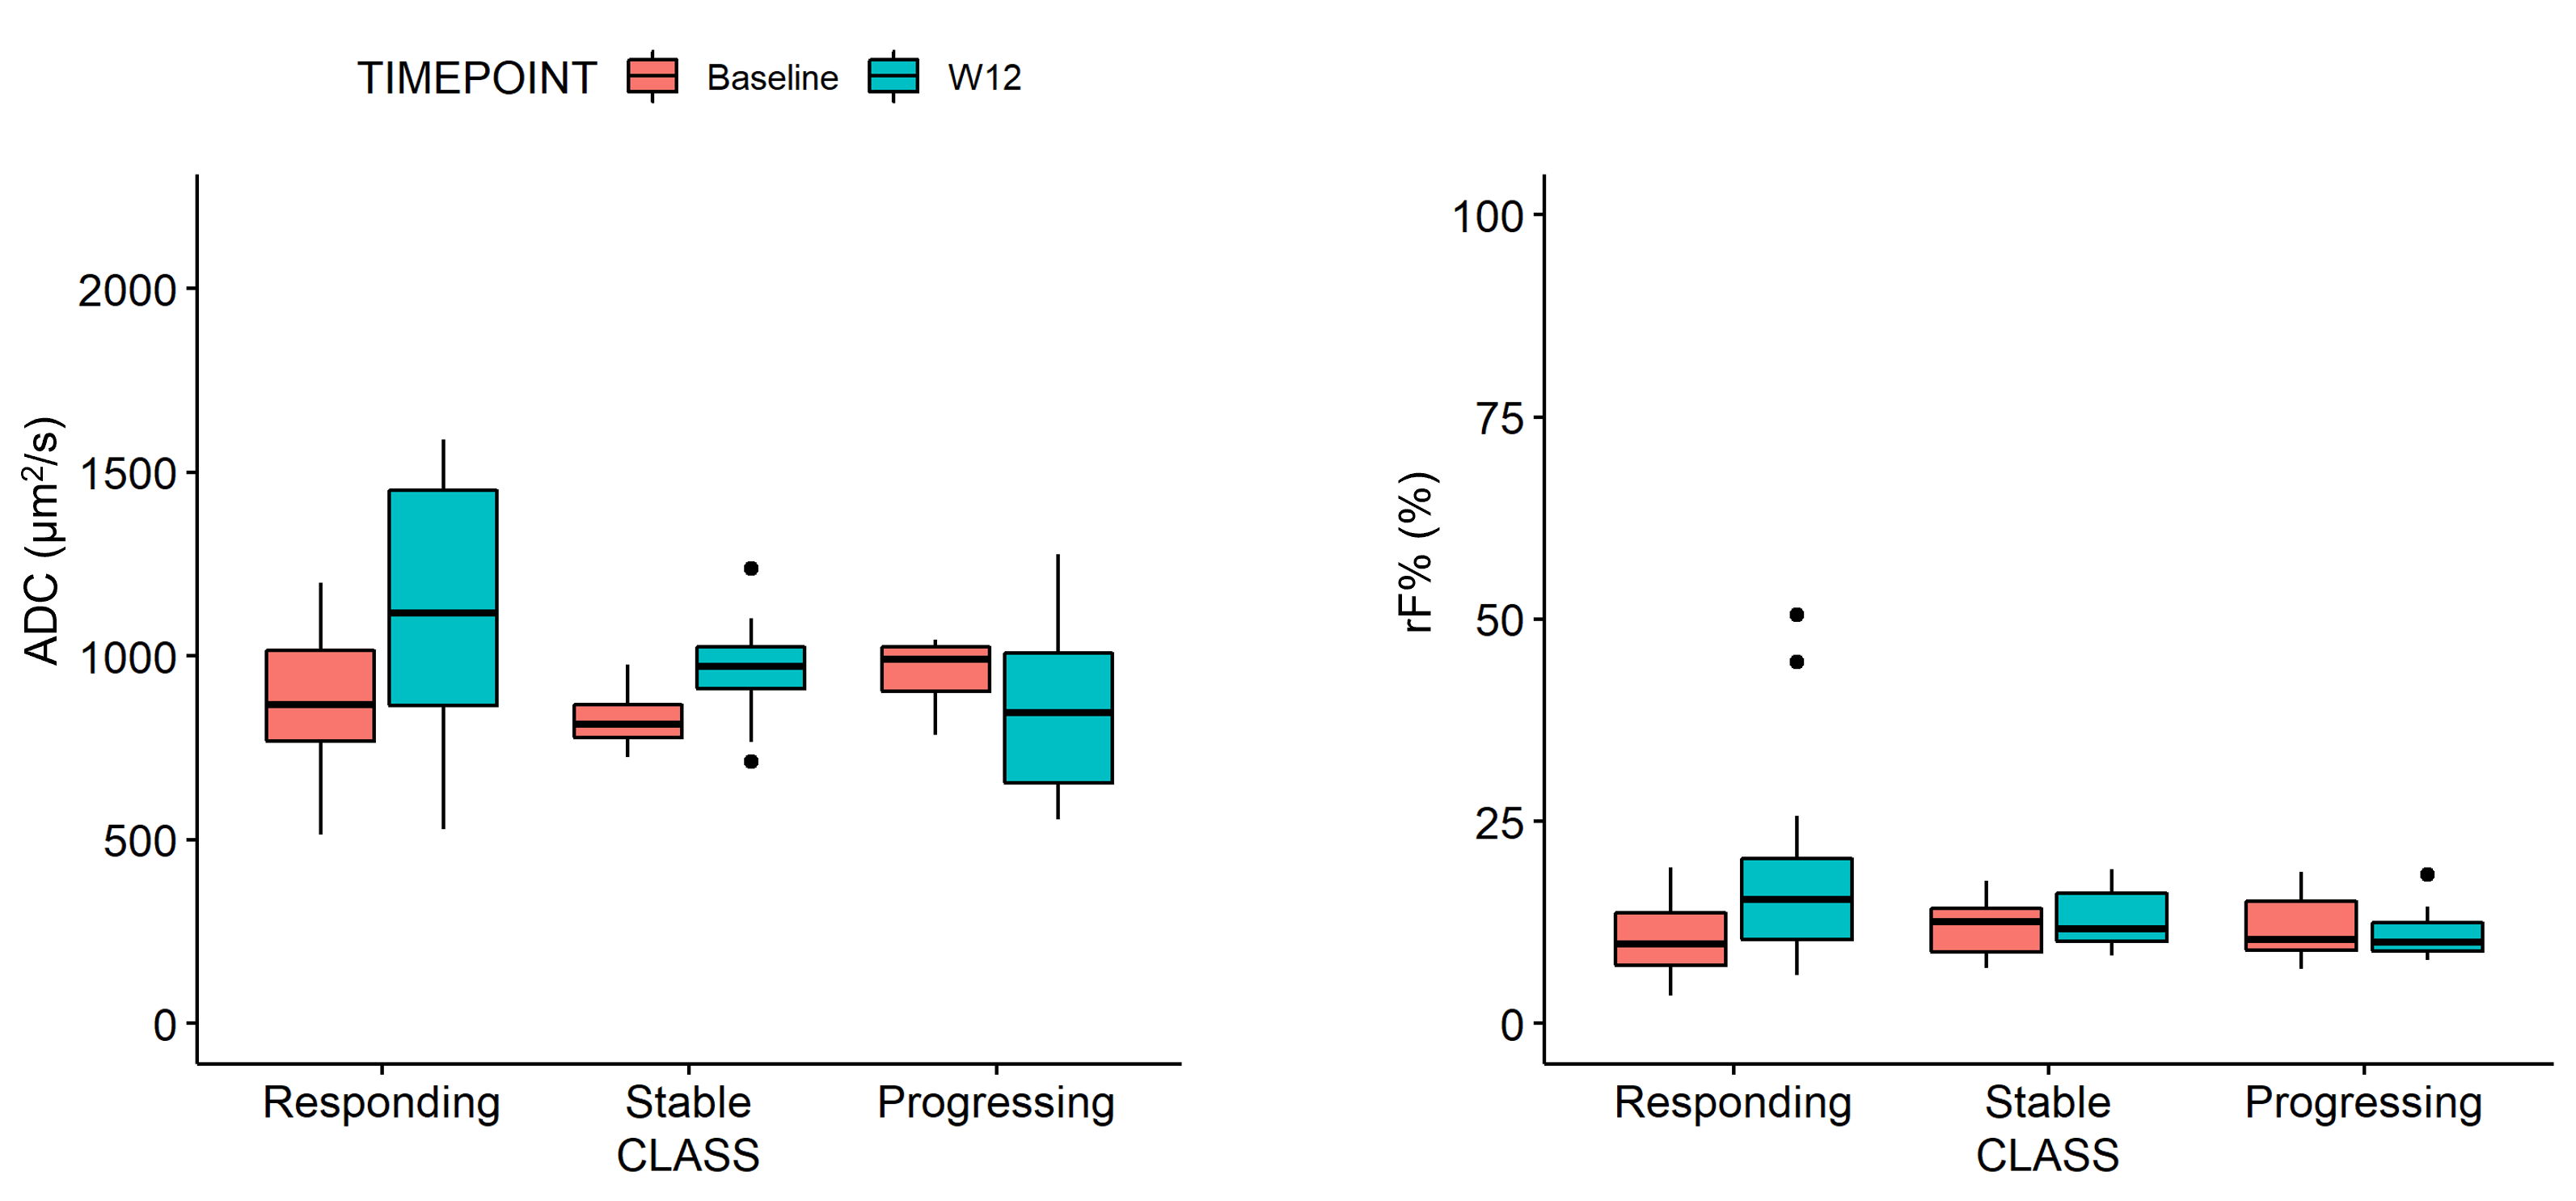
Of 18 patients enrolled in the RESPECT-MI study, 4 were excluded because they had performed only one WB-MRI examination. Therefore, 14 patients (mean age: 56y, range: 31-81y) were included in this analysis. A total of 47 bone metastases were contoured, of whom 29 (61.7%), 11 (23.4%) and 7 (14.9%) were classified as responding, stable and progressing, respectively.Both ADC and rF% values – median (interquartile range)- significantly increased in responding bone metastases from, respectively, 867 (768-1015) µm2/s and 9.8 (7.2-13.6)% at baseline to 1116 (866-1451) µm2/s and 15.3 (10.4-20.4)% at the 12 weeks evaluation (both p<0.001). ADC values slightly increased also in stable metastases (p=0.030), but not in progressing ones (p=0.447). No significant changes of rF% values were observed in the first 12 weeks in stable and progressing patients (p>0.447).
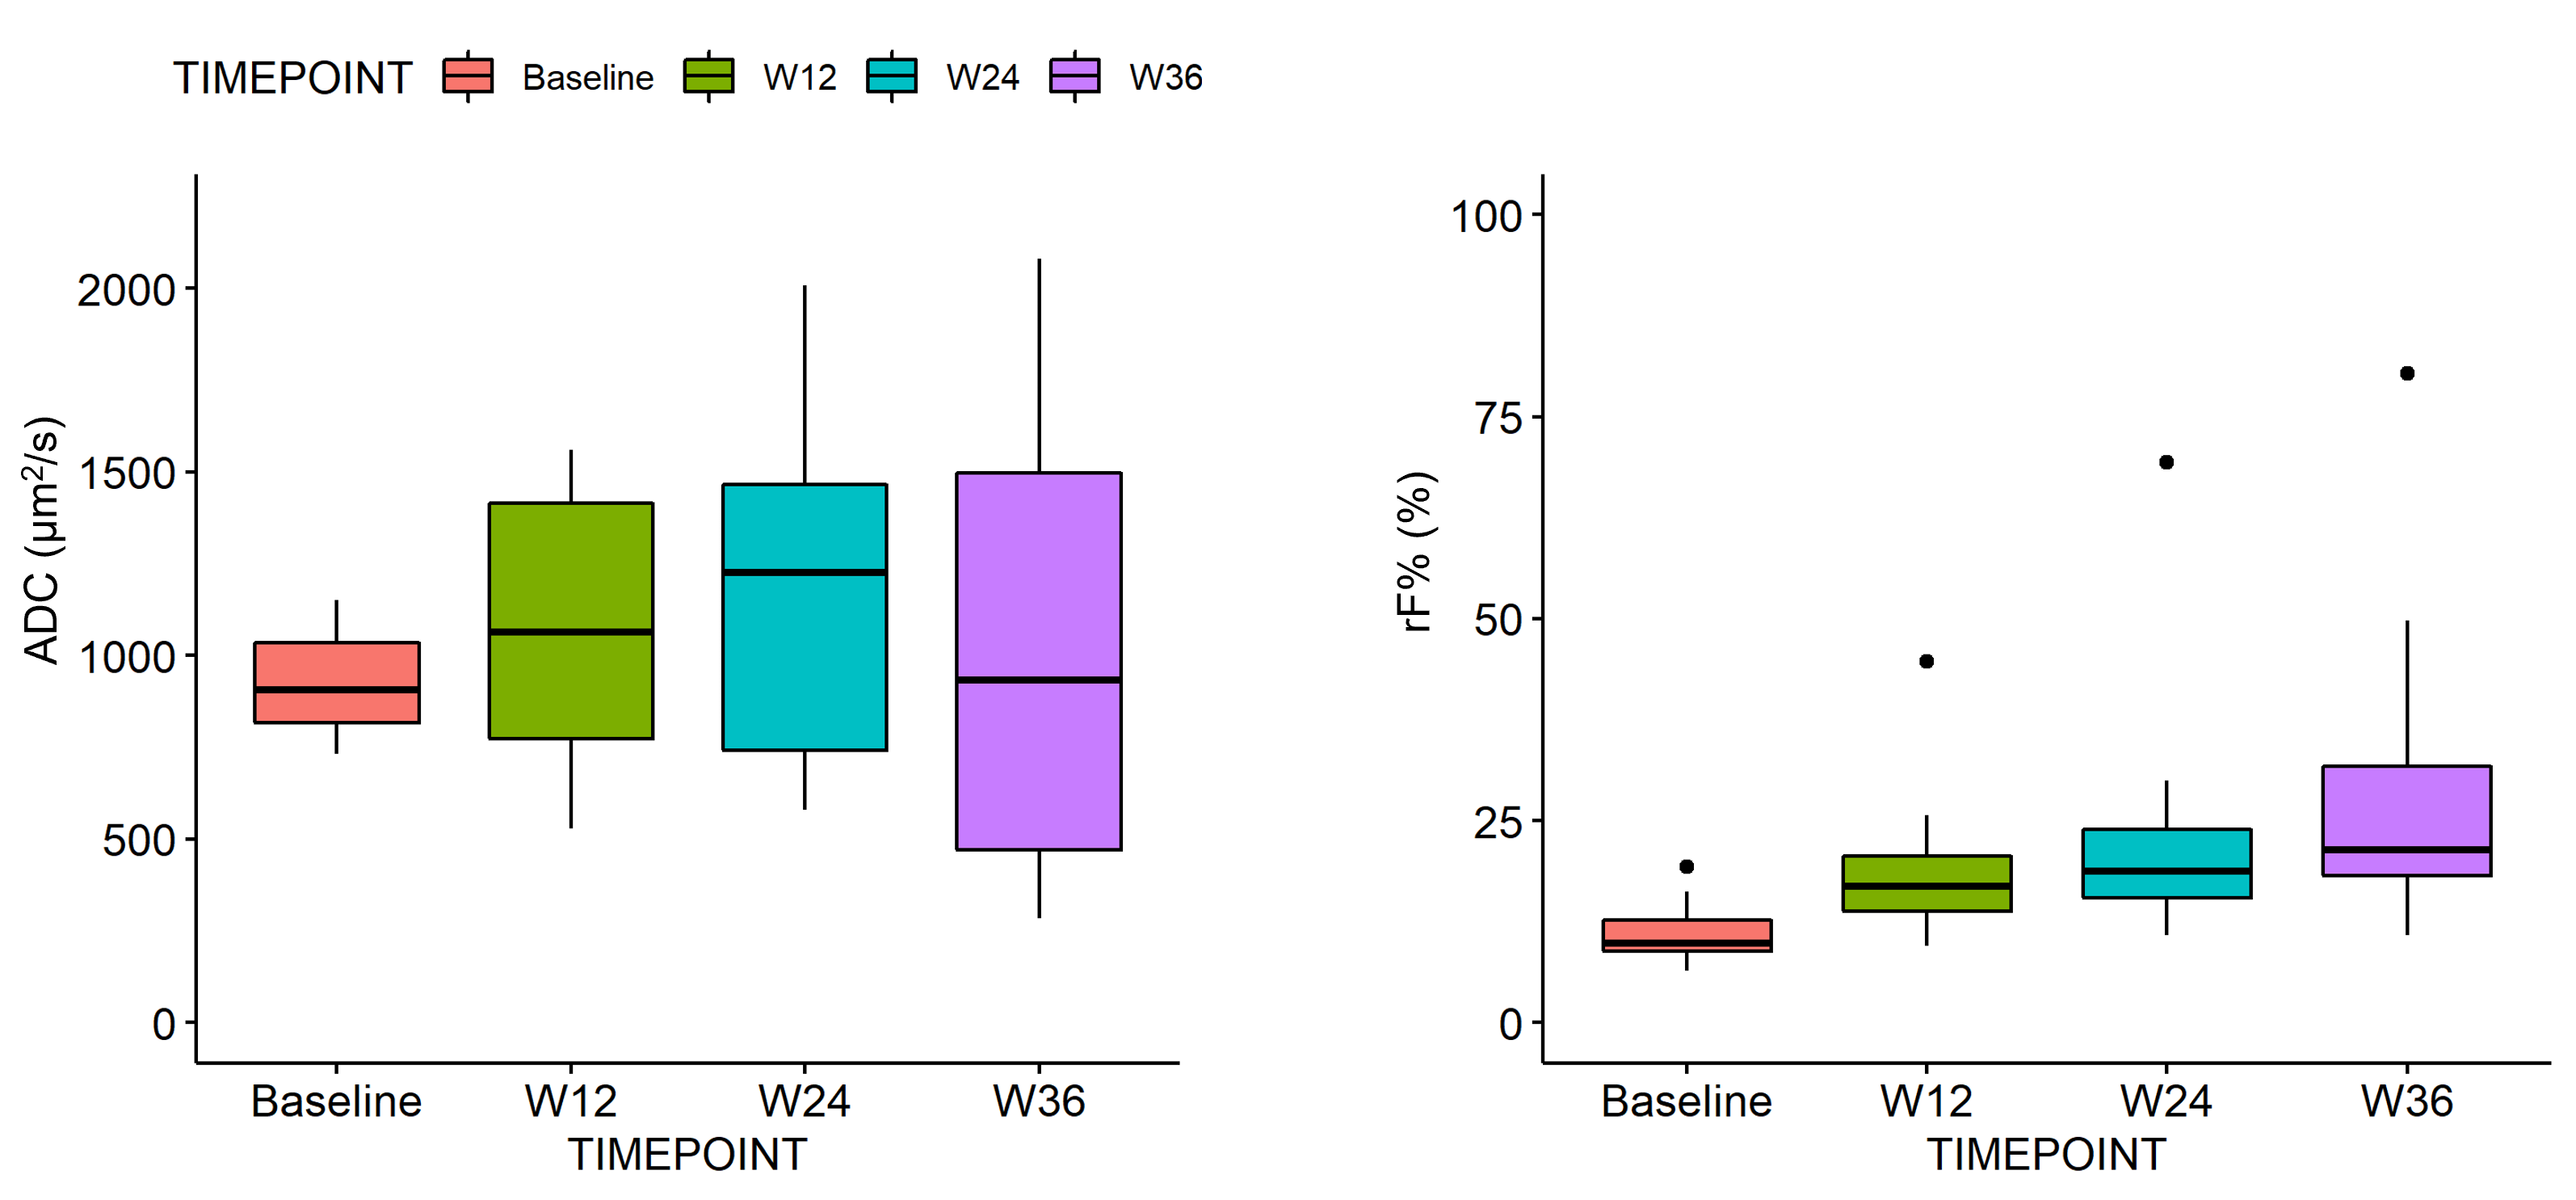
Only 5 patients continued the study up to the 36 weeks evaluation. In the remaining 15 bone metastases, ADC values measured at week 36 broadened to 934 (469-1497) µm2/s and were not significantly different from baseline (p=0629), while rF% values significantly increased to 21.4 (18.2-31.8)% (p<0.001).
DISCUSSION
The 12-weeks changes of ADC values observed in this analysis are consistent with the literature on multiple myeloma and bone metastases from prostate cancer.6–8 Specifically, increasing ADC in responding bone metastases have been documented previously and is associated with processes of cell death and apoptosis.Visually assessed fat repopulation in the site of treated bone lesions is a radiologic sign of response, 3,4 but literature on quantitative assessment of rF% changes for response assessment is poor. Only few reports shows that rF% increases can be observed already within 3 months after therapy initiation in multiple myeloma focal lesions, 9,10 consistently with our observation.
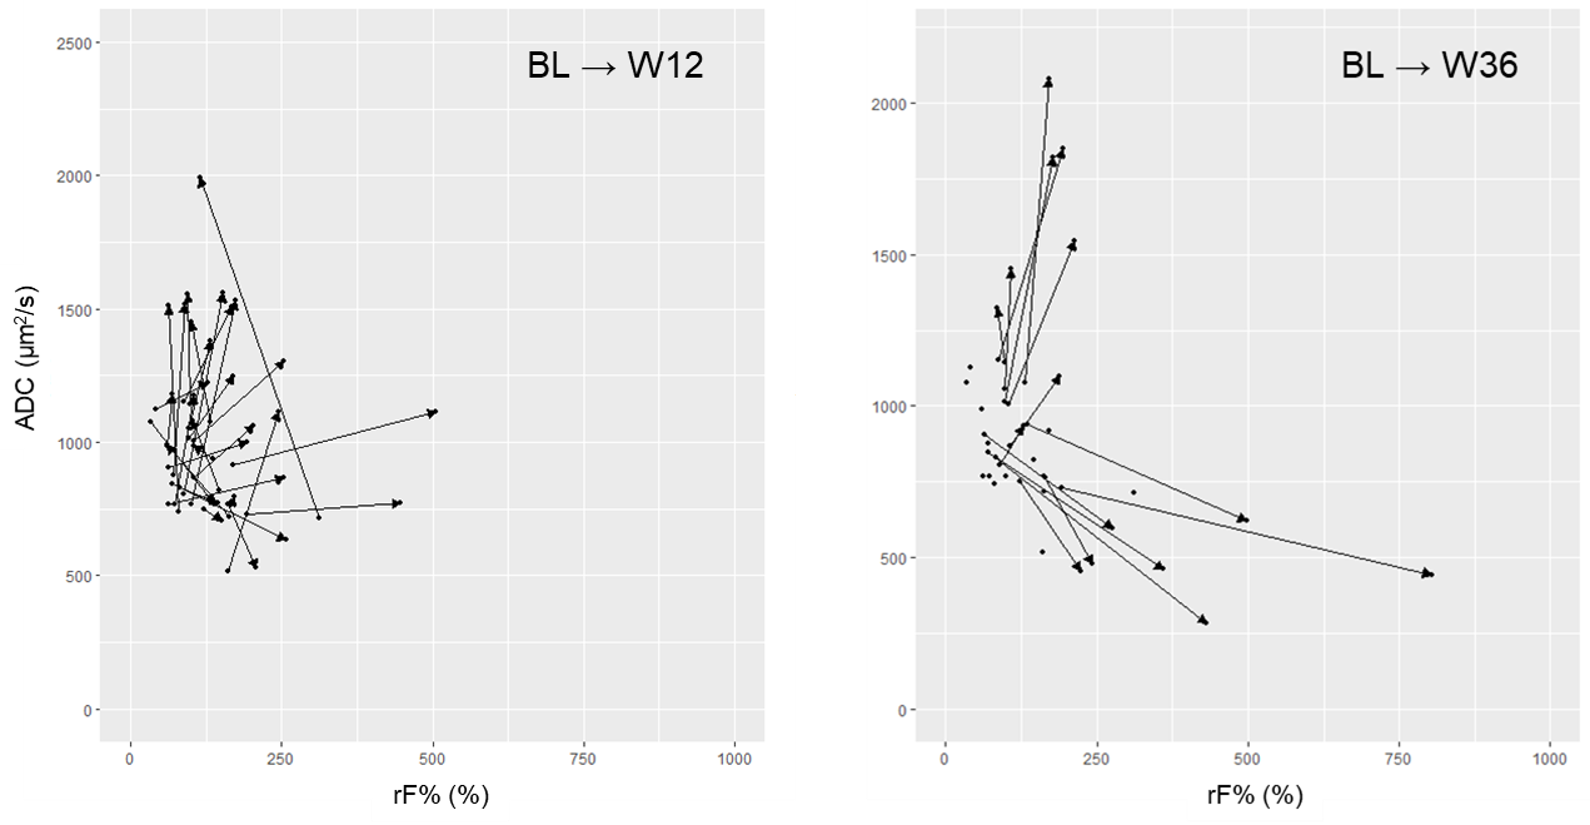
ADC values in the site of treated responding metastases spread across a wide range of values at the 36-week evaluation. This could be explained by assuming that in some lesions a necrotic/inflammatory component with high ADC is predominant, while in other lesions fat repopulation prevails, reducing water content and water diffusion, as in normal bone marrow. 11,12
As the RESPECT-MI study progresses, a wider cohort of patients treated with different therapies (e.g., cytotoxic agents, hormone therapies) could be included in this analysis to test their association with these patterns of response.
CONCLUSION
In this study we described the short- and long- term ADC and rF% changes occurring in bone metastases from breast cancer during treatment. Changes observed within 12-weeks from therapy initiation are consistent with the literature and support the adoption of WB-MRI for therapy monitoring also in patients with metastases from breast cancer. At 36-weeks from therapy initiation we observed two different response patterns characterized by a prevalence of high diffusion component or fat repopulation.Acknowledgements
-References
1. Summers P, Saia G, Colombo A, et al. Whole-body magnetic resonance imaging: technique, guidelines and key applications. Ecancermedicalscience. 2021;15(1164).
2. Padhani AR, Makris A, Gall P, Collins DJ, Tunariu N, De Bono JS. Therapy monitoring of skeletal metastases with whole-body diffusion MRI. J Magn Reson Imaging. 2014;39(5):1049-1078.
3. Messiou C, Hillengass J, Delorme S, et al. Guidelines for Acquisition, Interpretation, and Reporting of Whole-Body MRI in Myeloma: Myeloma Response Assessment and Diagnosis System (MY-RADS). Radiology. 2019;291(1):5-13.
4. Padhani AR, Lecouvet FE, Tunariu N, et al. METastasis Reporting and Data System for Prostate Cancer: Practical Guidelines for Acquisition, Interpretation, and Reporting of Whole-body Magnetic Resonance Imaging-based Evaluations of Multiorgan Involvement in Advanced Prostate Cancer. Eur Urol. 2017;71(1):81-92.
5. Donners R, Blackledge M, Tunariu N, Messiou C, Merkle EM, Koh D-M. Quantitative Whole-Body Diffusion-Weighted MR Imaging. Magn Reson Imaging Clin N Am. 2018;26(4):479-494.
6. Perez-Lopez R, Mateo J, Mossop H, et al. Diffusion-weighted imaging as a treatment response biomarker for evaluating bone metastases in prostate cancer: A pilot study. Radiology. 2017;283(1):168-177.
7. Blackledge MD, Collins DJ, Tunariu N, et al. Assessment of Treatment Response by Total Tumor Volume and Global Apparent Diffusion Coefficient Using Diffusion-Weighted MRI in Patients with Metastatic Bone Disease: A Feasibility Study. Najbauer J, ed. PLoS One. 2014;9(4):e91779.
8. Reischauer C, Froehlich JM, Koh DM, et al. Bone metastases from prostate cancer: Assessing treatment response by using diffusion-weighted imaging and functional diffusion maps - Initial observations. Radiology. 2010;257(2):523-531.
9. Latifoltojar A, Hall-Craggs M, Bainbridge A, et al. Whole-body MRI quantitative biomarkers are associated significantly with treatment response in patients with newly diagnosed symptomatic multiple myeloma following bortezomib induction. Eur Radiol. 2017;27(12):5325-5336.
10. Latifoltojar A, Hall-Craggs M, Rabin N, et al. Whole body magnetic resonance imaging in newly diagnosed multiple myeloma: early changes in lesional signal fat fraction predict disease response. Br J Haematol. 2017;176(2):222-233.
11. Colombo A, Bombelli L, Summers PE, et al. Effects of Sex and Age on Fat Fraction, Diffusion-Weighted Image Signal Intensity and Apparent Diffusion Coefficient in the Bone Marrow of Asymptomatic Individuals: A Cross-Sectional Whole-Body MRI Study. Diagnostics. 2021;11(5):913.
12. Nonomura Y, Yasumoto M, Yoshimura R, et al. Relationship between bone marrow cellularity and apparent diffusion coefficient. J Magn Reson Imaging. 2001;13(5):757-760.
Figures