0942
Intravoxel incoherent motion improves diffusion-weighted imaging in detection of response towards neoadjuvant chemotherapy in breast cancer1Institute of Medical Sciences, University of Aberdeen, Aberdeen, United Kingdom, 2Oncology Department, Aberdeen Royal Infirmary, Aberdeen, United Kingdom, 3Radiology Department, Royal Marsden Hospital, London, United Kingdom, 4Pathology Department, Aberdeen Royal Infirmary, Aberdeen, United Kingdom, 5Breast Unit, Aberdeen Royal Infirmary, Aberdeen, United Kingdom
Synopsis
Breast cancer is a major and expanding health challenge, and neoadjuvant chemotherapy (NACT) is increasingly prescribed to facilitate breast surgery in advanced breast cancer with an ongoing demand for improved imaging methods accurately reflecting disease load. Tissue perfusion, a sensitive marker of cancer metabolism, can be derived from intravoxel incoherent motion (IVIM) model, and recent Bayesian algorithm yields improved sensitivity and precision in breast cancer by us and pancreatic cancer. We therefore hypothesise that IVIM model powered by Bayesian algorithm is able to detect early treatment-induced changes in tumour perfusion and diffusion, with the potential to impact patient care pathway.
Introduction
Breast cancer is currently the most common cancer in women, contributing to 1 in every 4 female cancer1. For inoperable cancer, neoadjuvant chemotherapy (NACT) has been established and increasingly prescribed to facilitate breast surgery2 and improve survival3. Patients, without achieving a pathologic complete response (pCR), were reported to have a lower disease-free survival rate than patients with pCR4, and may suffer from unnecessary cytotoxic chemotherapy and delay in breast surgery5. Non-invasive imaging markers, sensitive to underlying tumour metabolism and hence disease load, for the early identification and prediction of patients without pCR is crucial for a response-guided NACT6. Intravoxel incoherent motion (IVIM) model, coupled with Bayesian probability-based algorithm, has demonstrated a higher precision and accuracy in the estimation of blood microcirculation (f), tissue diffusion (D) and perfusion (D*) by us in breast cancer and by others in pancreatic cancer7, 8. We therefore hypothesise Bayesian IVIM model has significant prognostic value in breast cancer patients undergoing NACT.Methods
Seventeen patients (age 46 – 58 years) with invasive ductal carcinoma of the breast participated in the clinical trial (Figure 1). Only patients undergoing NACT, with a tumour size larger than 2 cm on ultrasound were eligible. Women on hormone replacement therapy, having previous breast malignancy and family history of breast cancer were not eligible. Miller-Payne system was used to assess pathologic complete response for good responder9. The study was approved by the London Research Ethics Committee (Identifier: 17/LO/1777), and written informed consent was obtained from all the participants prior to the study.Image Acquisition
All data were acquired on a 3 T whole body clinical MRI scanner (Achieva TX, Philips Healthcare, Best, Netherlands). IVIM images were acquired using pulsed gradient spin echo sequence at 10 b-values (0, 30, 60, 90, 120, 250, 400, 600, 800, 1000 s/mm2)10, with field of view 240 mm × 200 mm × 90 mm, voxel size 2.5 mm × 2.5 mm, slice thickness 5 mm, repetition time 2400 ms and echo time 50 ms.
Image Analysis
The region-of-interests (ROIs) were manually drawn on IVIM image (b = 1000 s/mm2) using ImageJ (v1.58k, NIH, Bethesda, MD, USA), inside the tumour edge and avoiding necrotic, haemorrhagic and cystic areas. Data analysis was performed in MATLAB (R2020a, Mathworks, Natrick, MA, USA). Bayesian probability-based fitting was performed according to a published function11. The median and skewness of IVIM-derived parameters (fmedian, fskewness, Dmedian, Dskewness, D*median, and D*skewness) were calculated12. Percentage change in IVIM-derived parameters was calculated as: [Early-NACT/Mid-NACT – Pre-NACT] / Pre-NACT × 100(%).
Statistical Analysis
Statistical analysis was performed in the R software (v3.6.3, R Foundation for Statistical Computing, Vienna, Austria). The differences between IVIM-derived parameters at four stages of NACT were compared using Wilcoxon signed rank paired test. The differences in percentage change of IVIM-derived parameters between good and poor responders were compared using Wilcoxon signed rank test. A p value < 0.05 was considered statistically significant.
Results
Pre-NACT vs Early-NACTEarly-NACT Dmedian was significantly higher (p=0.003) than Pre-NACT, while Early-NACT Dskewness was significantly lower (p<0.001) than Pre-NACT (Table 1, Figures 2a and 2b). There were no significant differences in f and D* between Pre-NACT and Early-NACT.
Pre-NACT vs Mid-NACT
Mid-NACT Dskewness was significantly lower (p=0.010) than Pre-NACT (Table 1, Figure 2c). There were no significant differences in Dmedian, f and D* between Pre-NACT and Mid-NACT.
Early-NACT vs Post-NACT
Post-NACT fmedian was significantly lower (p=0.010) than Early-NACT (Table 1, Figure 2d). There were no significant differences in fskewness, D and D* between Early-NACT and Post-NACT.
Pre-NACT vs Post-NACT
Post-NACT Dmedian was significantly higher (p=0.032) than Pre-NACT, while Post-NACT Dskewness and D*median were significantly lower (p<0.001 and p=0.019 respectively) than Pre-NACT (Table 1, Figures 2e-g). There were no significant differences in f and D*skewness between Pre-NACT and Post-NACT.
Good Responder vs Poor Responder
There was a significant difference in percentage change in fmedian (p=0.042), with a decrease in good responders while an increase in poor responders between Pre-NACT and Early-NACT (Table 2, Figure 3). A significant difference in fmedian (p=0.046) and the same direction of change was observed between Pre-NACT and Mid-NACT. There were no significant differences in fskewness, D and D* between good and poor responders.
Discussion
An increase in D was the most prominent change among the three parameters. The reduction in tissue cellularity leads to an increase in water mobility in the residual tumour, and Bayesian IVIM model yielded an effective assessment of D in the evaluation of the magnitude of water diffusion from the cytotoxic effect of NACT. Significant differences were also found in perfusion parameters f and D*, however only after the completion of NACT. The result suggested the treatment-induced change was more likely to be dominated by the cellular rather than the vascular component in breast tumours within an individual patient. However, percentage change in f might be useful in differentiation of responder groups while D* might be limited to assessment of late response to NACT.Conclusion
Tumour tissue diffusion D can be a sensitive biomarker of NACT to improve treatment plan, avoid side effects and expedite alternative treatments in breast cancer.Acknowledgements
The authors would like to thank Dr Matthew Clemence, Philips Healthcare Clinical Science, UK, for clinical scientist support, Ms Erica Banks and Ms Alison McKay for patient recruitment support, Ms Teresa Morris and Ms Dawn Younie for logistics support, Ms Beverly McLennan, Ms Nichola Crouch, Ms Laura Reid, Mr Mike Hendry for radiographer support, and Dr. Gordon Urquhart for providing access to the patients. This project was jointly funded by Friends of Aberdeen and North Centre for Haematology, Oncology and Radiotherapy (ANCHOR), NHS Grampian Endowment Research Fund and Tenovus Scotland.References
1. Bray F, Ferlay J, Soerjomataram I, Siegel RL, Torre LA, Jemal A. Global cancer statistics 2018: GLOBOCAN estimates of incidence and mortality worldwide for 36 cancers in 185 countries. CA Cancer J Clin. 2018;68(6):394-424.
2. Santa-Maria CA, Camp M, Cimino-Mathews A, Harvey S, Wright J, Stearns V. Neoadjuvant Therapy for Early-Stage Breast Cancer: Current Practice, Controversies, and Future Directions. Oncology (Williston Park). 2015;29(11):828-38.
3. Kim MM, Allen P, Gonzalez-Angulo AM, et al. Pathologic complete response to neoadjuvant chemotherapy with trastuzumab predicts for improved survival in women with HER2-overexpressing breast cancer. Ann Oncol. 2013;24(8):1999-2004.
4. von Minckwitz G, Untch M, Blohmer JU, et al. Definition and impact of pathologic complete response on prognosis after neoadjuvant chemotherapy in various intrinsic breast cancer subtypes. J Clin Oncol. 2012;30(15):1796-804.
5. Bagegni NA, Tao Y, Ademuyiwa FO. Clinical outcomes with neoadjuvant versus adjuvant chemotherapy for triple negative breast cancer: A report from the National Cancer Database. PLoS One. 2019;14(9):e0222358.
6. von Minckwitz G, Blohmer JU, Costa SD, et al. Response-Guided Neoadjuvant Chemotherapy for Breast Cancer. JCO. 2013;31(29):3623-30.
7. Barbieri S, Donati OF, Froehlich JM, Thoeny HC. Impact of the calculation algorithm on biexponential fitting of diffusion-weighted MRI in upper abdominal organs. Magn Reson Med. 2016;75(5):2175-84.
8. Gurney-Champion OJ, Klaassen R, Froeling M, et al. Comparison of six fit algorithms for the intra-voxel incoherent motion model of diffusion-weighted magnetic resonance imaging data of pancreatic cancer patients. PLoS One. 2018;13(4):e0194590.
9. Ogston KN, Miller ID, Payne S, et al. A new histological grading system to assess response of breast cancers to primary chemotherapy: prognostic significance and survival. Breast. 2003;12(5):320-7.
10. Bedair R, Priest AN, Patterson AJ, et al. Assessment of early treatment response to neoadjuvant chemotherapy in breast cancer using non-mono-exponential diffusion models: a feasibility study comparing the baseline and mid-treatment MRI examinations. Eur Radiol. 2017;27(7):2726-36.
11. Jalnefjord O, Andersson M, Montelius M, et al. Comparison of methods for estimation of the intravoxel incoherent motion (IVIM) diffusion coefficient (D) and perfusion fraction (f). MAGMA. 2018;31(6):715-23.
12. Kim Y, Kim SH, Lee HW, et al. Intravoxel incoherent motion diffusion-weighted MRI for predicting response to neoadjuvant chemotherapy in breast cancer. Magn Reson Imaging. 2018;48:27-33.
Figures
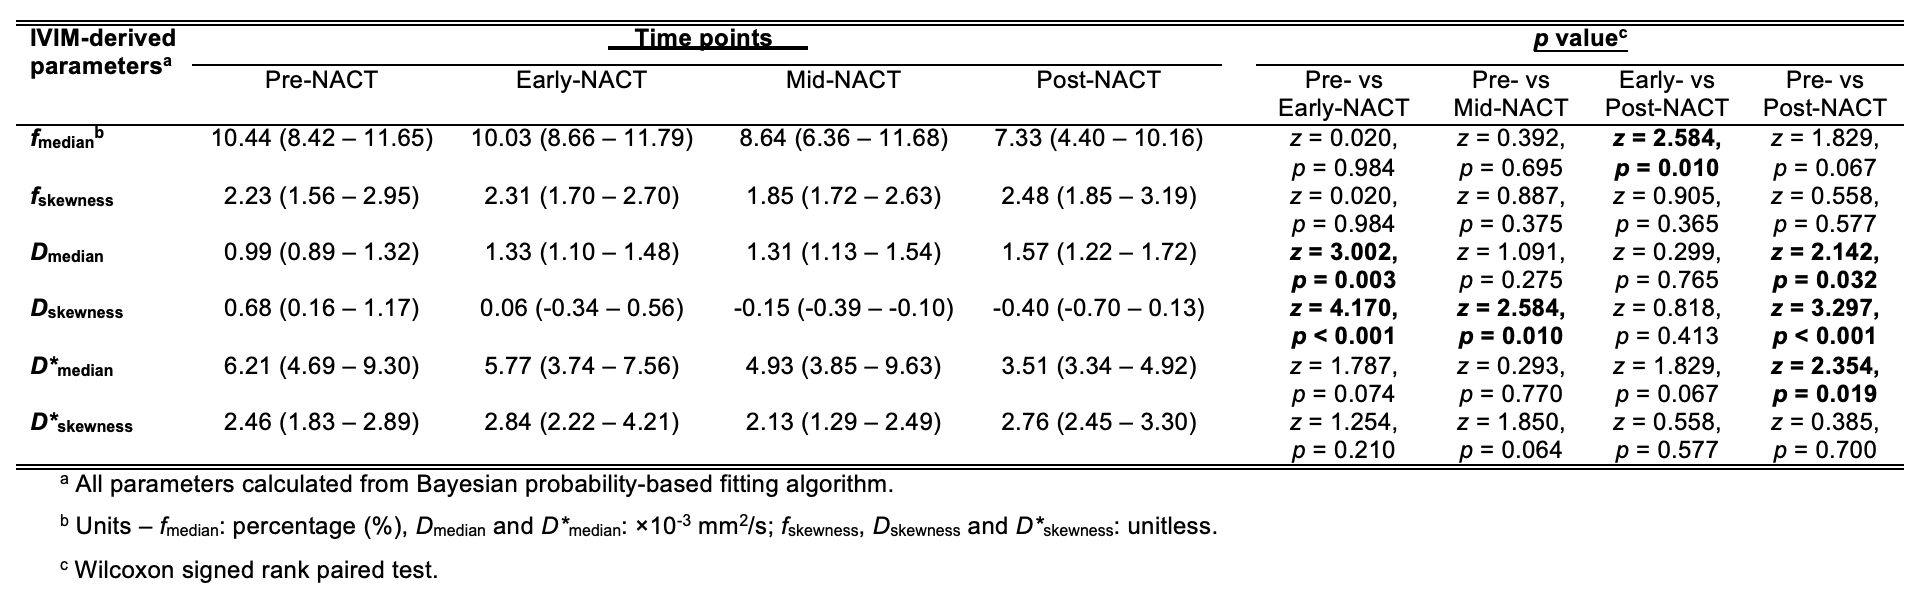
Table 1. Comparison of IVIM-derived parameters between Pre-NACT, Early-NACT, Mid-NACT and Post-NACT.
The perfusion fraction (f), apparent diffusivity (D) and pseudo-diffusivity (D*) in patients that completed Pre-NACT (n=17), Early-NACT (n=16), Mid-NACT (n=10) and Post-NACT (n=11) are shown. Values are presented as median and interquartile range (median (IQR)). Statistically significant differences (p < 0.05) are marked in bold.
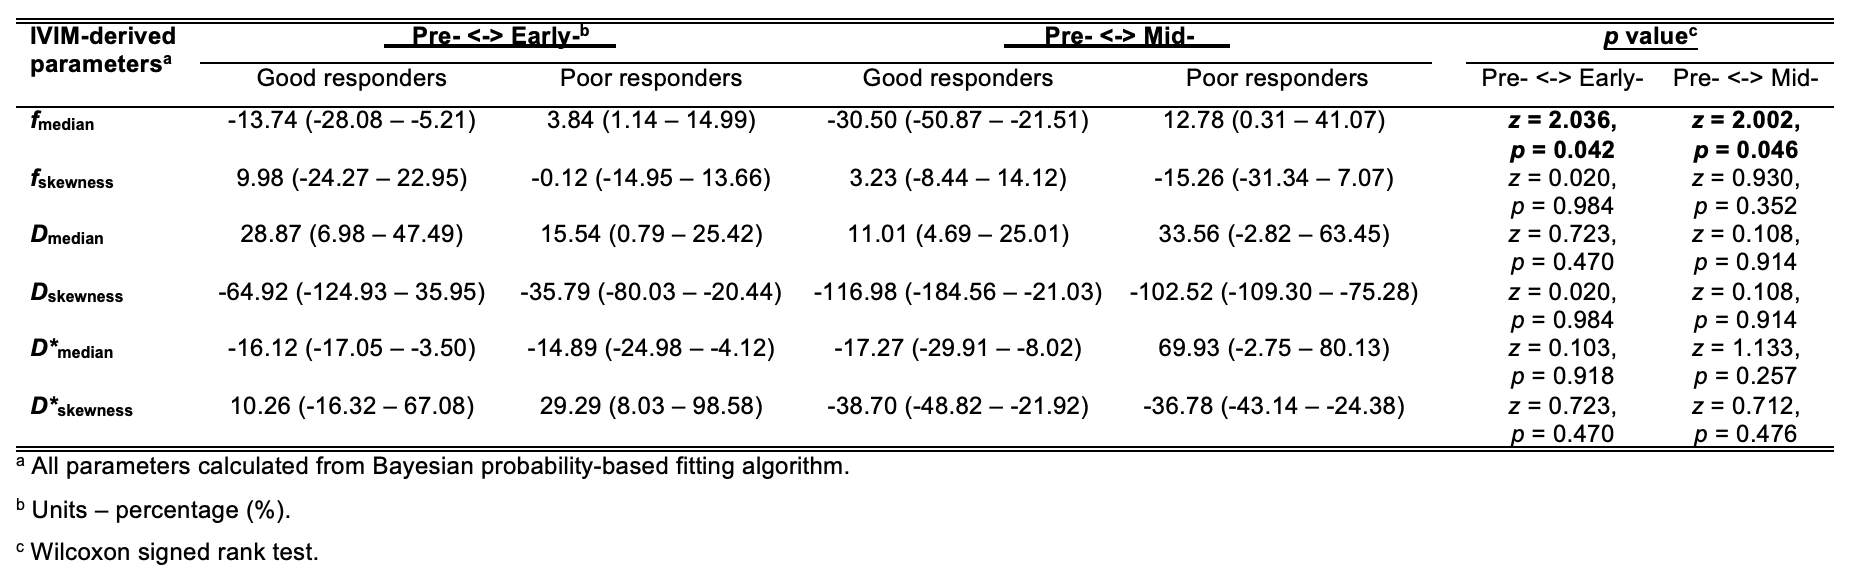
Table 2. Comparison of IVIM-derived parameters between two responder groups.
The percentage change in perfusion fraction (f), apparent diffusivity (D) and pseudo-diffusivity (D*) in good responders (n=8) and poor responders (n=9) (Miller-Payne pathological response grading system). Percentage change was calculated as (Early-NACT/Mid-NACT – Pre-NACT) / Pre-NACT. Values are presented as median and interquartile range (median (IQR)). Statistically significant differences (p < 0.05) are marked in bold.
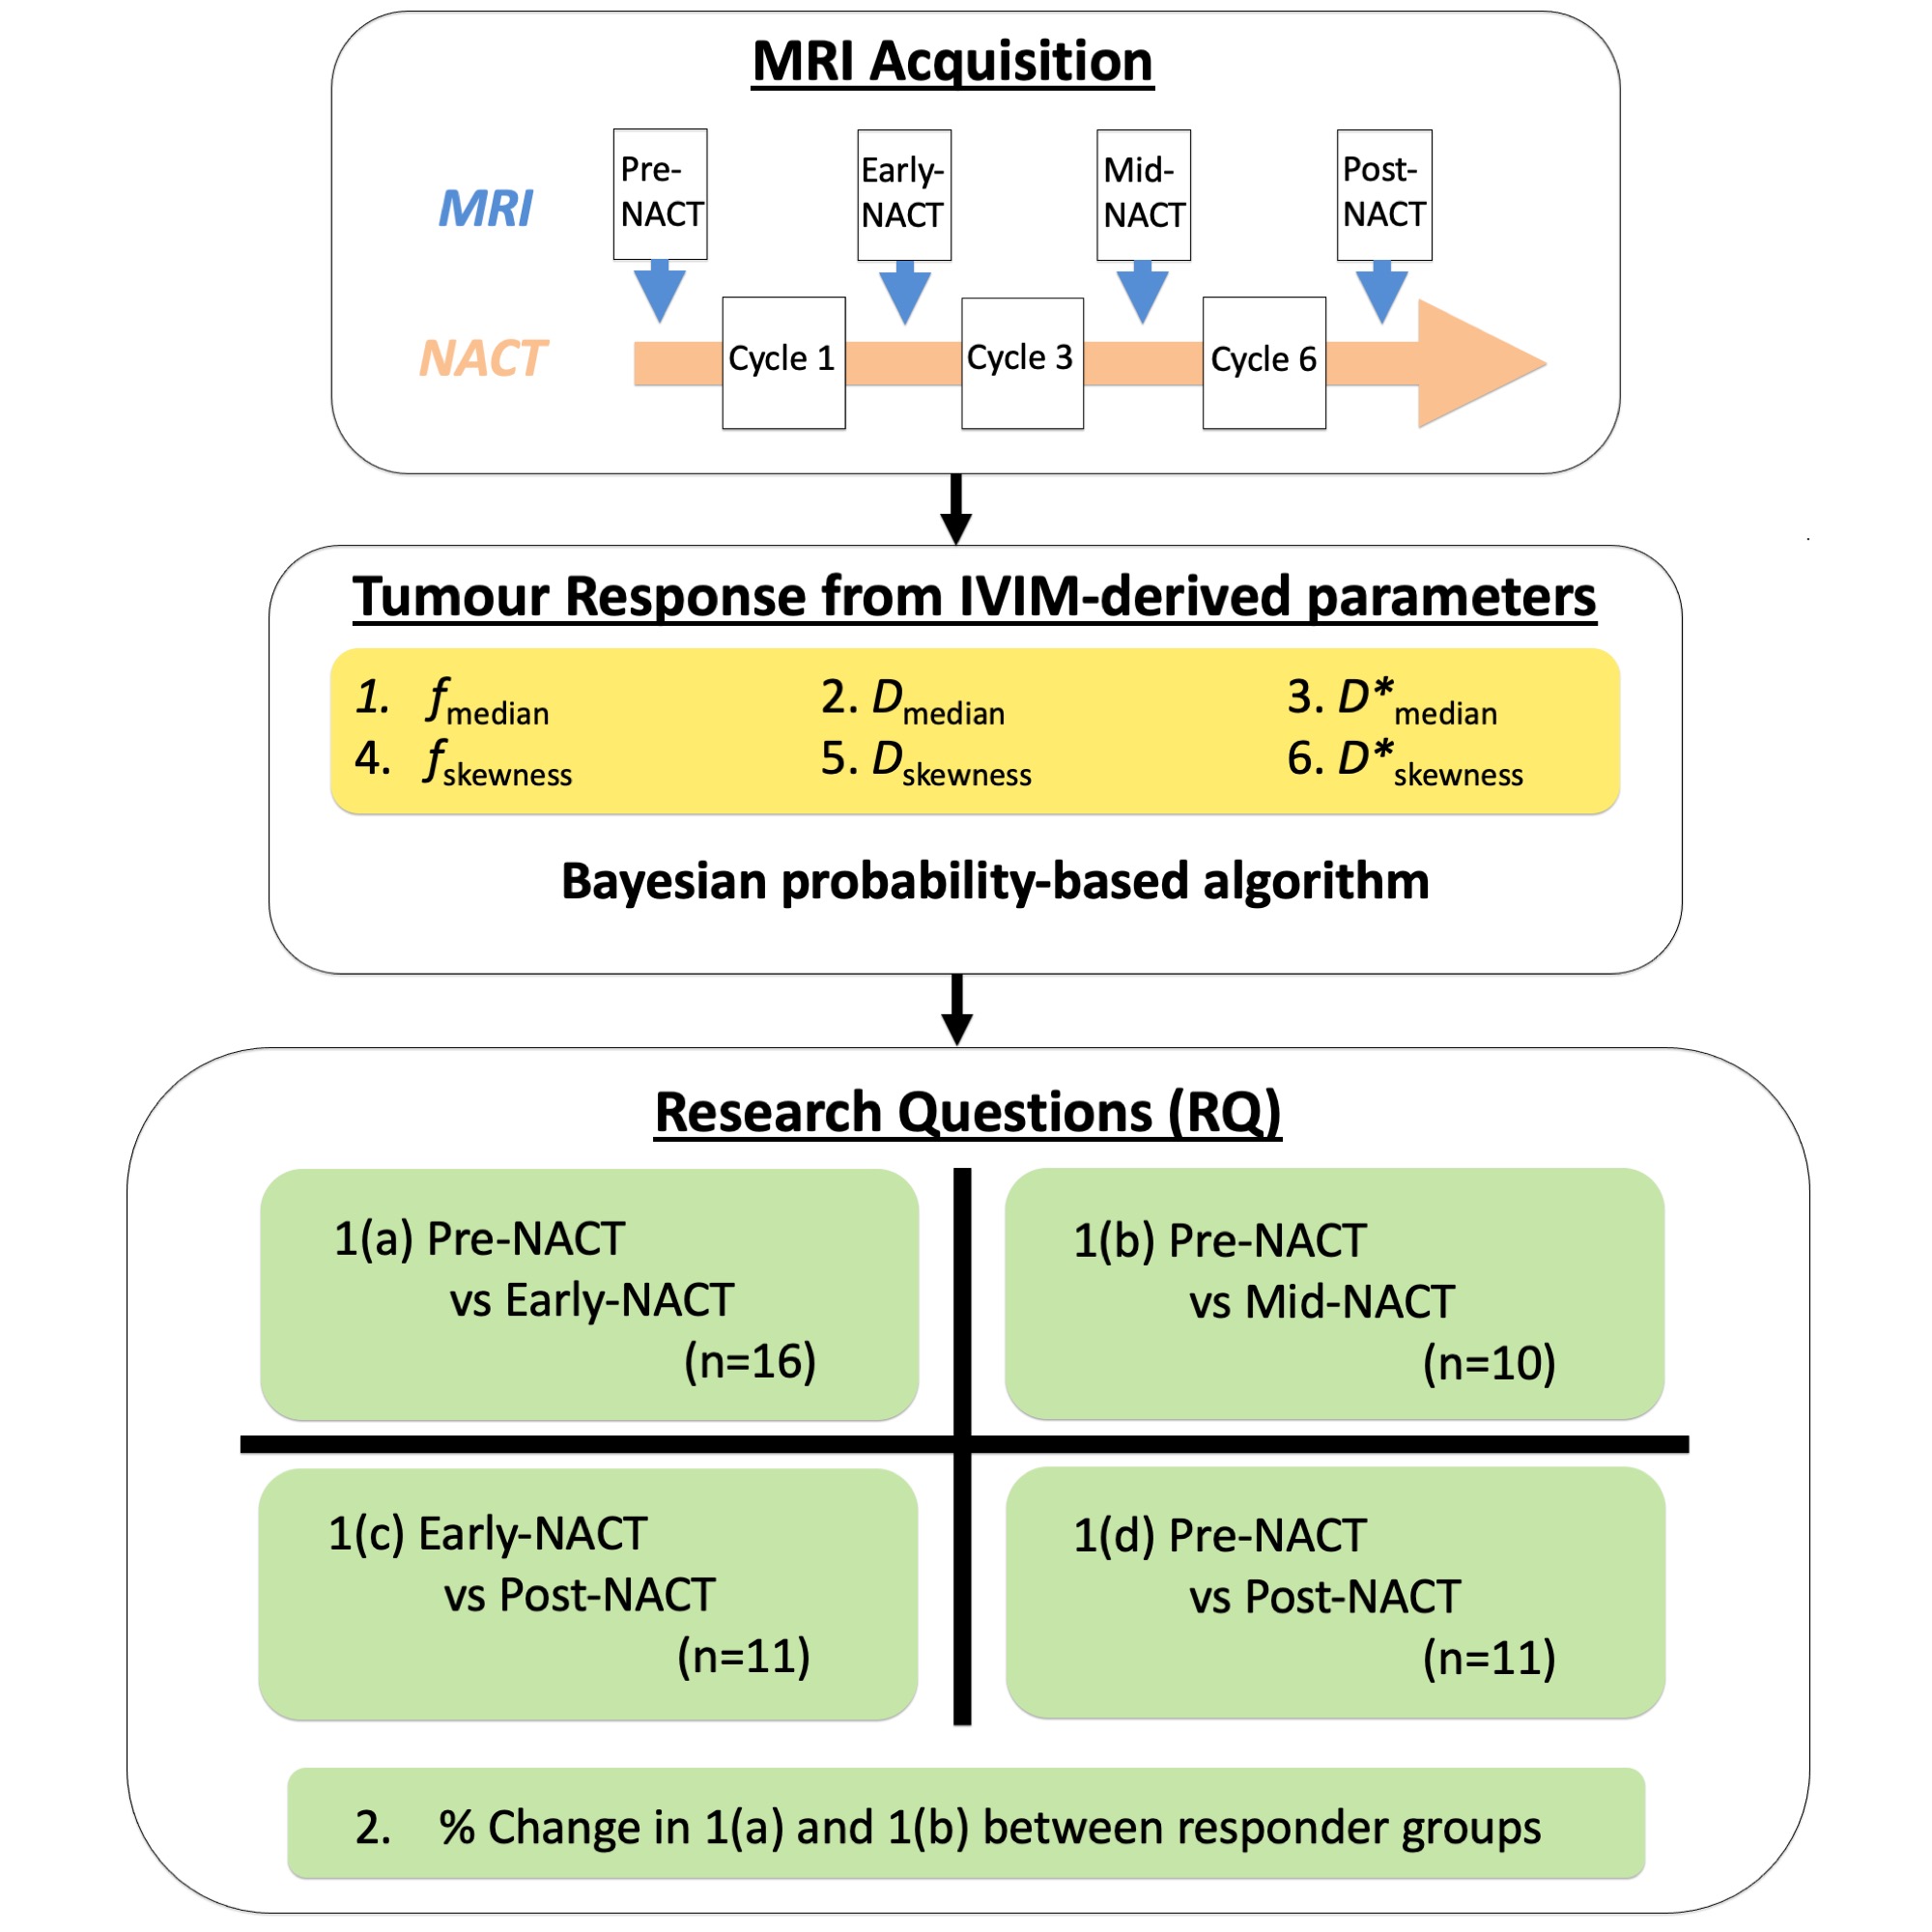
Figure 1. Study design
Intravoxel incoherent motion (IVIM) images were obtained at Pre-neoadjuvant chemotherapy (NACT), Early-NACT, Mid-NACT and Post-NACT. Bayesian probability-based algorithm was used for the assessment of tumour response in NACT. Median and skewness of IVIM-derived parameters (f, D and D*) were compared at different time points (RQ1). The predictive value of IVIM-derived parameters was assessed in poor and good responders, with patients grouped according to the Miller-Payne system for pathologic complete response (RQ2).
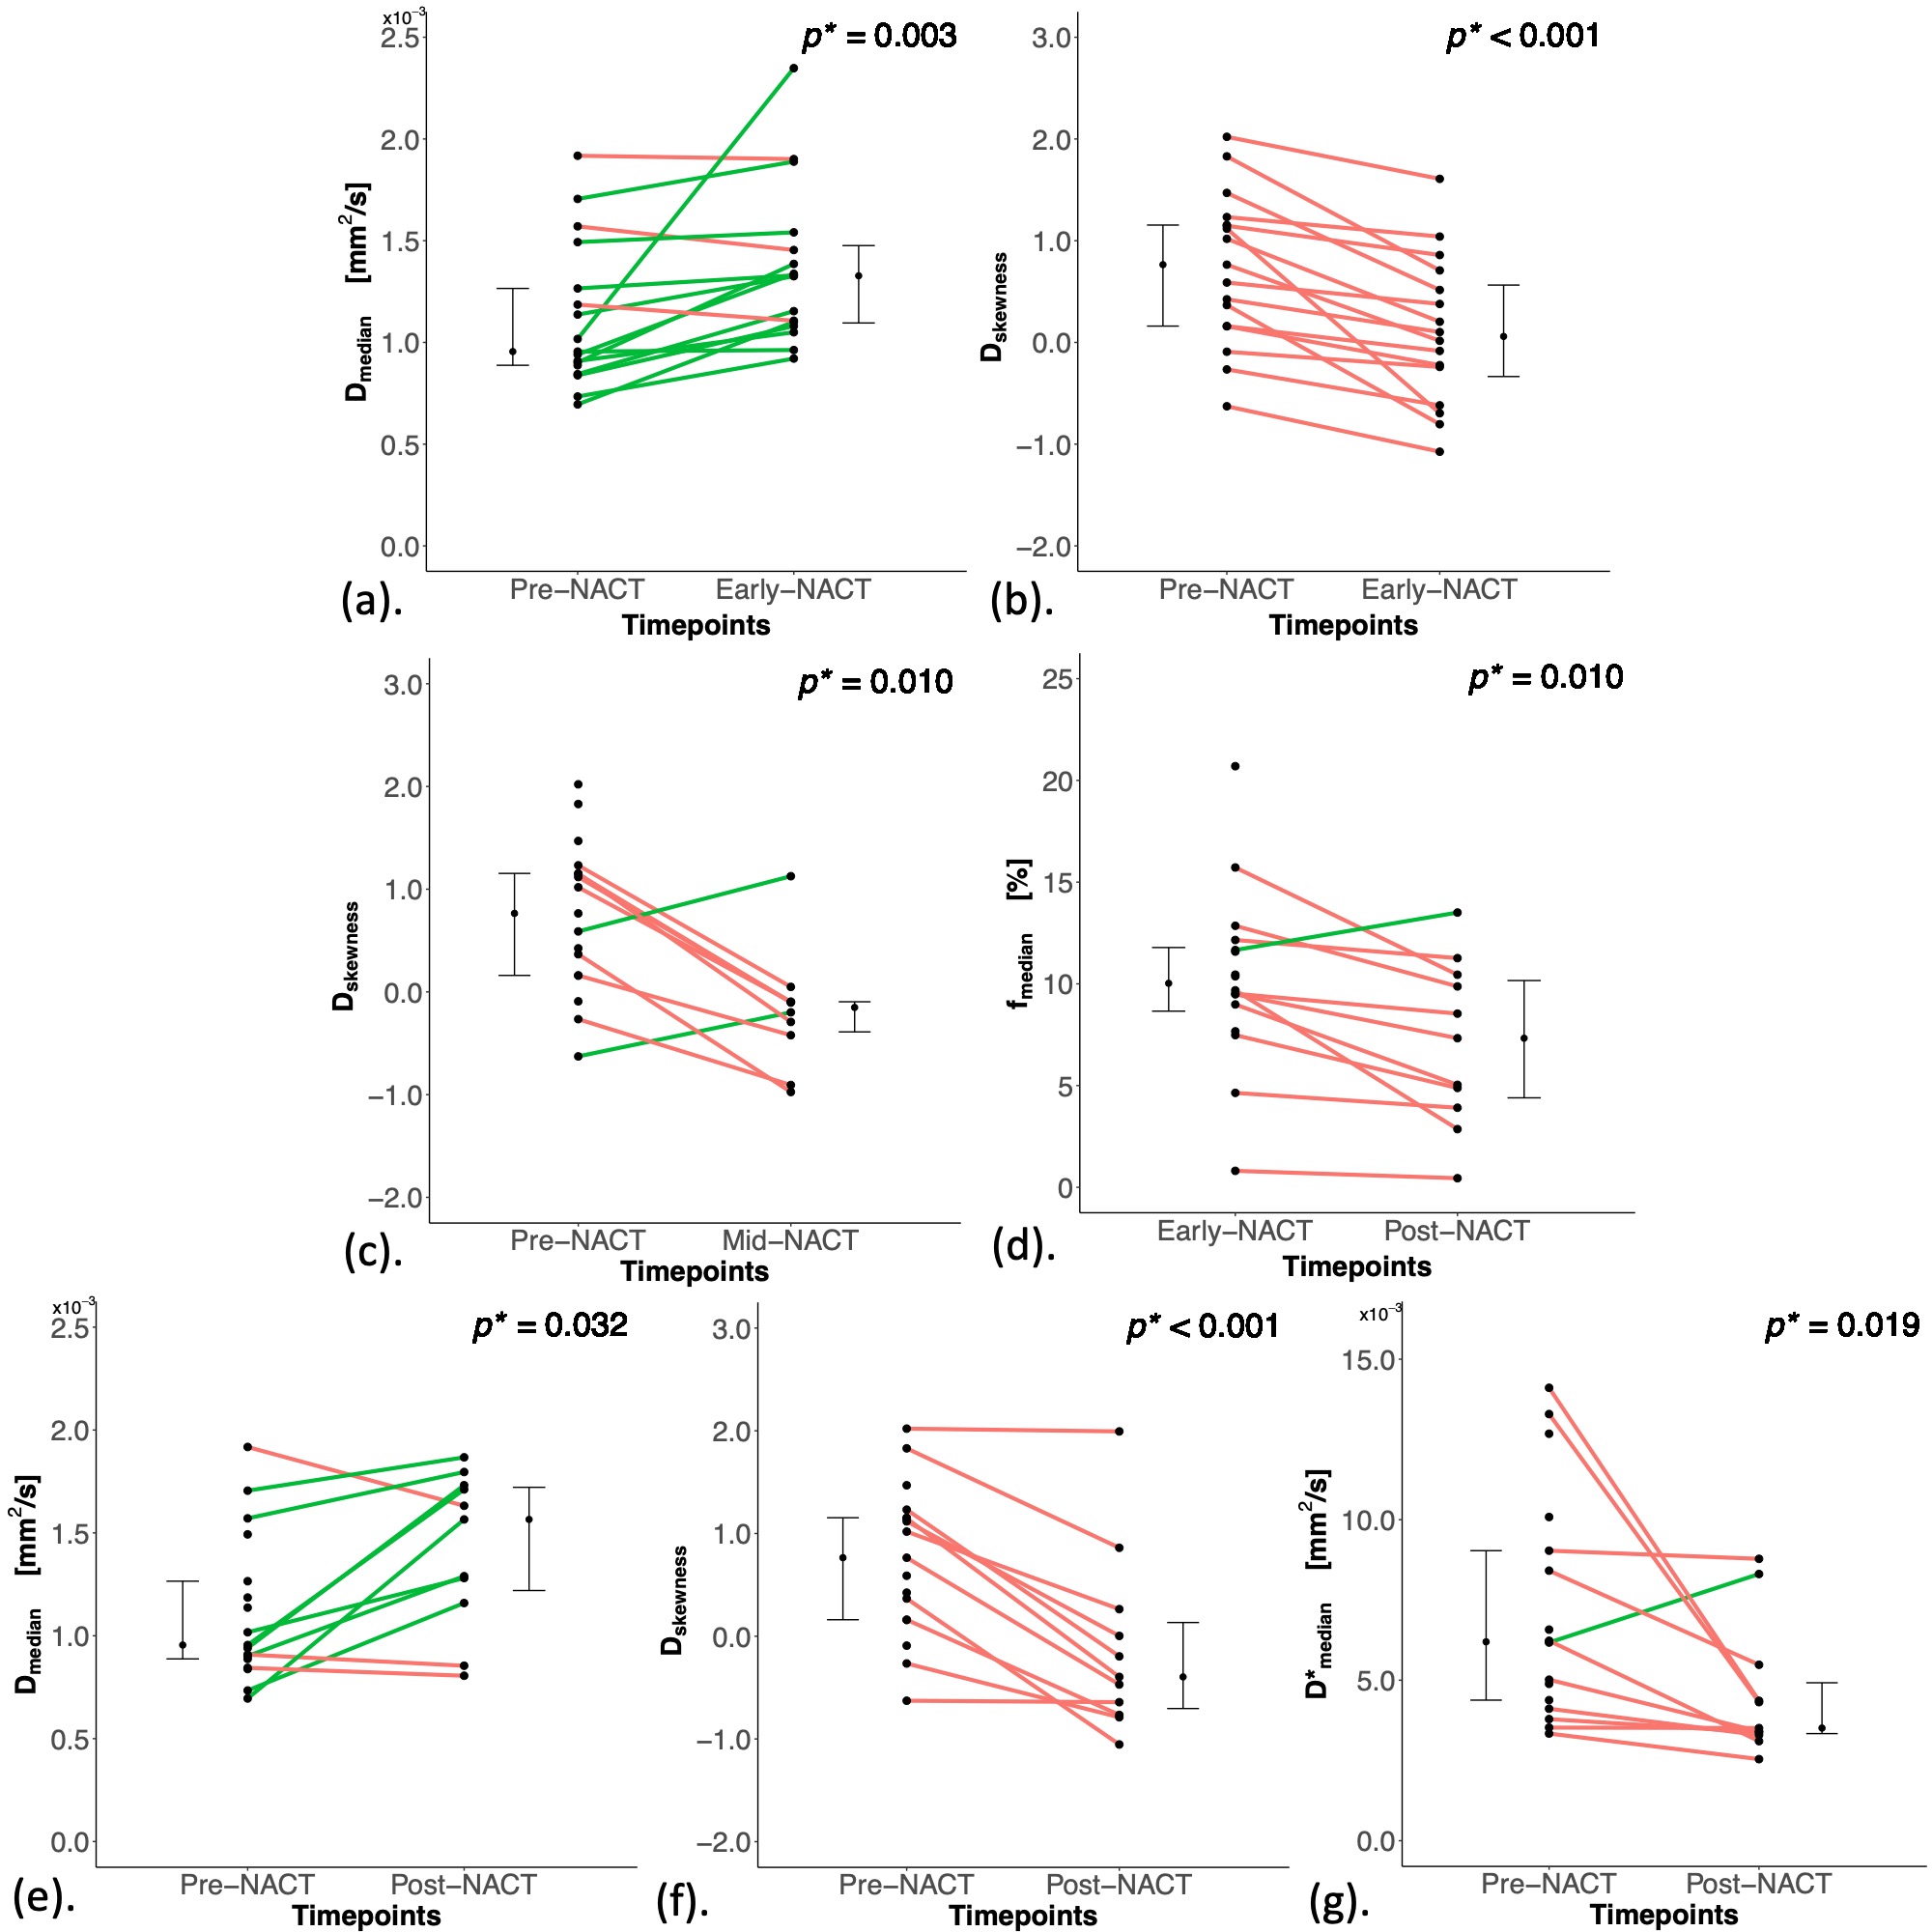
Figure 2. Linkplots of IVIM-derived parameters between Pre-NACT, Early-NACT, Mid-NACT and Post-NACT.
(a) Dmedian and (b) Dskewness between Pre- and Early-NACT. (c) Dskewness between Pre- and Mid-NACT. (d) fmedian between Early- and Post-NACT. (e) Dmedian, (f) Dskewness and (g) D*median between Pre- and Post-NACT. Each dot represents the parameter of an individual patient. Error bar represents median (IQR). Red line shows a net decrease while green line shows a net increase. Statistically significant p values (< 0.05) are shown in the upper right corner.
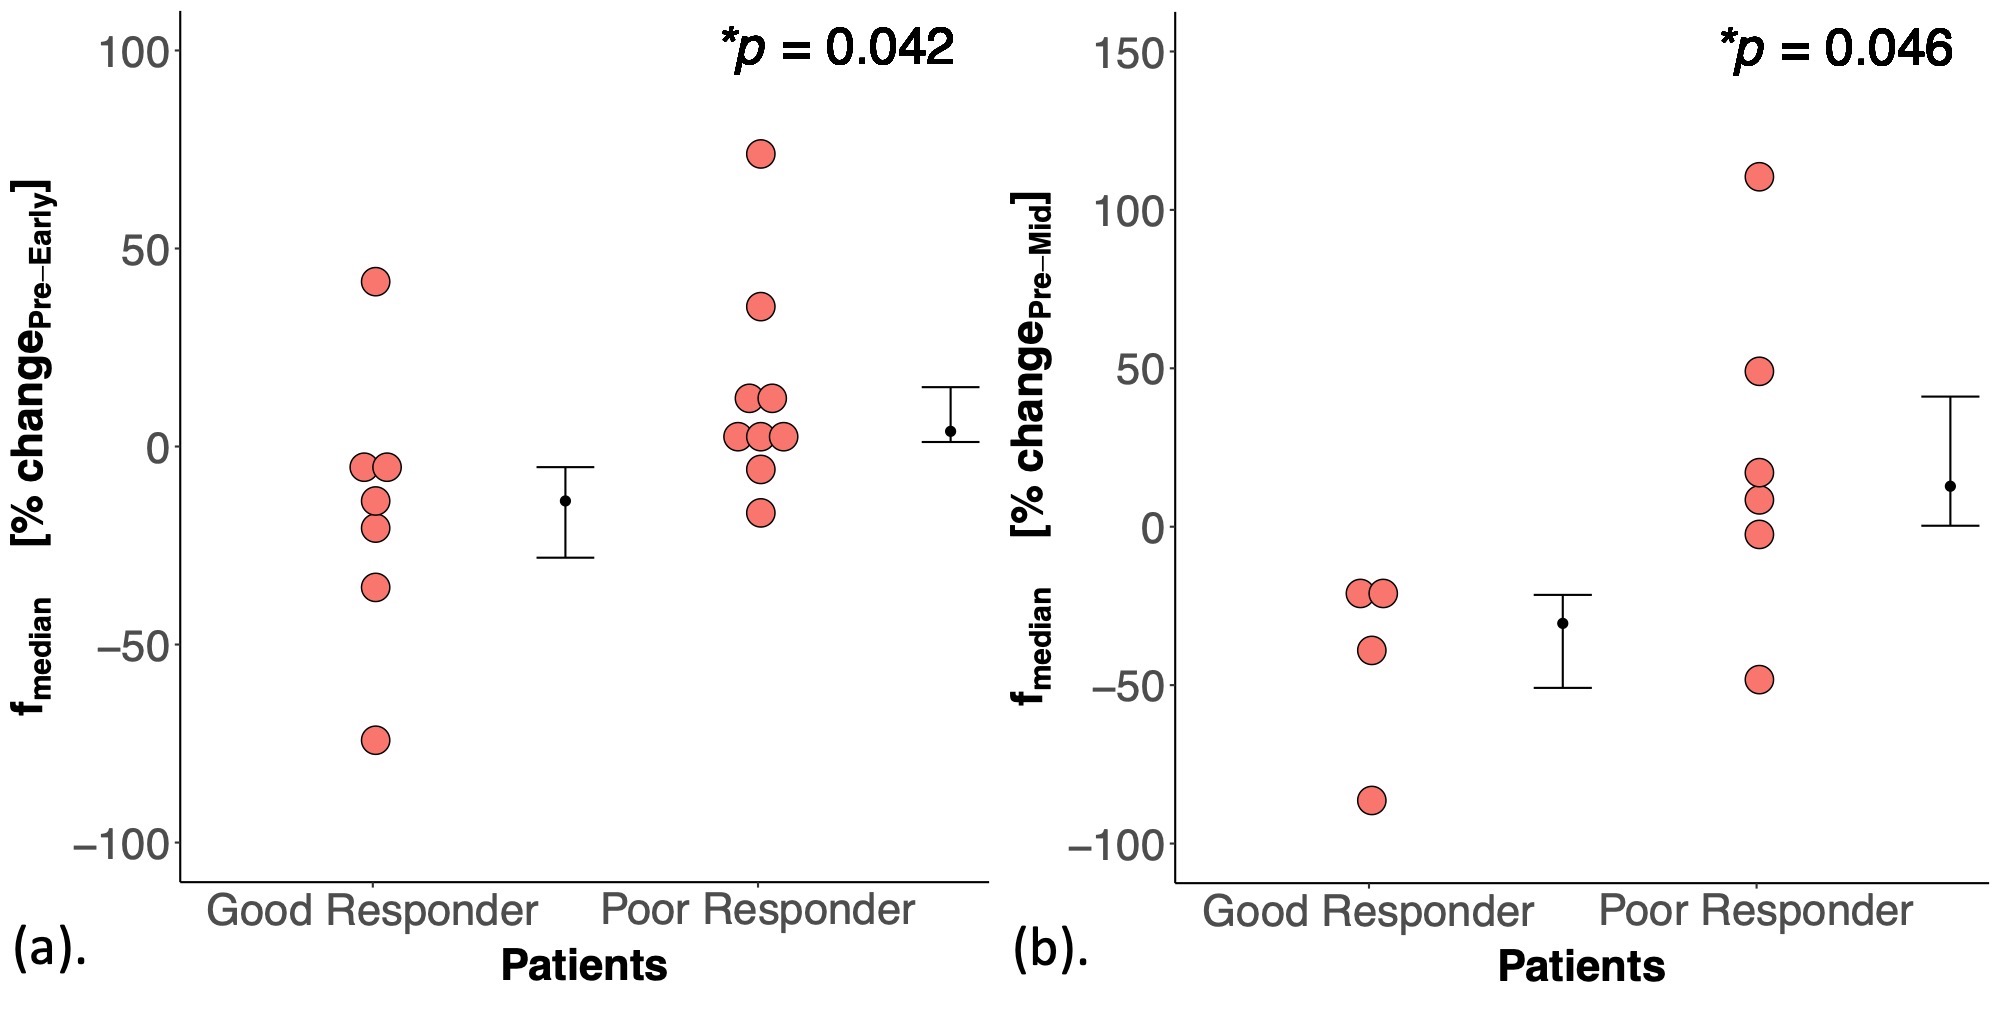
Figure 3. Dot plots of percentage changes in IVIM-derived parameters between good and poor responders.
Percentage change in fmedian between good and poor responders during the period (a) Pre-NACT to Early-NACT, (b) Pre-NACT to Mid-NACT. There was a decrease in fmedian in good responders while an increase in poor responders during period (a). The same trend continued during period (b). Each dot represents the parameter of an individual patient. Error bar represents median (IQR). Statistically significant p values (< 0.05) are shown in the upper right corner.