0939
Predictive value of T1 mapping in cervical cancer recurrence after treatment
Jie Liu1, Shujian Li1, Qinchen Cao1, Marcel Dominik Nickel2, Jingliang Cheng1, and Jinxia Zhu3
1the First Affiliated Hospital of Zhengzhou University, Zheng zhou, China, 2MR Application Predevelopment, Siemens Healthcare GmbH, Erlangen, Germany, 3MR Collaboration, Siemens Healthineers Ltd., Beijing, China
1the First Affiliated Hospital of Zhengzhou University, Zheng zhou, China, 2MR Application Predevelopment, Siemens Healthcare GmbH, Erlangen, Germany, 3MR Collaboration, Siemens Healthineers Ltd., Beijing, China
Synopsis
We investigated the feasibility of T1-mapping to predict cervical cancer (CC) recurrence after treatment. Our results show that quantitative T1 values of the primary tumor could effectively predict the CC recurrence after surgery or concurrent chemoradiotherapy (CCRT). These findings suggest that the T1-mapping method could be valuable for evaluating CC recurrence after treatment, and native T1 values of the primary tumor could predict cervical cancer recurrence.
Introduction
Primary decisions regarding cervical cancer (CC) therapy should be based on the performance status of the patient. Surgery is the treatment of choice for patients with early-stage cervical cancer, while concurrent chemoradiotherapy (CCRT) is the primary treatment for patients with advanced cervical cancer [1]. However, the 5-year CC recurrence rate remains at 28% [2]. T1 mapping is a quantitative technique, which can be used to evaluate tumor biological characteristics by measuring inherent characteristic parameters (T1 values) of the biological tissues [3]. In recent years, T1 mapping has gradually been used in tumor studies [4-5]. However, there is limited research examining correlations between pre-treatment primary tumor T1 values and its prognoses. The purpose of this study was to investigate the use of T1 mapping to predict tumor recurrence as a clinical outcome after CC treatment. In addition, apparent diffusion coefficient (ADC) values were also compared to determine the optimal predictor of CC recurrence after treatment.Methods
This study included 107 CC patients. According to NCCN Guidelines, 2020 on CC [6],the patients in the surgical group received radical hysterectomies and pelvic lymphadenectomies, while patients in the non-surgical group were treated with standard CCRT. The follow-up time ranged from 6 months to 3 years. According to the medical records and relevant examination results, the recurrence (including distant metastasis) and recurrence time were recorded. All the patients underwent magnetic resonance imaging (MRI), including diffusion-weighted imaging (DWI) and T1 mapping before treatment on a 3T system (MAGNETOM Skyra, Siemens Healthcare, Erlangen, Germany). DWI was performed using a single-shot echo plane imaging (ss-EPI) sequence with two b-values (50 and 800 s/mm2). The related parameters were as follows: TR/TE = 4050/48ms; FOV = 300×300 mm2; matrix = 168×126; slice thickness = 3 mm; parallel imaging factor = 2; acquisition time = 3 min 28 sec. T1 mapping was acquired with a prototypical inverse recovery snapshot FLASH sequence (Siemens Healthcare, Erlangen, Germany), which continuously acquired 16 FLASH contrast images after a 180° inversion pulse. The parameters of T1 mapping were: TR/TE =3.0/1.32 ms; FOV = 300×300mm2; matrix = 128×64; flip angle = 8°; slice thickness = 5 mm; acquisition time = 1min 36sec. Both ADC and T1 parametric maps were generated inline after data acquisition. Differences in the T1 and ADC values were assessed between (a) the recurrence (n=13) and non-recurrence groups (n=64) in the cervical cancer surgical group and (b) the recurrence group (n=10) and non-recurrence group (n=20) in the non-surgical group using the independent t-test. The diagnostic performance of native T1 was determined by receiver operating characteristic (ROC) analysis. The factors influencing the recurrence of cervical cancer were analyzed with logistic regression. A P<0.05 was considered statistically significant.Results
The T1 values for the recurrent group in the surgical group and non-surgical group both were higher than those of the non-recurrence group (both P < 0.05). However, the ADC values showed no difference between the two groups (P > 0.05). The detailed results are shown in Table 1. Figure 1 shows a representative image from a patient. The area under the receiver operating characteristic curve (ROC-AUC) for native T1 values to predict cervical cancer recurrence after surgical and non-surgical treatments were 0.742 and 0.780, respectively (Figure 2). The logistic regression analysis showed that the native T1 value was a predictor of recurrence in patients with CC after treatment (Table 2).Discussion
This was a preliminary feasibility study of T1 mapping for the evaluation of the CC recurrence after treatment. The results suggest that the native T1 value of the primary tumor might be a useful clinical prognostic indicator for the prediction of CC recurrence after treatment, which was closely related to the proliferative activity and heterogeneity of the tumor cells [4] [7].Conclusions
This study demonstrated that native T1 values of primary CC tumors could be important for identifying patients with a risk of disease recurrence.Acknowledgements
We sincerely thank the participants in this study.References
[1] Wang PY, Thapa D, Wu GY, et al. A Study on Diffusion and Kurtosis features of cervical cancer based on non-Gaussian diffusion Weighted Model[J]. Magn Reson Imaging, 2018, 47:60-66. [2] Zhou GX, Chen X, Tang F, et al. The value of diffusion-weighted imaging in predicting the prognosis of stage IB-IIA cervical squamous cell carcinoma after radical hysterectomy[J]. Int J Gynecol Cancer, 2016, 26(2): 361-366. [3] Hueper K,Peperhove M,Rong S,et al.T1-mapping for assessment of ischemia-induced acute kidney injury and predict ion of chronic kidney disease in mice[J]. Eur RadioI, 2014, 24(9): 2252-2260. [4] Adams LC, Ralla B, Juemeister P, et al. Native T1 Mapping as an In Vivo Biomarker for the Identification of Higher-Grade Renal Cell Carcinoma Correlation With Histopathological Findings[J]. Invest Radiol, 2019, 54(2): 118-128. [5] Wang S, Li JH, Zhu DR, et al. Contrast-enhanced magnetic resonance (MR) T1 mapping with low-dose gadolinium-diethylenetriamine pentaacetic acid (Gd-DTPA) is promising in identifying clear cell renal cell carcinoma histopathological grade and differentiating fat-poor angiomyolipoma[J]. Quant Imaging Med Surg, 2020, 10(5): 988-998. [6] Abu-Rustum NR, Yashar CM, Bean S, et al. NCCN Guidelines Insights: Cervical Cancer, Version 1.2020[J]. J Natl Compr Cnac Netw, 2020, 18(6): 660-666. [7] Lescher S, Juecoane A, Veit A, et al. Quantitative T1 and T2 mapping in recurrent glioblastomas under bevacizumab: earlier detection of tumor progression compared to conventional MRI[J]. Neuroradiology, 2015, 57(1): 11-20.Figures
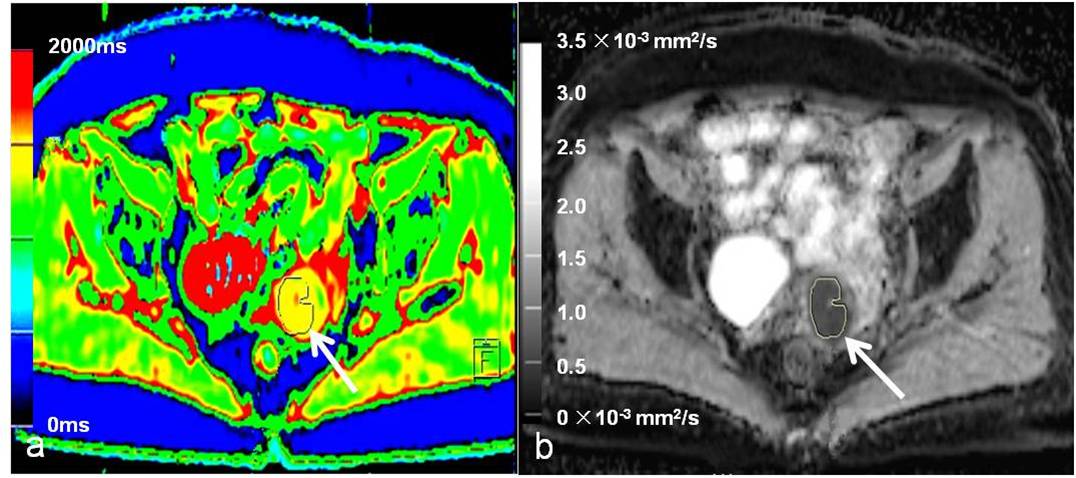
A
65-year-old patient with cervical cancer and recurrence
after surgery. (a) Axial
fusion image of the native T1 map, (b) axial apparent diffusion coefficient (ADC)
map shows a well-defined cervical mass. The regions of interest (ROIs) are drawn around the tumor on each axial slice to calculate the average value of the whole tumor. The native T1 and ADC values were 1437 ms and 0.69 ×10⁻³ mm2/s, respectively.
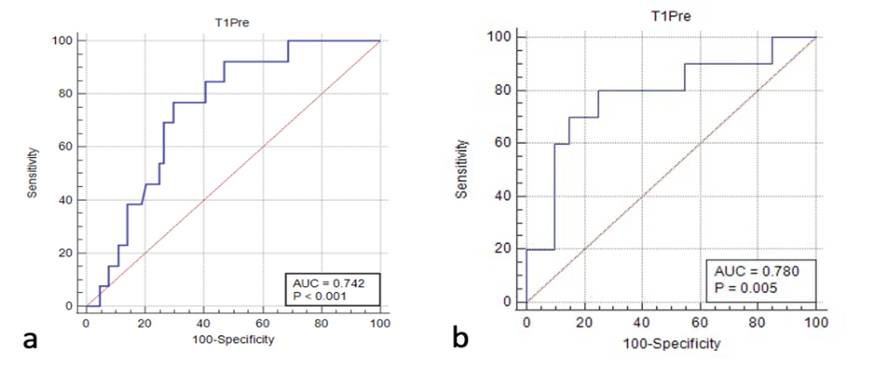
(a)
Receiver operating characteristic curve of the native T1 values
distinguishing the recurrence from the non-recurrence group in
the surgical group. (b) Receiver
operating characteristic curve of the native T1 values
distinguishing the recurrence from the non-recurrence group in
the non-surgical group.
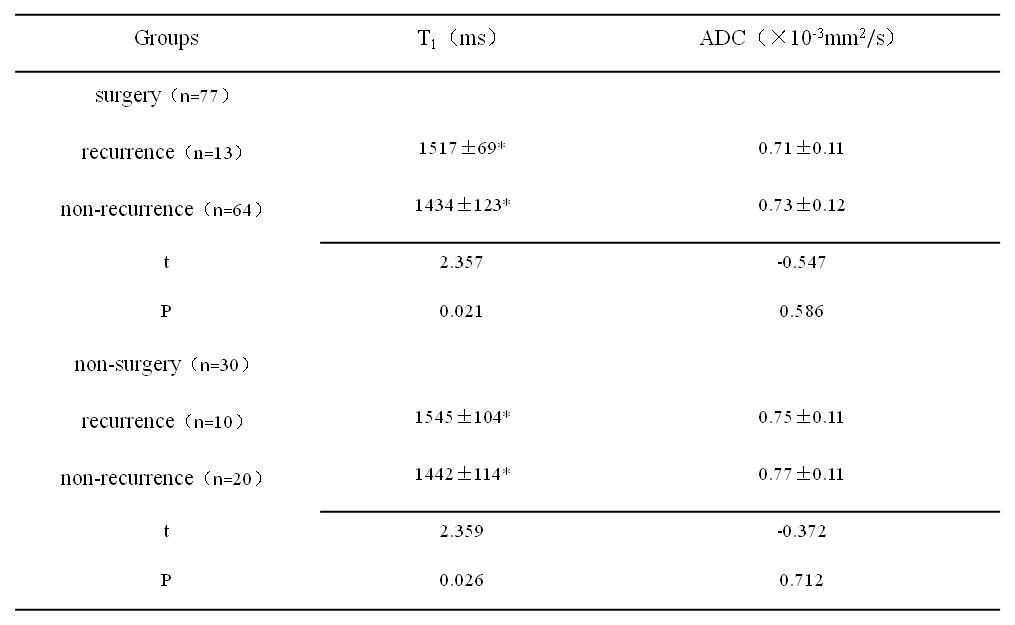
Assessment of differences in native
T1 and ADC values between the recurrence and non-recurrence groups with cervical
cancer after treatment. Native
T1 and ADC values are expressed as means±standard deviation; ADC,
apparent diffusion coefficient.
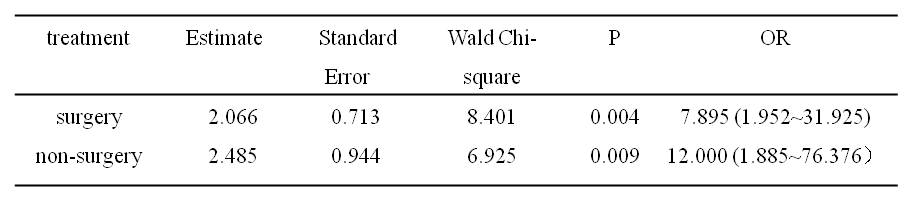
Logistic
regression analysis results of native T1 values in predicting recurrence of cervical
cancer patients after treatment. OR (odds
ratio) > 1 indicates that the native T1 value is a predictor of cervical
cancer recurrence, and the coinciding 95% confidence intervals are in
parentheses.
DOI: https://doi.org/10.58530/2022/0939