0938
DTI quantitative parameter texture features for differentiating solid pseudopapillary neoplasm from pancreatic neuroendocrine tumors1Department of Radiology, Dalian Friendship Hospital, Dalian, China, 2School of Medical Imaging, Dalian Medical University, Dalian, China, 3GE Healthcare, MR Research China, Beijing, China, 4Department of Radiology, the First Affiliated Hospital of Dalian Medical University, Dalian, China
Synopsis
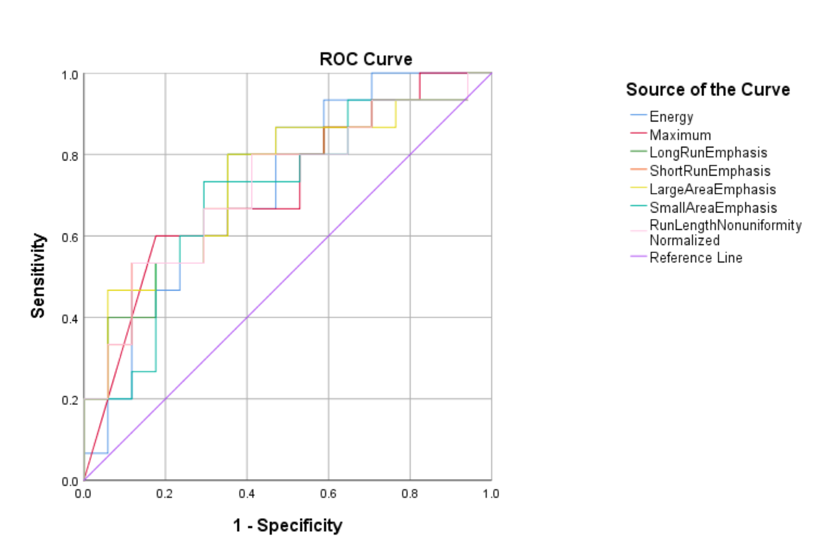
This work aimed for diffusion tensor imaging (DTI) quantitative parameter texture features based strategy to identify solid pseudopapillary neoplasm(SPN)and pancreatic neuroendocrine tumors(PNET),which may represent a diagnostic challenge due to many overlapping MRI features. The results showed that Large Area Emphasis (AUC: 0.737, sensitivity: 64.7%, specificity: 80%on FA signal intensity) was the optimal strategy to identify SPN and PNET.
Purpose
To evaluate the value of diffusion tensor imaging (DTI) quantitative parameter texture features in differentiating solid pseudopapillary neoplasm(SPN) from pancreatic neuroendocrine tumors (PNET).Introduction
SPN and PNET are all the rare tumor of pancrea, SPN have a low malignant potential with an excellent prognosis following complete resection and metastases are uncommon for SPN [1–3], while PNET have malignant behavior and worse prognosis compared to SPN. Because the clinical management and patient prognosis significantly differ between these two major pancreatic lesions, accurate and timely imaging diagnosis is essential[4] . Therefore, differentiating PNET from SPN based on imaging manifestation may be challenging when the atypical characteristics are found. DTI is an imaging modality that detects the microstructural and pathological changes of organisms according to the diffusive characteristics of water molecules in the tissues, while texture features is a new image analysis method which has been used for malignant tumor grade or prognosis evaluations. We hypothesize that it’s feasible to identify SPN and PNET by DTI texture features based on strategy.Materials and Methods
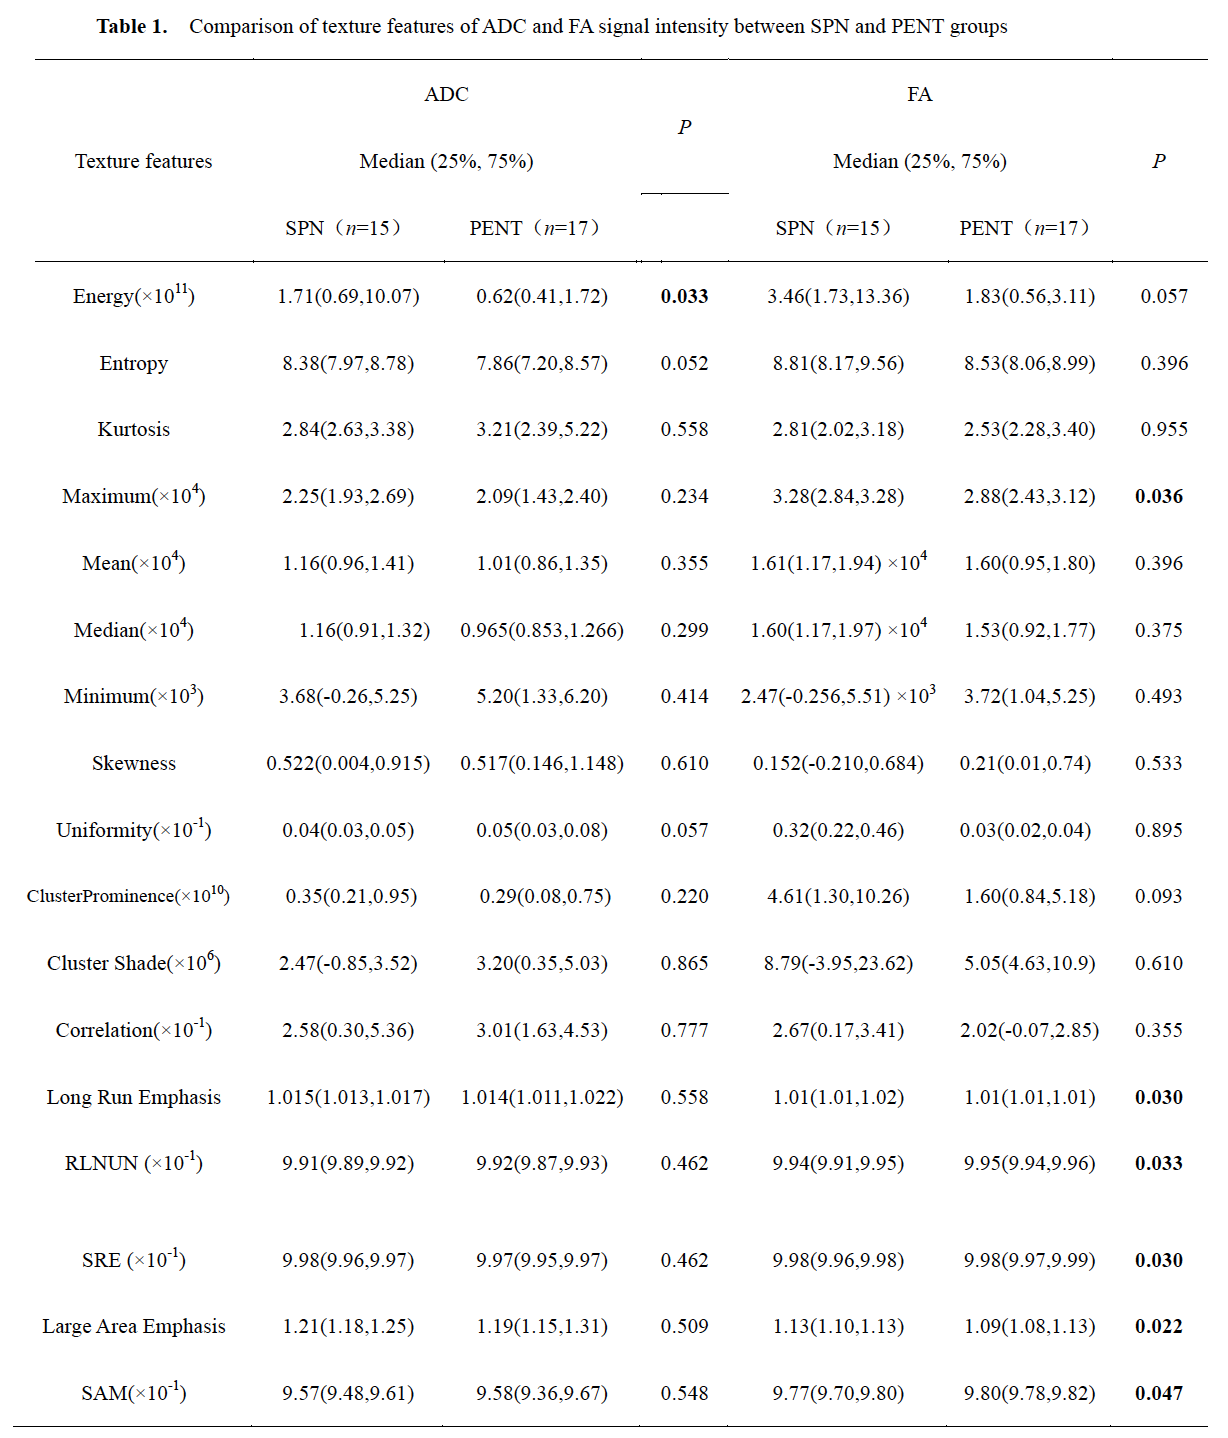
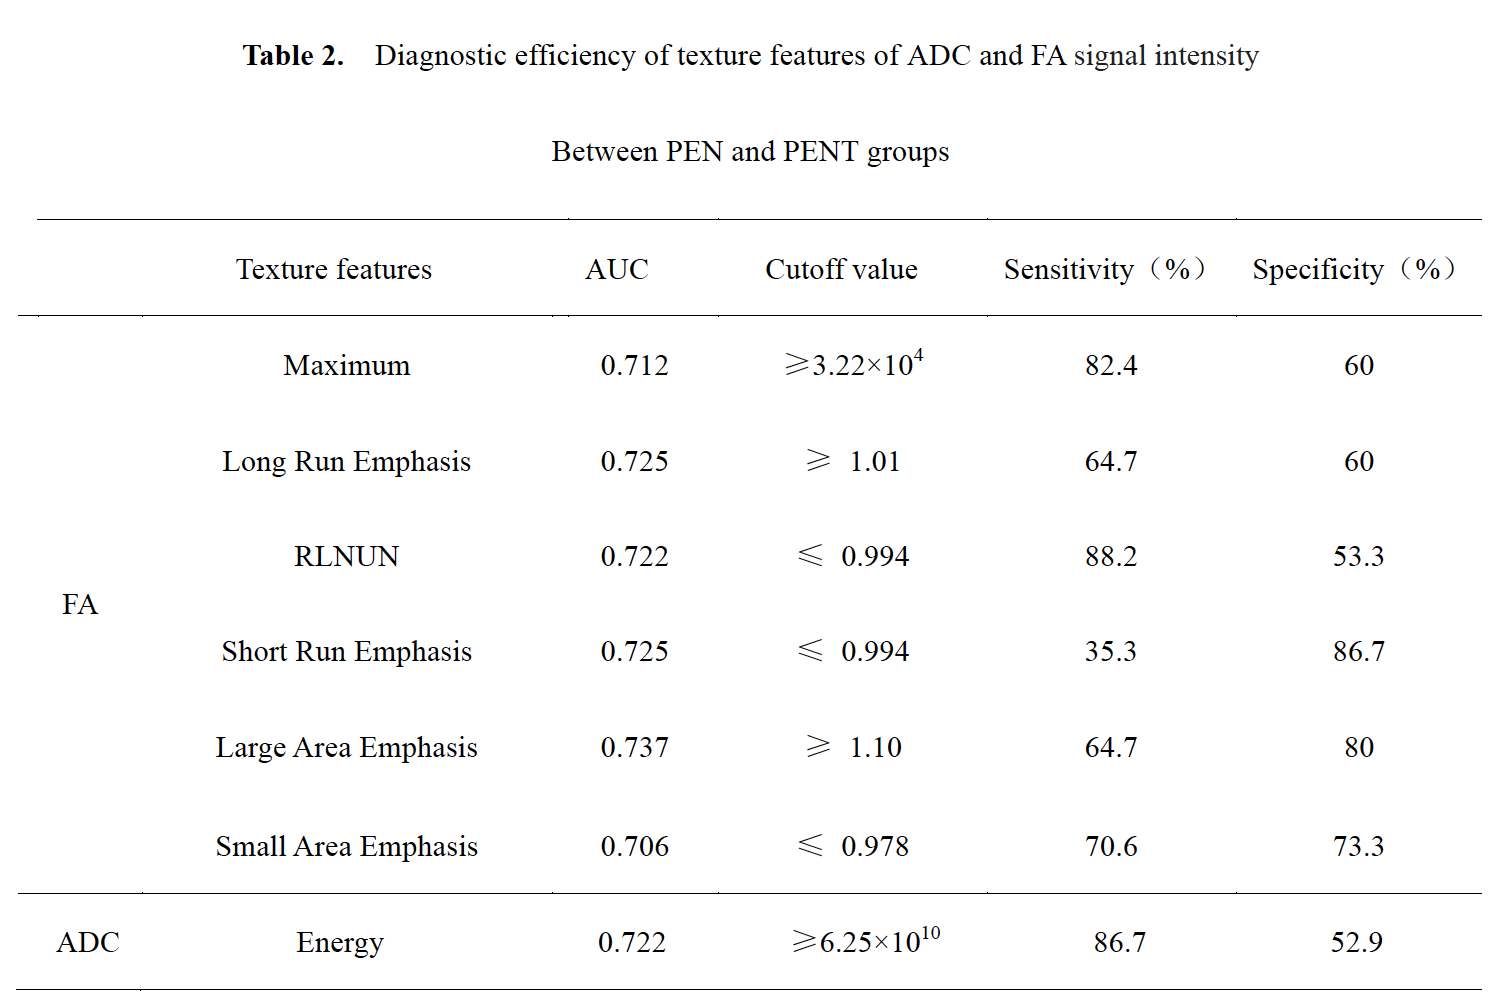
The study retrospectively enrolled 32 patients who were pathologically or follow-up imaging confirmed as SPN(15 case) or PNET(17 case), respectively. All patients have undergone preoperative MR examinations, including routine scanning (T1WI, T2WI) and additional DTI (b value=0, 600 (s/mm2), in 6 directions). ADC and FA maps were derived using FunctionTool software on GE AW4.6 workstation, and they were analyzed by Omni-Kinetics software (GE Healthcare). The radiologist reviewed the MRI images and manually outlined the region of interests (ROIs) at each slice of the lesion on ADC and FA signal intensity maps, then texture features were generated automatically after 3D ROIs covering the whole tumor (Figure 1, Figure 2). Texture parameters, such as Energy, Entropy, Kurtosis, Maximum, Mean, Median, Minimum, Skewness, Uniformity, Cluster Prominence, Cluster Shade, Correlation, Long Run Emphasis, Run Length Non-uniformity Normalized, Short Run Emphasis, Large Area Emphasisand Small Area Emphasis were obtained. Data analysis were performed using SPSS 26.0 statistical software. Mann-Whitney U test was used for texture features, diagnostic performance was evaluated by receiver operating characteristic (ROC) analysis.Results
There was a significant difference in Energy of ADC signal intensity between the SPN and PNET groups. Moreover, a significant difference was observed in Maximum, Long Run Emphasis, Run Length Non-uniformity Normalized(RLNUN), Short Run Emphasis(SRE), Large Area Emphasis, Small Area Emphasis(SAM) of FA signal intensity between the two groups (P<0.05, Table 1). The remaining parameters were not statistically different. Results indicated that Large Area Emphasis (AUC: 0.737, sensitivity: 64.7%, specificity: 80% on FA signal intensity) was the optimal strategy to identify SPN and PNET (Table 2, Figure 3).Discussion
The Energy of ADC in SPN group was higher compared to PENT group. The Maximum, Long Run Emphasis, Large Area Emphasis of FA in SPN group was higher compared to PENT group. The Run Length Non-uniformity Normalized,Short Run Emphasis, Small Area Emphasis of FA in SPN group was lower compared to PENT group. Texture features on FA is more valuable than those on ADC. To our best knowledge, this is the first study of DTI based texture strategy to identify SPN and PENT and further study will be performed to verify its utility.Conclusion
This study proposed a DTI based texture strategy to preoperatively identify SPN and PNET, it may provide a more promising method for tumor differentiation in clinic and facilitate clinical management.Acknowledgements
No acknowledgement found.References
[1].Romics L, Jr., Oláh A, Belágyi T, Hajdú N, Gyurus P, Ruszinkó V. Solid pseudopapillary neoplasm of the pancreas–proposed algorithms for diagnosis and surgical treatment. Langenbecks Arch Surg. (2010) 395: 747–55.
[2].Wang WB, Zhang TP, Sun MQ, Peng Z, Chen G, Zhao Y. Solid pseudopapillary tumor of the pancreas with liver metastasis: clinical features and management. Eur J Surg Oncol. (2014) 40:1572–7.
[3].Law JK, Ahmed A, Singh VK, Akshintala VS, Olson MT, Raman SP, et al. A systematic review of solid-pseudopapillary neoplasms: are these rare lesions? Pancreas. (2014) 43:331–7.
[4].Reidy-Lagunes D, Thornton R. Pancreatic neuroendocrine and carcinoid tumors: what’s new, what’s old, and what’s different? Curr Oncol Rep. (2012) 14:249–56.
Figures