0936
Elevated magnetic resonance imaging measures of adipose tissue deposition in women with breast cancer treatment-related lymphedema1Department of Radiology and Radiological Sciences, Vanderbilt University Medical Center, Nashville, TN, United States, 2Vanderbilt University Institute of Imaging Science, Vanderbilt University Medical Center, Nashville, TN, United States, 3Department of Biomedical Engineering, Vanderbilt University Medical Center, Nashville, TN, United States, 4Department of Physical Medicine and Rehabilitation, Vanderbilt University Medical Center, Nashville, TN, United States, 5Department of Neurology, Vanderbilt University Medical Center, Nashville, TN, United States, 6Department of Pediatrics, Vanderbilt University Medical Center, Nashville, TN, United States, 7School of Medicine, The City College of New York, New York, NY, United States, 8Department of Psychiatry and Behavioral Sciences, Vanderbilt University Medical Center, Nashville, TN, United States
Synopsis
The overall goal of this work is to apply Dixon fat-water MRI to test fundamental hypotheses regarding the role of elevated adiposity in breast cancer treatment-related lymphedema (BCRL) condition severity. BCRL is a common co-morbidity of breast cancer therapies, yet factors that contribute to BCRL progression remain incompletely characterized. We observed that adiposity quantified by MRI is elevated in the affected upper extremity and torso of women with BCRL and increases with condition severity. As such, Dixon MRI may provide a surrogate marker of BCRL onset and may help to inform the varied course of lymphedema progression.
Introduction
Breast cancer treatment-related lymphedema (BCRL) arises secondary to breast cancer treatment involving axillary lymph node (LN) removal and affects a high 300,000 women annually 1, or approximately 20-30% of women undergoing these procedures 2, 3. Early or prophylactic therapy has been shown to reduce BCRL progression rates 4, however existing BCRL biomarkers [i.e., number of LNs excised, body-mass-index (BMI), and age] are incomplete indicators of condition progression risk 5-7. Importantly, these parameters do not inform the molecular mechanisms of lymphedema, a fundamental issue since BCRL can have a relatively indolent or aggressive course despite similar patient demographics and surgical procedures. MRI is potentially a sensitive tool to detect early changes in molecular tissue composition in BCRL where fat and non-fat muscle species are indicated. We investigated the hypothesis that MRI measures of subcutaneous adipose tissue were uniquely elevated in women with BCRL.Methods
All participants provided informed, written consent and were scanned at 3T (Philips Healthcare). The protocol consisted of a localizer scan to identify a bilateral field-of-view (FOV) = 520x424x192 mm3 spanning from the top of the shoulders to below the mammary fold. Proximity of axillary LN was identified in this FOV using a diffusion-weighted imaging with background suppression sequence (DWIBS, TR/TE=7755/53 ms, echo planar imaging-factor=71, b-value=800 s/mm2; duration=2.7 min). A maximum intensity projection image was reconstructed from 35 slices (spatial-resolution = 1.6x1.6x5.5 mm3) into 9 views (3x3x5 mm3). High in-plane spatial-resolution anatomical T2-weighted imaging with fat-suppression (spectral attenuated inversion recovery, SPAIR, TR/TE=3500/60 ms, 0.3x0.3x5 mm3) was applied over axillae using a restricted FOV (180x180x50 mm3) for localization and visualization purposes. For fat-to-muscle fraction analysis, multi-point Dixon imaging was applied (dual-echo per TR=3.5 ms, TE1=1.15, TE2=2.3 ms, 3D gradient echo readout; duration=18s) over the same FOV to yield higher spatial-resolution (0.9x0.7x2.5 mm3) water-weighted and fat-weighted anatomical contrasts. The non-fat water-weighted contrast in the Dixon acquisition is referred to as muscle.Statistical analyses
All statistical analyses were performed in MATLAB (Mathworks, Natick, MA, USA). A Wilcoxon rank-sum test was used to confirm participants were similar for continuous values, compare fat-to-muscle fraction between the affected arms of BCRL participants and the mean value from right and left arms of controls. An ANOVA was applied to evaluate correspondence with BCRL stage (healthy, early BCRL Stage 0-1, and advanced BCRL Stage 2). Significance criterion was two-sided p<0.05.
Results
Female participants were enrolled with BCRL (n=22; age=55.1±10.3 years; BMI=28.9±5.3 kg/m2) and without BCRL (n=24; age=50.6±10.6 years; BMI=27.0±6.6 kg/m2). Cohorts were matched for age (p=0.15) and BMI (p=0.28). BCRL participants had 14.6±8.2 (range=1-27) LNs removed, arm Lymphedema Stage=1.3±0.8 (range=0-2), and upper-quadrant Lymphedema Stage=1.3±0.7 (range=0-2). No controls had a history of cancer, lymphatic or vascular disease. Figure 1 summarizes fat-to-muscle fraction segmentation examples. Quantification of fat-to-muscle volume fraction from two segmentation trials demonstrates a high degree of repeatability (Figure 2). Figure 3 shows high spatial resolution anatomical scans for visualization of fat and fluid in participants with vs. without BCRL.The fat-to-muscle volume fraction in healthy control participants was approximately symmetric (p=0.51) on the right (fraction=0.526±0.197) and left (fraction=0.565±0.231) sides. Fat-to-muscle fraction was asymmetric and significantly (p=0.007) elevated on the affected (fraction=0.732±0.184) vs. contralateral (fraction=0.639±0.167) side in BCRL participants, and in the BCRL participant affected arms vs. the mean left and right arms from healthy control participants (p<0.001). The fat-to-muscle fraction was not significantly elevated on the contralateral side of BCRL vs. control participants (p=0.070).
Furthermore, we evaluated whether asymmetry in the fat-to-muscle fraction between extremities was associated with established clinical indicators of condition severity, quantified as BCRL stage. Across all participants (ANOVA; p=0.041), it was observed that the fat-to-muscle fraction was elevated on the affected relative to contralateral side of participants with increasing lymphedema stage (Figure 4).
Discussion
Findings suggest that fat-to-muscle fraction is uniquely elevated on the affected side of women with BCRL. MRI is well-suited to quantify fat and non-fat (e.g., muscle) species in the context of lymphedema and may provide non-invasive biomarkers of subclinical BCRL onset and lymphedema progression risk. This information is likely useful to inform our understanding of the pathogenesis of lymphedema and may be useful in future investigations to triage patients for prophylactic therapies prior to irreversible tissue damage.Conclusions
Adiposity quantified by MRI is elevated in the affected upper extremity and torso of women with BCRL and may provide a surrogate marker of condition onset and severity. Using MRI to enhance surveillance for lymphedema pathogenesis following cancer treatments has potential to improve early patient triage to necessary prophylactic therapies.Acknowledgements
We are grateful to Christopher Thompson, Clair Jones, Marisa Bush, Joshua Hageman, Charles Nockowski, and Ryan Robinson for experimental support. Funding: This research was funded by NIH/NINR 1R01NR015079, NIH/NHLBI 1R01HL155523, the Lipedema Foundation (LF) Postdoctoral Research Fellowship, and LF Collaborative Grant #12. Imaging experiments were performed in the Vanderbilt Human Imaging Core using research resources supported by the NIH grant 1S10OD021771-01. Recruitment through www.ResearchMatch.org and services at the Clinical Research Center are supported by the National Center for Advancing Translational Sciences (NCATS) Clinical Translational Science Award (CTSA) Program, award number 5UL1TR002243-03. REDCap resources were provided by NCATS/NIH UL1 TR000445. The content is solely the responsibility of the authors and does not necessarily represent the official views of the NIH.References
1. U.S. Breast Cancer Statistics: BreastCancer.org.
2. DiSipio T, Rye S, Newman B, Hayes S. Incidence of unilateral arm lymphoedema after breast cancer: a systematic review and meta-analysis. Lancet Oncol. 2013;14(6):500-15. doi: 10.1016/S1470-2045(13)70076-7. PubMed PMID: 23540561.
3. Boyages J, Xu Y, Kalfa S, Koelmeyer L, Parkinson B, Mackie H, Viveros H, Gollan P, Taksa L. Financial cost of lymphedema borne by women with breast cancer. Psychooncology. 2017;26(6):849-55. doi: 10.1002/pon.4239. PubMed PMID: 27479170; PMCID: PMC5484300.
4. Shah C, Arthur DW, Wazer D, Khan A, Ridner S, Vicini F. The impact of early detection and intervention of breast cancer-related lymphedema: a systematic review. Cancer Med. 2016;5(6):1154-62. doi: 10.1002/cam4.691. PubMed PMID: 26993371; PMCID: PMC4924374.
5. McDuff SGR, Mina AI, Brunelle CL, Salama L, Warren LEG, Abouegylah M, Swaroop M, Skolny MN, Asdourian M, Gillespie T, Daniell K, Sayegh HE, Naoum GE, Zheng H, Taghian AG. Timing of Lymphedema After Treatment for Breast Cancer: When Are Patients Most At Risk? Int J Radiat Oncol Biol Phys. 2019;103(1):62-70. Epub 2018/08/31. doi: 10.1016/j.ijrobp.2018.08.036. PubMed PMID: 30165125; PMCID: PMC6524147.
6. Michelotti A, Invernizzi M, Lopez G, Lorenzini D, Nesa F, De Sire A, Fusco N. Tackling the diversity of breast cancer related lymphedema: Perspectives on diagnosis, risk assessment, and clinical management. Breast. 2019;44:15-23. Epub 2018/12/24. doi: 10.1016/j.breast.2018.12.009. PubMed PMID: 30580170.
7. Sayegh HE, Asdourian MS, Swaroop MN, Brunelle CL, Skolny MN, Salama L, Taghian AG. Diagnostic Methods, Risk Factors, Prevention, and Management of Breast Cancer-Related Lymphedema: Past, Present, and Future Directions. Curr Breast Cancer Rep. 2017;9(2):111-21. doi: 10.1007/s12609-017-0237-8. PubMed PMID: 28894513; PMCID: PMC5590641.
Figures
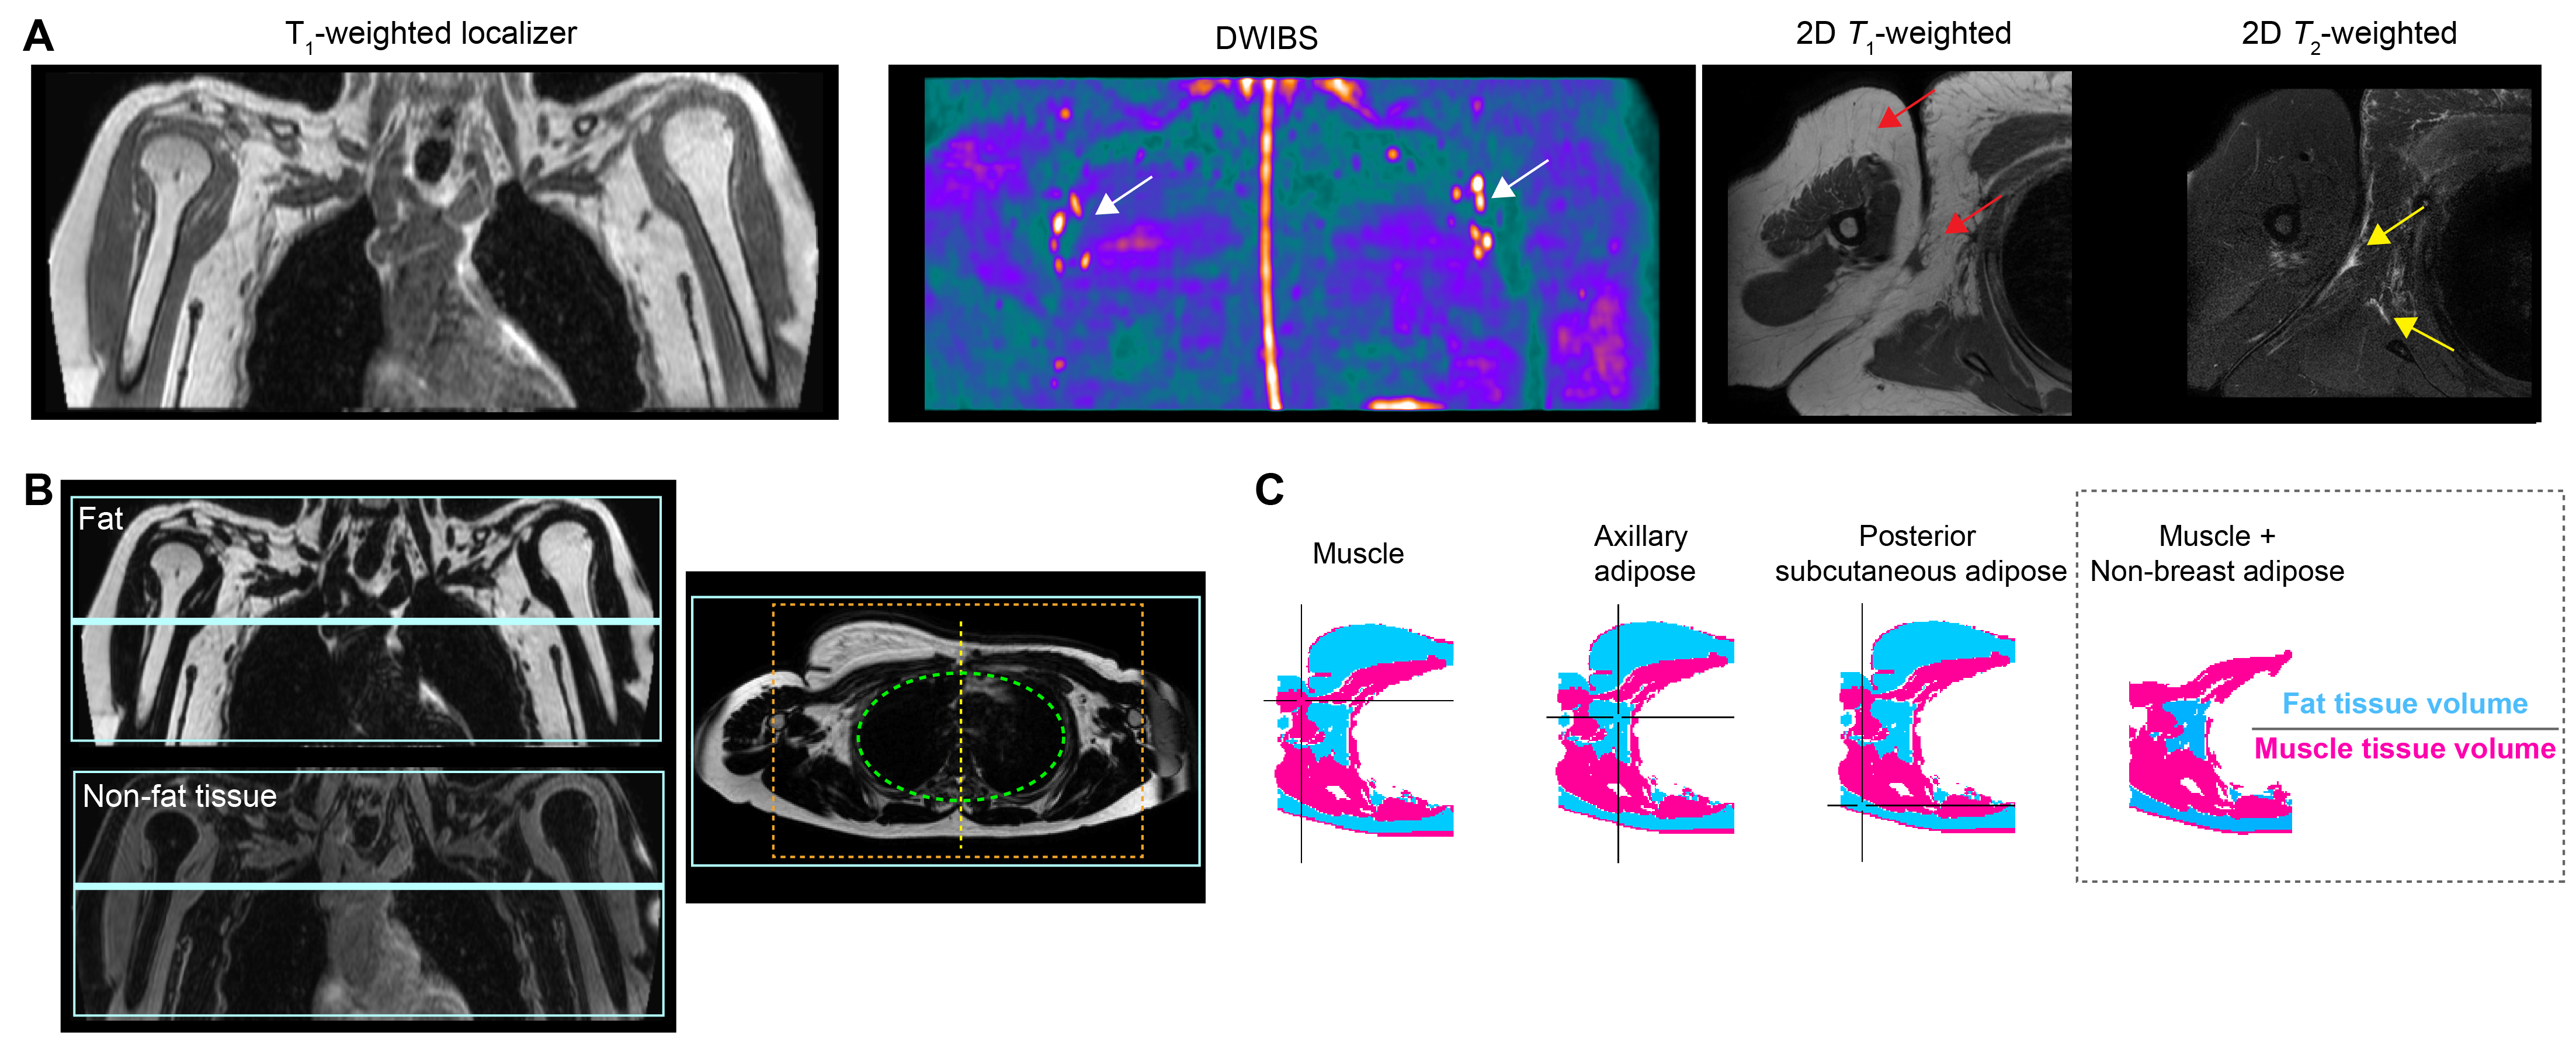
Figure 1. (A) MRI localization of axillary lymph nodes (arrows) for planning. (B) Extremity and axillary tissues were segmented from Dixon fat- and non-fat imaging. Lungs and central cavities (green circle) were removed. Analysis was restricted to central regions (orange box) to reduce susceptible artifacts in lateral arms. (C) Water-weighted tissues (magenta voxels) include skin, muscle, and lymph node cortex; fat-weighted tissues (blue voxels) include subscapular and axillary adipose tissue. The ratio of fat-to-muscle volume fraction was preserved from each side.
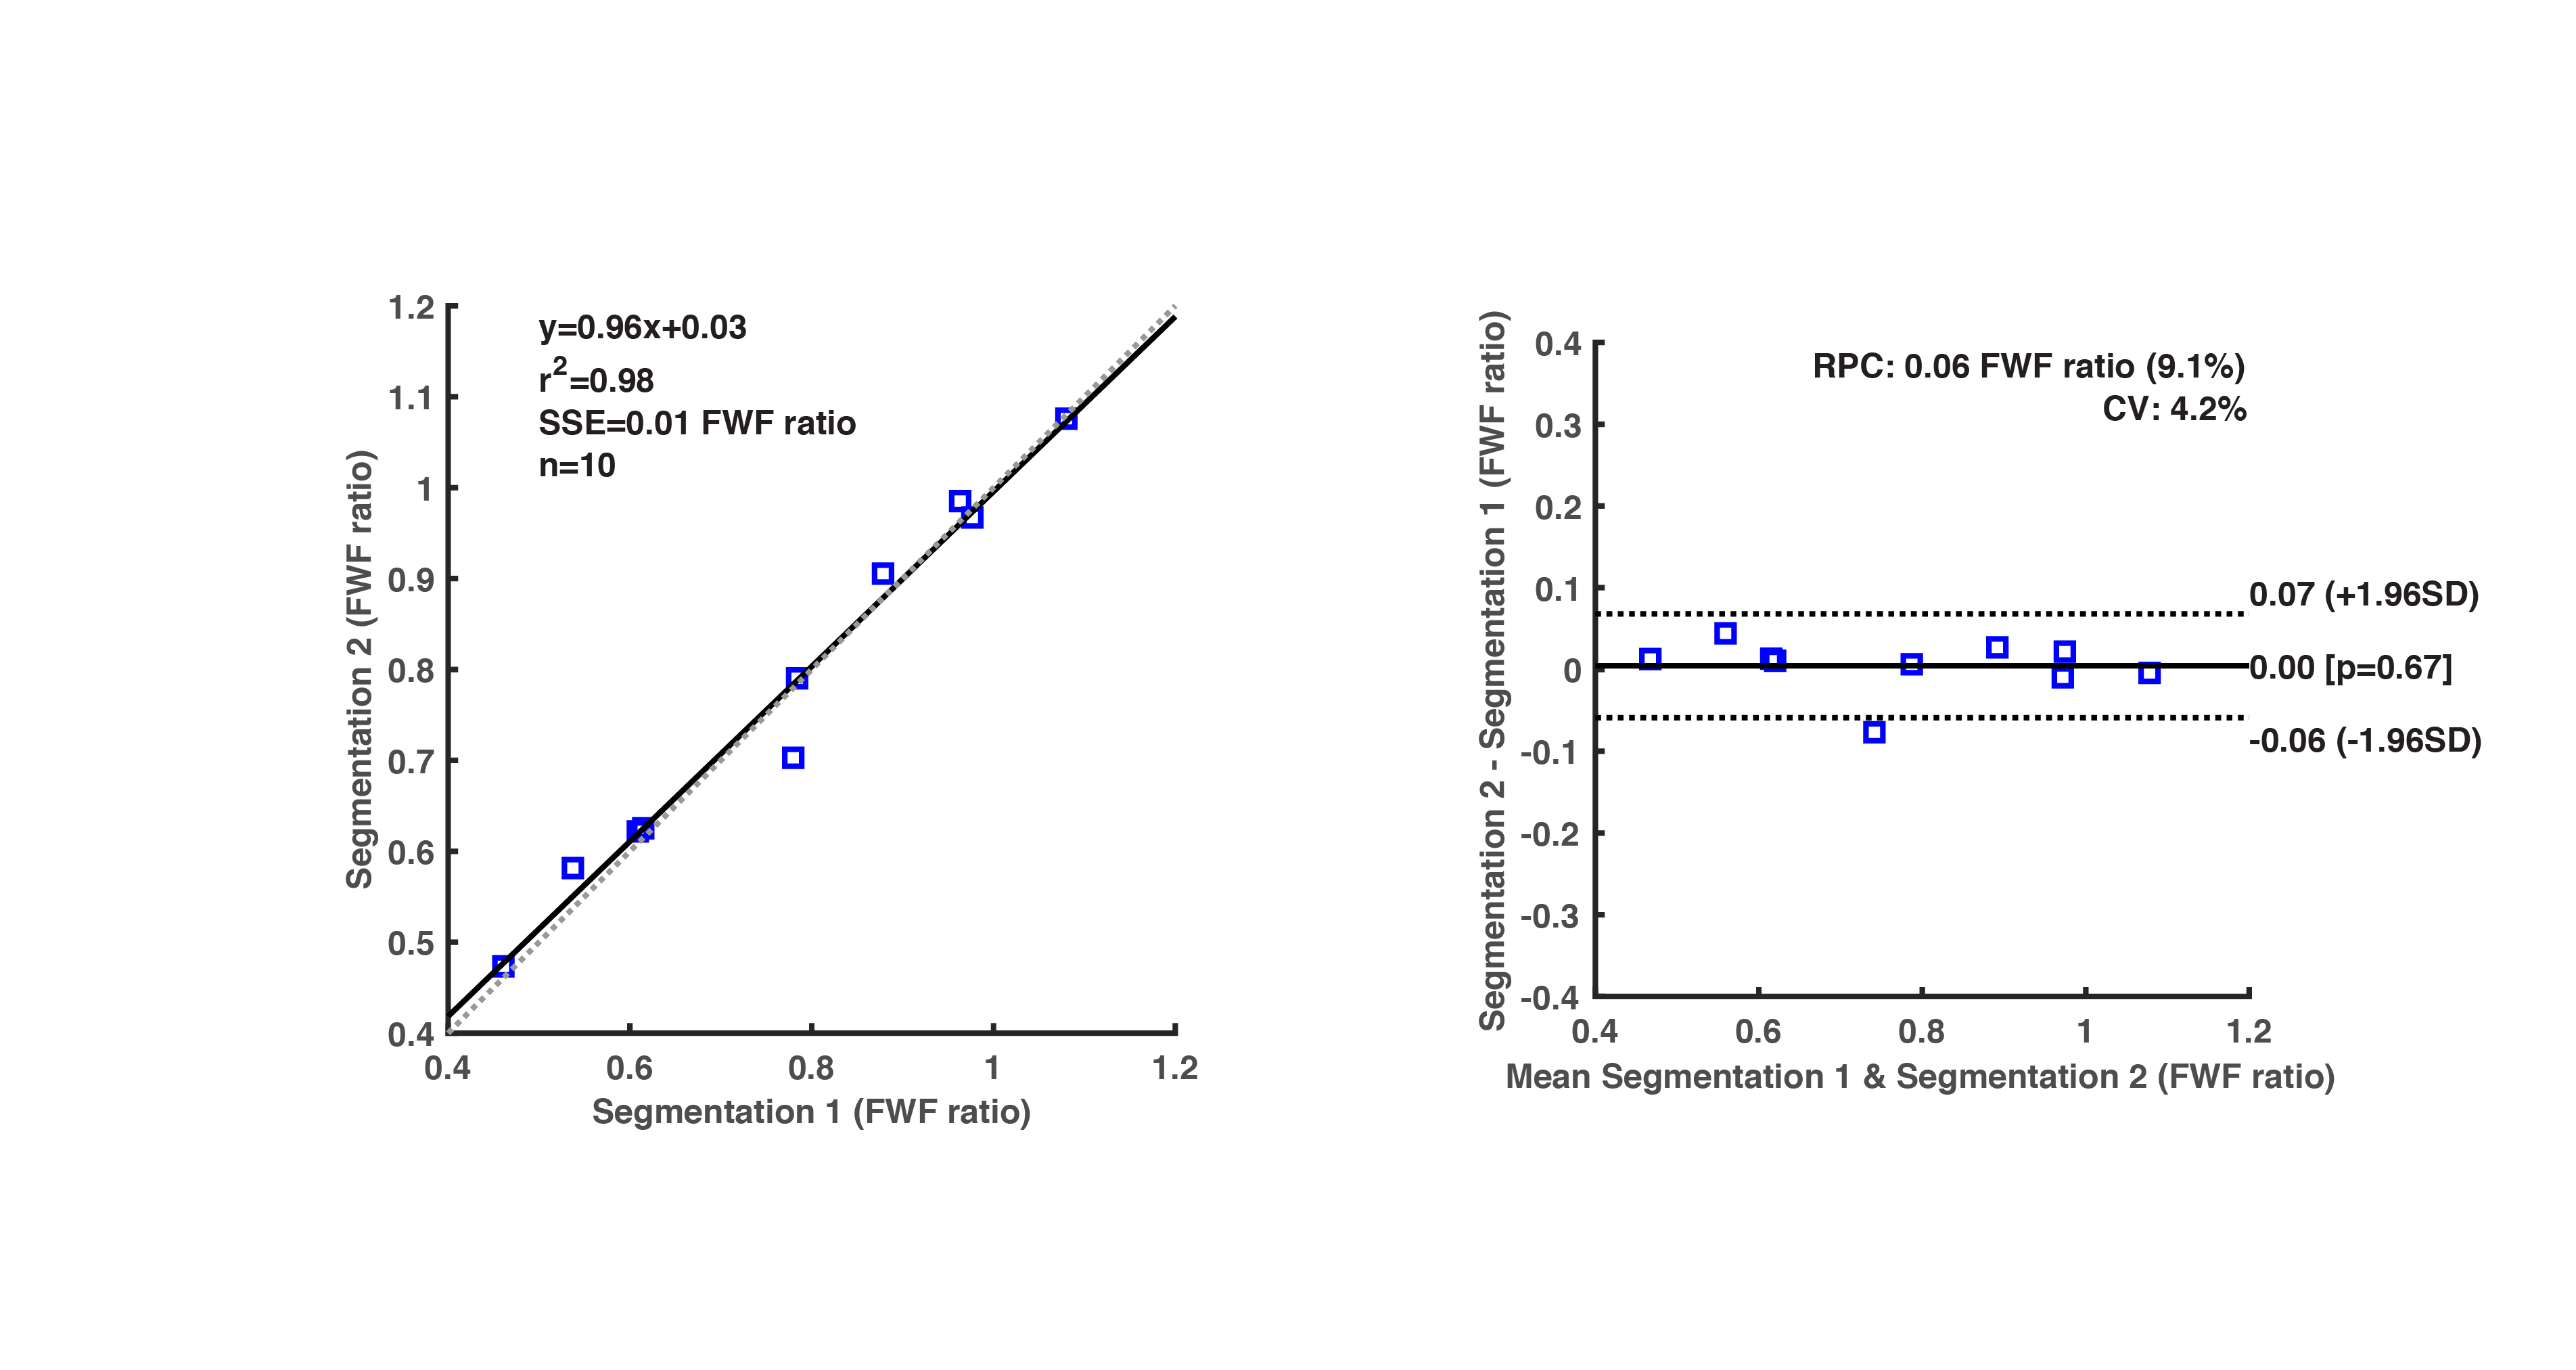
Figure 2. Repeatability of fat-water fraction (FWF) segmentation procedure. (Left) Linear regression reveals a high degree of correlation (Pearson coefficient=0.98; p<0.001) between FWF calculated values from two segmentation trials. (Right) Mean difference between scans, standard deviation of differences (SD), and repeatability coefficient (RPC= 1.96*SD) reported in a Bland-Altman analysis. FWF mean difference between segmentation 1 vs. 2 is 0.00 (FWF ratio), and RPC=±0.06 (FWF ratio).
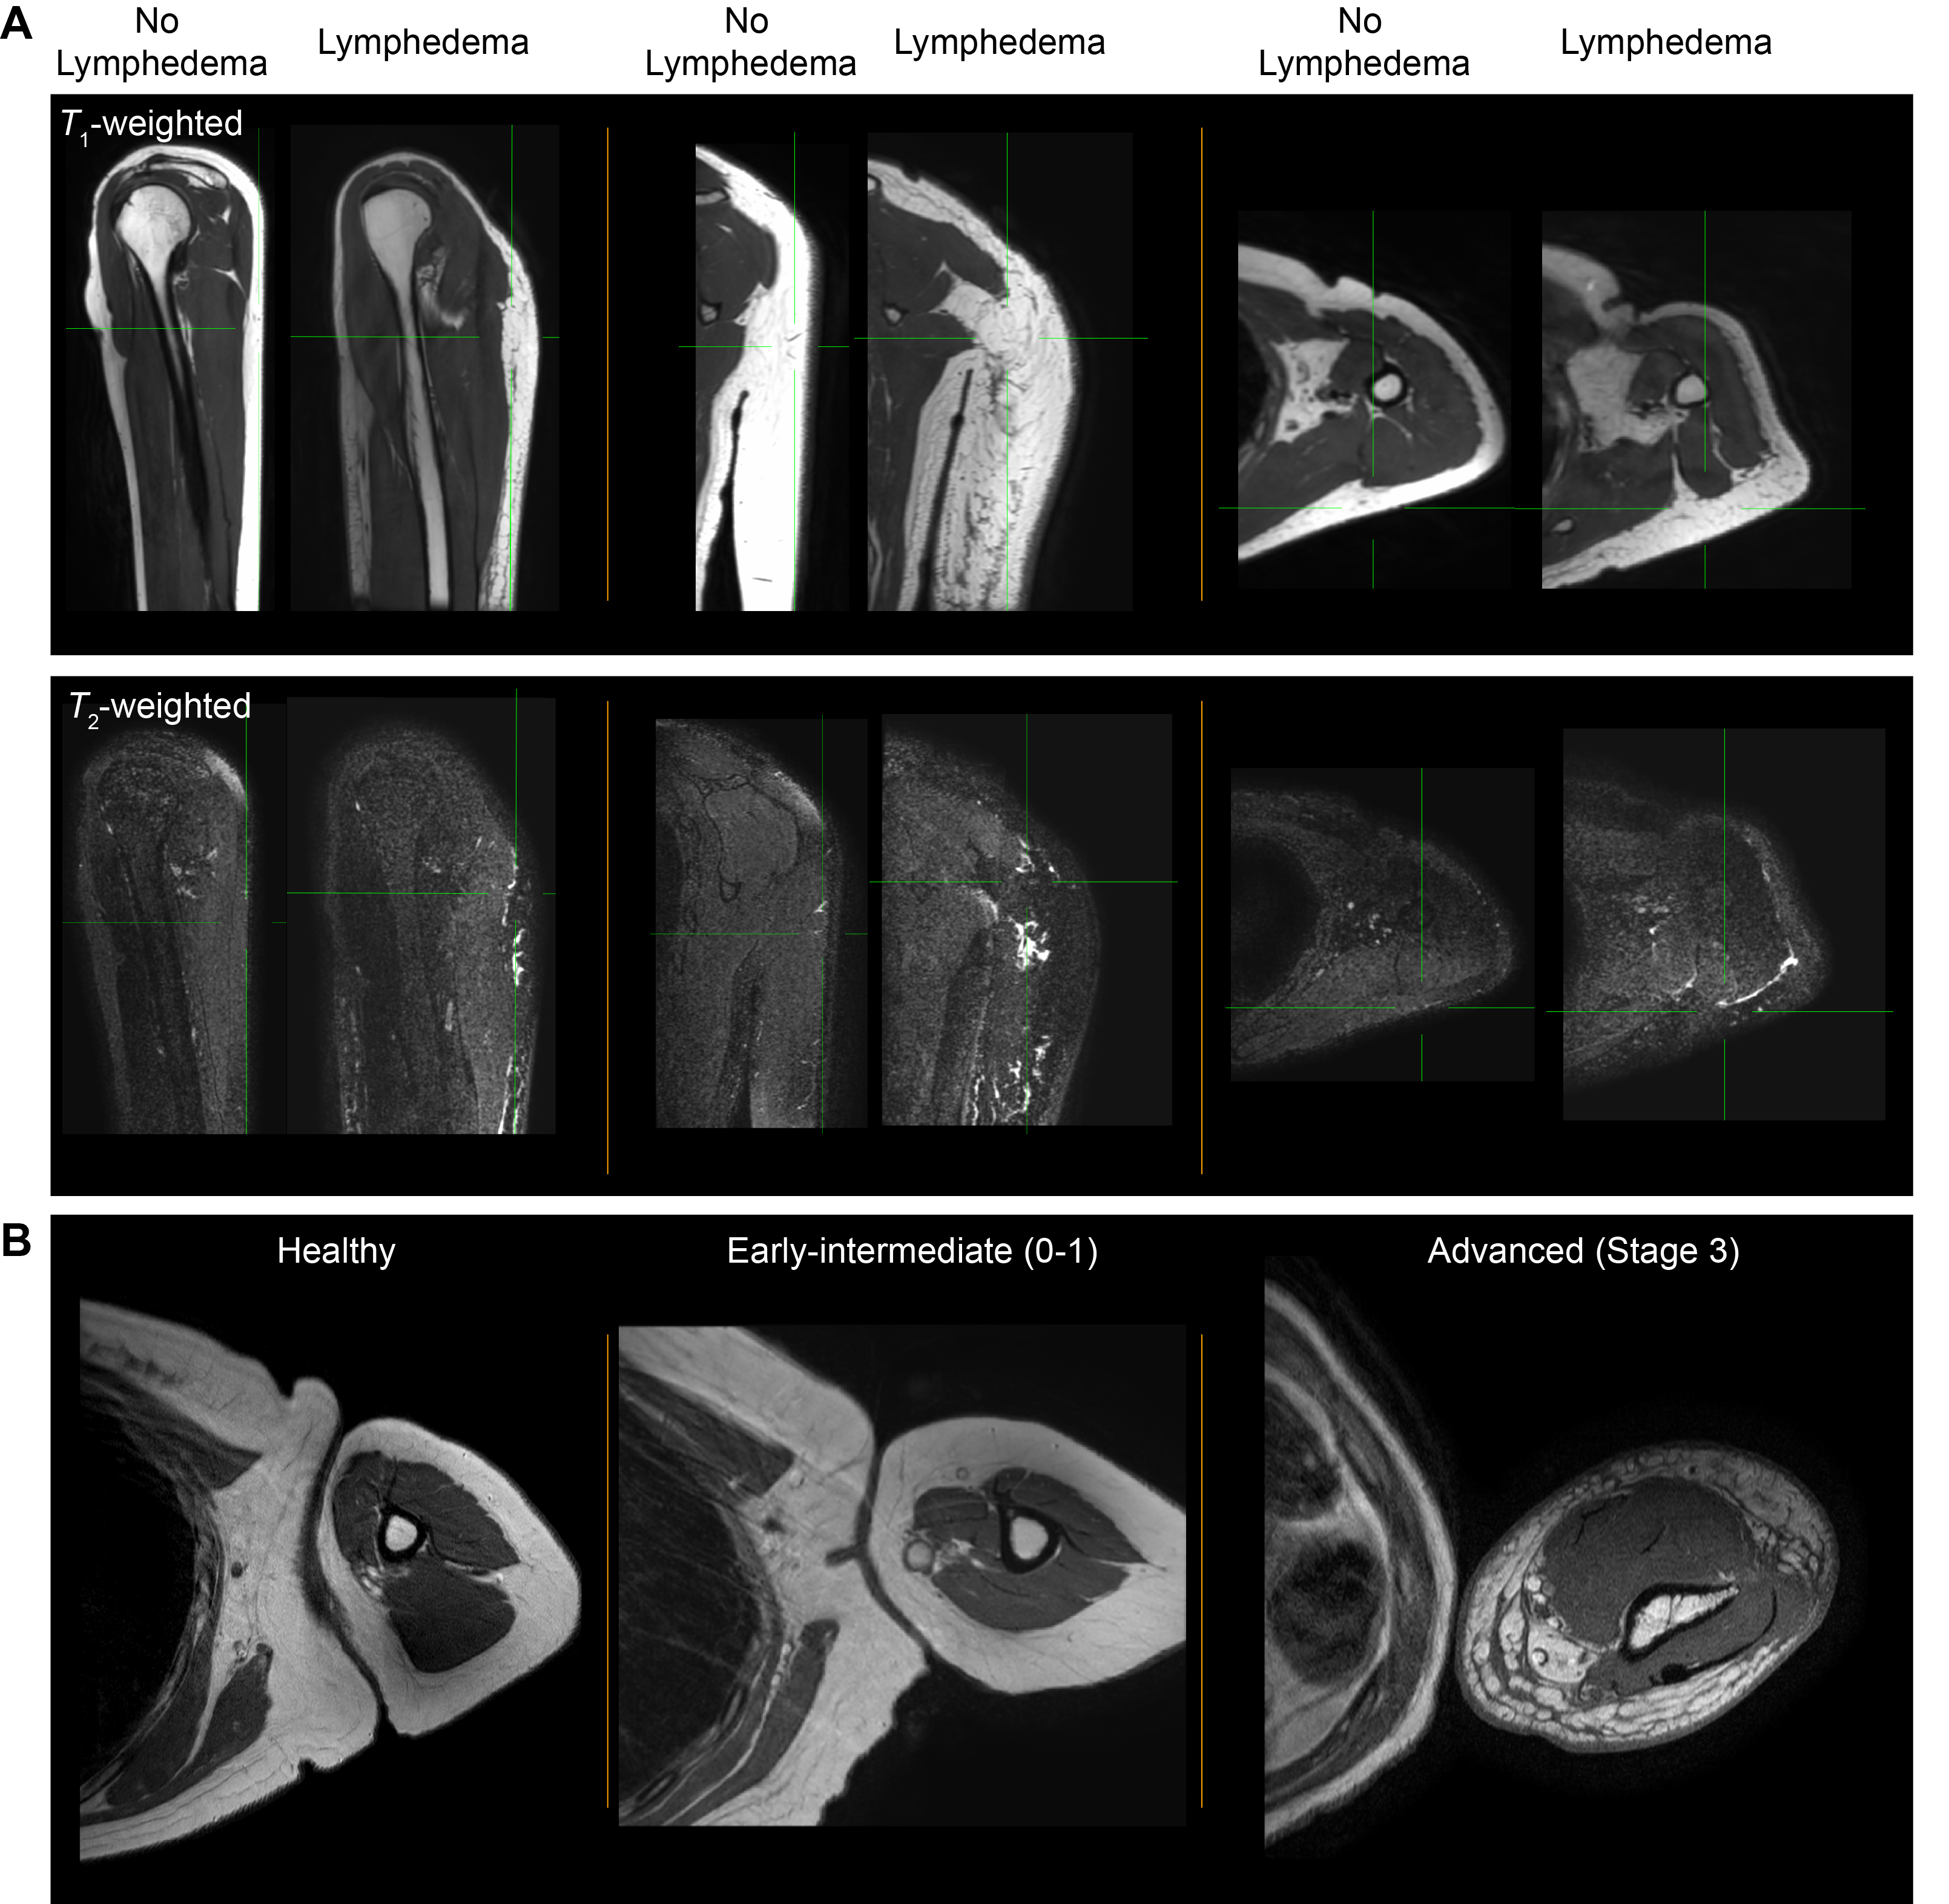
Figure 3. (A) Orthogonal T1-weighted MRI without fat saturation and T2-weighted MRI with fat saturation in a 35-year female (BMI=19.6) without and a 44 year female (BMI=21.2) with lymphedema. (B) Examples of fat and muscle profiles in a healthy participant and participants with secondary lymphedema. Fat-to-muscle fraction is frequently observed to be elevated in lymphedema compared to healthy participants, and regions of nodular adipose on T1-weighted MRI where fluid and fibrosis are frequently present in advanced lymphedema stages.
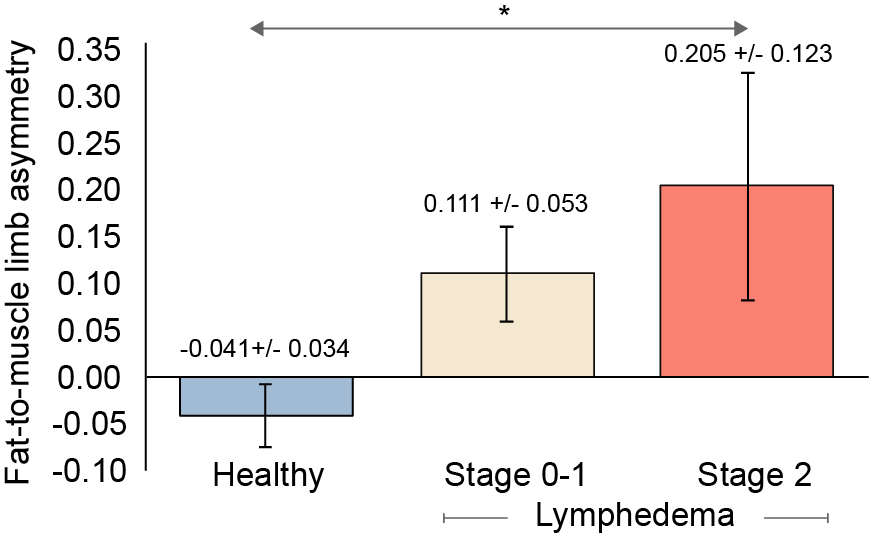
Figure 4. Fat-to-muscle limb asymmetry in healthy participants, and breast cancer treatment related lymphedema (BCRL) intermediate (Stage 0-1) and advanced (Stage 2) stage participants. The fat-to-muscle limb asymmetry is calculated as the fractional difference in the fat-to-muscle ratio in the involved vs. uninvolved arms of BCRL participants, or right vs. left arms in healthy participants. Mean values and standard errors are shown above. *ANOVA significance p<0.05.