0932
B0 inhomogeneity in the abdominal subcutaneous fat at 3T1Medical Physics, University of Wisconsin, Madison, WI, United States, 2Radiology, University of Wisconsin, Madison, WI, United States
Synopsis
B0 inhomogeneities often lead to failures in chemical shift-based fat suppression, particularly in complex susceptibility environments such as the abdomen. To optimize the application of fat suppression, characterization of B0 inhomogeneities in fat regions is needed. However, such characterization has not been reported for abdominal fat. Therefore, the purpose of this work was to measure the magnitude and variability of B0 inhomogeneity at 3T in abdominal subcutaneous fat. This study shows that several subcutaneous fat regions exhibit B0 inhomogeneities large enough to induce failures in common fat suppression methods. These measurements may guide future optimization of fat suppression methods.
Introduction
Fat suppression is important in many MR imaging settings, including diffusion MRI based on echo-planar imaging, where unsuppressed fat signals appear shifted due to the large chemical shift artifact, and may obscure the organs of interest. Chemical shift-based fat suppression (e.g., implemented through chemical shift selective methods, or spatial-spectral excitation pulses) is common in diffusion MRI and other applications. However, chemical shift-based fat suppression fails in the presence of substantial B0 inhomogeneities1. Fat suppression failures are common in practice, particularly in the presence of a complex magnetic susceptibility environment such as the abdomen, and often lead to non-diagnostic image quality2. Although alternative methods such as T1-based fat suppression have superior robustness to B0 inhomogeneities, these methods have substantial drawbacks, particularly in terms of signal-to-noise efficiency. Therefore, optimization of fat suppression methods involves a complex tradeoff based on the expected B0 inhomogeneities as well as other factors.To optimize abdominal fat suppression methods, a quantitative characterization of the B0 inhomogeneities in the abdominal fat regions is needed. However, such quantitative characterization has not been reported. Therefore, the purpose of this work is to measure the magnitude and variability of B0 inhomogeneity at 3T in abdominal subcutaneous fat.
Materials and Methods
Subjects: Our study relies on retrospective clinical exams at our institution, obtained with IRB approval. This data consists of B0 maps acquired in 40 patients (20 male, 20 female) presenting for standard clinical MRI exams with no pathology exclusion criteria3.B0 mapping data: Volumetric 3.0T B0 abdominal measurements (axial acquisitions covering the entire liver) were obtained from a quantitative multi-echo spoiled gradient-echo chemical shift encoding (CSE)-MRI method (IDEAL IQ) acquired as part of clinical standard of care. Scan parameters included: 42×42 cm2 FOV, 8mm slice thickness, 32 slices, 3° flip angle, 128 × 128 matrix size, ±83.33 kHz receiver bandwidth, with 6 echoes (TE1=0.8ms, dTE=0.825ms). A well validated CSE-MRI reconstruction (IDEAL IQ, GE Healthcare) was used to obtain co-localized proton density fat fraction (PDFF) maps, fat content maps, water content maps, and B0 field maps.
B0 measurements: For each subject, three representative axial slices were selected in the upper third, middle, and lower third of the liver.
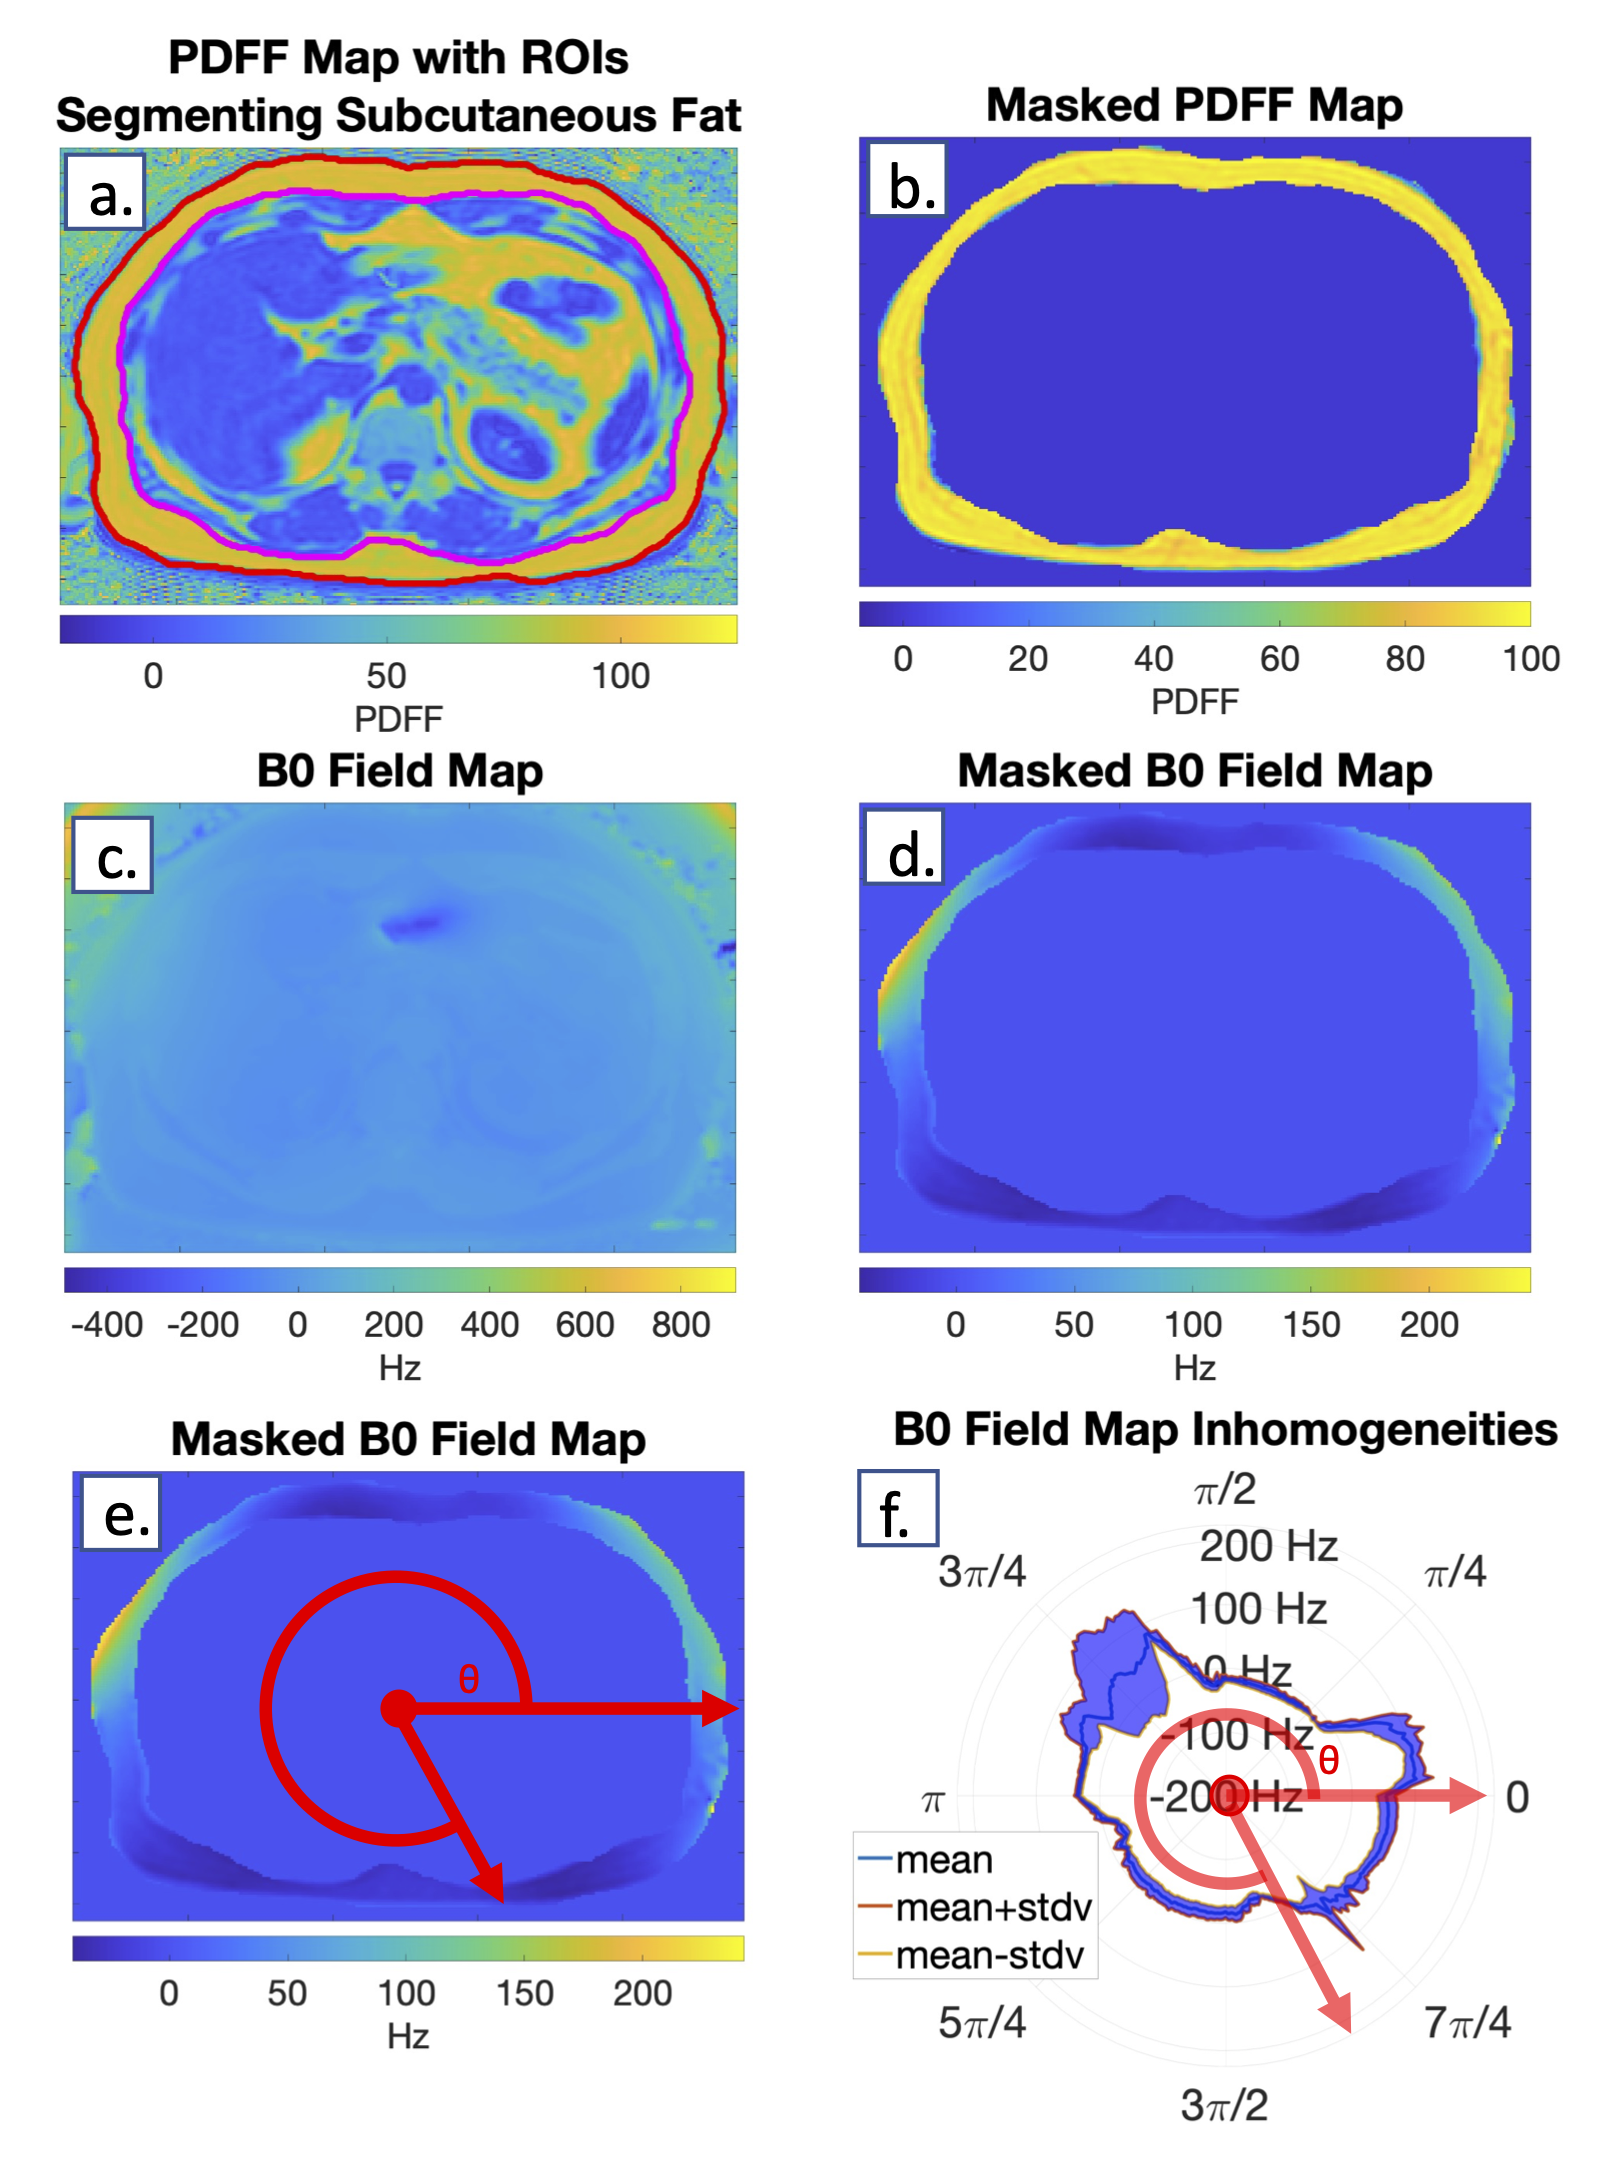
For each slice, a hand-drawn ROI segmented the subcutaneous fat region on the PDFF map (Figure 1a). The ROI was converted to a binary mask (Figure 1b) and applied to the co-localized B0 field map (Figure 1c) to enable B0 measurements throughout the subcutaneous fat (Figure 1d). B0 values at each angle around the abdomen were averaged across the subcutaneous fat thickness (Figure 1e,f), yielding a per-subject B0 mean and standard deviation (SD). Per-subject B0 mean values were averaged for the 20 men and 20 women (Figure 2).
Based on a 3T CHESS RF pulse bandwidth of 300Hz, or +/-150Hz4,5, we counted the number of subjects that had any mean B0 values outside of this suppression range.
Results
All 40 PDFF and B0 field maps were successfully retrieved and analyzed and had no major artifacts. A smoothly changing B0 field map across the S/I dimension in the subcutaneous fat (not shown) suggests that the proposed three-slice analysis is sufficient to adequately describe the variation of B0 throughout the entire liver (Figure 2).Overall, 25% of exams (10/40 total, 5/20 men, 5/20 women) had a B0 mean magnitude greater than 187.5Hz in at least one location in the subcutaneous fat. Figure 2 demonstrates that the regions corresponding most closely to the anatomic location of the liver (along the right lateral and anterolateral aspect of the abdomen at 5π/4 - 7π/8) have the highest standard deviation of B0 across both male and female cohorts, and thus the greatest magnitude B0 inhomogeneity.
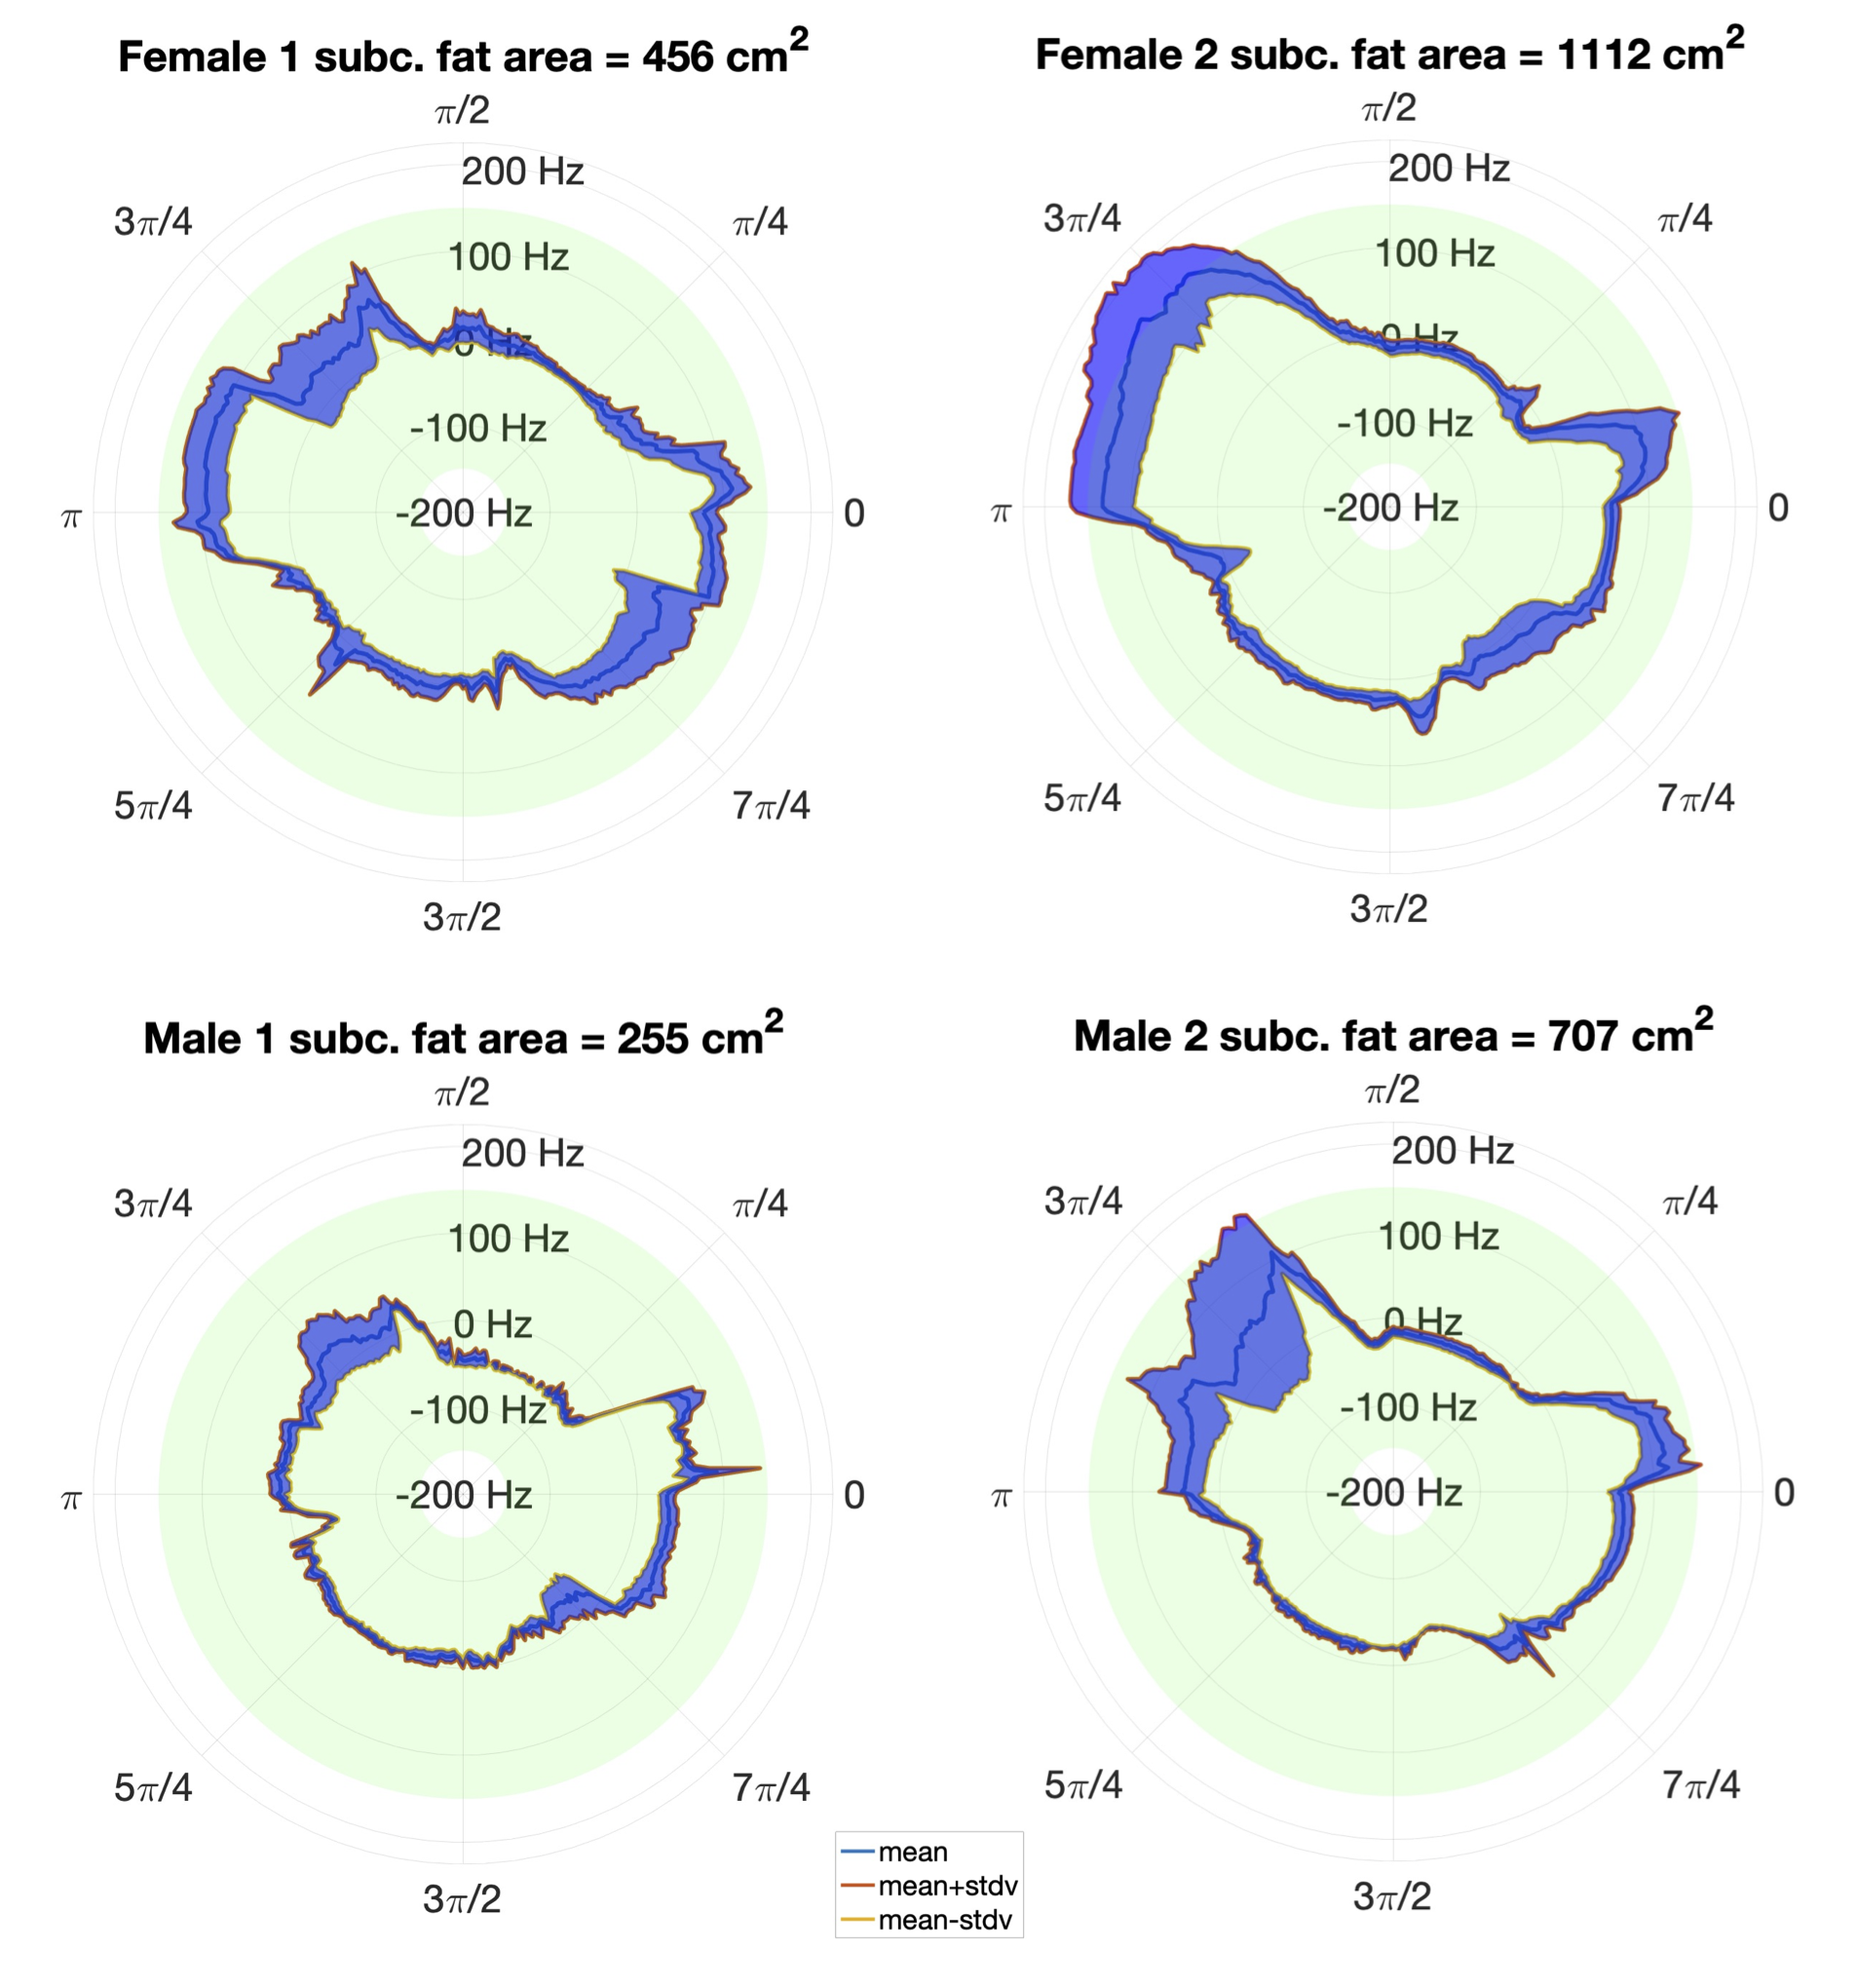
Subjects with thicker subcutaneous fat layer generally had higher B0 inhomogeneity and standard deviation (Figure 3), leading to more likely fat suppression failures in these subjects using conventional chemical shift-based methods.
Discussion
This study measured B0 field inhomogeneity in the subcutaneous fat within clinical exams at 3T. Based on these data, several regions exhibit B0-based off-resonance large enough to cause common chemical shift-based fat suppression methods to fail. These data may be particularly important to guide optimization of fat suppression in abdominal diffusion MRI, where fat suppression failures often lead to fat signal overlapping the organs of interest.Some limitations of this study the analysis of retrospective data from only 40 subjects at a single center and single vendor. Additionally, B0 measurements were obtained in the subcutaneous fat but not visceral fat or other organs. Measurement of B0 in the visceral fat would be highly feasible, however subcutaneous fat tends to present higher B0 inhomogeneities in practice, due to its distance from isocenter and proximity to tissue/air interfaces. B0 measurements in the liver were recently reported3.
In conclusion, large B0 inhomogeneities are consistently found in regions within the subcutaneous fat during clinical liver imaging. These B0 inhomogeneities often lead to failed fat suppression in various abdominal acquisitions, particularly diffusion MRI. Characterization of these B0 inhomogeneities, as provided in this work, may guide the implementation of optimized fat suppression methods in future works.
Acknowledgements
We wish to acknowledge support from the NIH (R01EB030497), UW Department of Radiology, and the Clinical and Translational Science Award of the NCATS/NIH. Further, we wish to acknowledge GE Healthcare who provides research support to the University of Wisconsin.References
1. Del Grande, F., Santini, F., Herzka, D. A., Aro, M. R., Dean, C. W., Gold, G. E., & Carrino, J. A. (2014). Fat-suppression techniques for 3-T mr imaging of the musculoskeletal system. RadioGraphics, 34(1), 217–233. https://doi.org/10.1148/rg.341135130
2. Haase, A., Frahm, J., Hanicke, W., & Matthaei, D. (1985). 1H NMR chemical shift selective (chess) imaging. Physics in Medicine and Biology, 30(4), 341–344. https://doi.org/10.1088/0031-9155/30/4/008
3. Roberts, N. T., Hinshaw, L. A., Colgan, T. J., Ii, T., Hernando, D., & Reeder, S. B. (2020). B 0 and B 1 inhomogeneities in the liver at 1.5 T and 3.0 T. Magnetic Resonance in Medicine, 85(4), 2212–2220. https://doi.org/10.1002/mrm.28549
4. Krafft, A. J., Loeffler, R. B., Song, R., Bian, X., McCarville, M. B., Hankins, J. S., & Hillenbrand, C. M. (2015). Does fat suppression via chemically selective saturation affect R2*-Mri for transfusional iron overload assessment? A clinical evaluation at 1.5T and 3T. Magnetic Resonance in Medicine, 76(2), 591–601. https://doi.org/10.1002/mrm.2586
5.
Kuroda, K., Oshio, K., Mulkern, R. V., & Jolesz, F. A.
(1998). Optimization of chemical shift selective suppression of fat. Magnetic
Resonance in Medicine, 40(4), 505–510.
https://doi.org/10.1002/mrm.1910400402
Figures