0930
Semi-Quantitative Analysis of Dynamic Contrast-Enhanced Magnetic Resonance Lymphangiography in the Legs of Primary Lymphoedema Patients
Michael Mills1, Malou Van Zanten1, Julian Pearce2, Bernard Ho2, Kristiana Gordon1,2, Peter S Mortimer1,2, Pia Ostergaard1, and Franklyn A Howe1
1St George's University of London, London, United Kingdom, 2St George's University Hospitals NHS Foundation Trust, London, United Kingdom
1St George's University of London, London, United Kingdom, 2St George's University Hospitals NHS Foundation Trust, London, United Kingdom
Synopsis
Despite its prevalence, methods for investigating lymphoedema (chronic tissue swelling due to abnormal lymphatic functioning) remain limited. Dynamic Contrast-Enhanced Magnetic Resonance Lymphangiography (DCE-MRL) allows identification of lymph vessels in both healthy and lymphoedematous limbs, however quantitative analyses are lacking. DCE-MRL data was acquired for 30 minutes in lymphoedematous (n=7) and healthy limbs (n=4), with estimates of lymphatic vessel signal characteristics compared between groups. Maximum enhancement compared to baseline was significantly increased in healthy volunteers, while other metrics were similar. Larger groups and longer imaging sessions are likely required to detect additional differences.
Introduction
The lymphatic system is a whole-body vascular network involved in tissue fluid homeostasis and immunity. Failure of the lymphatic system leads to accumulation of fluid within tissues (Lymphoedema), a condition estimated to affect at least 400,000 people in the UK and 250 million people worldwide1,2, typically within the limbs (Figure 1). Imaging is being increasingly used to study the lymphatics, both in the clinic and research. Dynamic Contrast-Enhanced Magnetic Resonance Lymphangiography (DCE-MRL) has been shown capable of depicting the lymphatic vasculature in the limbs of lymphoedema patients and healthy volunteers with improved spatial and temporal resolution to the more commonly applied radionuclide imaging technique (lymphoscintigraphy)3,4. Lymphoscintigraphy can estimate lymphatic transport quantitatively however, while DCE-MRL is mostly qualitative. In this feasibility study we derive semi-quantitative measurements, similar to those previously employed in DCE-MRI studies5, in enhancing lymphatic vessels (LV) in the legs of primary lymphoedema patients (PL) with a known or presumed genetic abnormality, and healthy volunteers (HV).Methods
Fat suppressed (SPAIR) DCE-MRL images were obtained pre and post-contrast with a 3D T1-weighted (spoiled gradient echo, TR/TE/FA = 3.7/1.6 ms/12o) sequences on a 3.0 T system and 16-element torso coil. Contrast was delivered intradermally to the inter-digital spaces after moving the participant through the scanner bore to expose the feet. DCE imaging commenced after injection. From a set of 22 datasets acquired as part of a larger study, the legs of 9 participants (two HV and seven PL) are included here. Inclusion criteria were: ≥ 30 minutes DCE-MRL leg data available in which at least one anteromedial lymph vessel could be clearly identified6, administered contrast agent concentration = 0.225M, and a reconstructed voxel size ~ 0.7 x0.7 x0.7 mm. Imaged region and imaging time varied somewhat across participants; a volume covering from ankle to knee and volume acquisition time ~ 3 minutes were typical. Images were split into left and right limb; the limb best demonstrating an anteromedial LV being included for further analysis. Two participants with unilateral lymphoedema had both limbs analysed, the unaffected limb being considered healthy. Hence, n = 7 and 4 for lymphoedematous and healthy limbs respectively. Prior to further analysis, images were registered to reduce motion and increase lymphatic conspicuity. Elastic registration to the first post-contrast volume (PC1) was performed as this method proved superior when various processing pipelines were compared for healthy legs (unpublished data). Signal was measured in 3 voxel3 regions centered over a lymphatic vessel just superior to the ankle (Figure 2), and adjacent normal appearing muscle, using ImageJ (version 1.53c). Peak signal ($$$SI_{peak}$$$), time to peak signal ($$$T_{peak}$$$), peak enhancement rate: $$PER = Max\Bigl(\frac{SI_{k+1} - SI_{k}}{\Delta T}\Bigr) $$ and maximum enhancement ratio: $$MER = Max\Bigl(\frac{SI_{k}}{SI_{1}}\Bigr) $$ were estimated, where $$$S_{k}$$$ indicates the signal measured in dynamic $$$k$$$. Analogous values scaled by the muscle signal ($$$S_{m}$$$) were computed to account for signal drift. $$$T_{peak}$$$ was estimated in minutes post injection and $$$PER$$$ in signal units per minute. Statistical comparisons between groups were made with a two-sample t-test (unequal variance). p < 0.05 was considered significant.Results
PL participants demonstrated multiple torturous and enlarged LVs extending from ankle to knee, while few small LVs could be seen in HV legs (Figure 3). $$$MER$$$ was significantly higher in healthy limbs compared to lymphoedematous limbs with mean ± standard deviation = 2.07 ± 0.17 and 1.66 ± 0.35 respectively (p = 0.03). Normalising by $$$S_m$$$ resulted in similar values: 2.04 ± 0.13 and 1.66 ± 0.36 (p = 0.03). $$$SI_{peak}$$$ was higher in affected individuals both when raw and normalised signals were obtained, however these differences were not significant. Peak enhancement rates were similar between groups, as were $$$T_{peak}$$$ times (see Table 1 for detail). Most cases (4/7 affected limbs, 3/4 healthy limbs) peaked in the final phase of imaging ($$$T_{max}$$$) when the raw signal was interrogated. Dividing by $$$S_{m}$$$ reduced $$$T_{peak}$$$, with only 3/7 affected limbs and 1/4 healthy limbs peaking at $$$T_{max}$$$.Discussion
DCE-MRL was completed successfully in both PL and HV participants, however the pre-contrast volume was deemed unsuitable as a reference image for registration due to coil and participant repositioning following contrast administration, hence the use of PC1 throughout. Signal was often increasing at 30 mins suggesting longer imaging times are necessary. Though a different technique, UK guidelines recommend lymphoscintigram acquisitions up to 3 hours post radionuclide administration7. Interestingly, for all PL cases diagnosed with a FOXC2 gene mutation (n=3) signal peaked within 30 mins; mean = 17:56 mins for raw signal and 18:55 when normalised (see Figure 5 for an example of healthy and FOXC2 PL uptake curves). FOXC2 mutations are associated with venous valve insufficiency and show early drainage on lymphoscintigraphy8. Our results suggest similar behavior in CE-MRL studies may also occur.Lymph vessels are typically easier to identify in lymphoedematous limbs and showed higher peak signal here. Significantly larger differences in peak signal compared to baseline ($$$MER$$$) were measured in healthy limbs; potentially a result of typically faster lymphatic clearance in healthy limbs9,10.
Conclusion
DCE-MRL depicts lymphatic vessels in both Lymphoedematous and healthy legs, with enhancement characteristics showing differences between groups. For many participants 30mins of imaging may be insufficient to characterise signal behaviour fully however.Acknowledgements
Research supported by the British Heart Foundation and Medical Research CouncilReferences
- Lymphoedema Support Network (LSN). https://www.lymphoedema.org/.
- Sleigh, B. C. & Manna, B. Lymphedema. StatPearls [Internet] [updated 2020 Apr 27] https://www.ncbi.nlm.nih.gov/books/NBK537239/ (2020).
- Mills, M. et al. Systematic Review of Magnetic Resonance Lymphangiography From a Technical Perspective. J. Magn. Reson. Imaging 53, 1766–1790 (2021).
- Miseré, R. M. L., Wolfs, J. A. G. N., Lobbes, M. B. I., van der Hulst, R. R. W. J. & Qiu, S. S. A systematic review of magnetic resonance lymphography for the evaluation of peripheral lymphedema. J. Vasc. Surg. Venous Lymphat. Disord. 8, 882-892.e2 (2020).
- Gordon, Y. et al. Dynamic contrast-enhanced magnetic resonance imaging: fundamentals and application to the evaluation of the peripheral perfusion. Cardiovasc. Diagn. Ther. 4, 147–14764 (2014).
- Shinaoka, A. et al. Lower-limb lymphatic drainage pathways and lymph nodes: A CT lymphangiography cadaver study. Radiology 294, 223–229 (2020).
- Vinayakamoorthy, V. & Fowler, C. British Nuclear Medicine Society - Lymphoscintigraphy Guidelines. (2018).
- Mellor, R. H. et al. Mutations in FOXC2 are strongly associated with primary valve failure in veins of the lower limb. Circulation 115, 1912–1920 (2007).
- Borri, M. et al. Quantitative Contrast-Enhanced Magnetic Resonance Lymphangiography of the Upper Limbs in Breast Cancer Related Lymphedema: An Exploratory Study. Lymphat. Res. Biol. 13, 100–106 (2015).
- Liu, N.-F., Lu, Q., Jiang, Z.-H., Wang, C.-G. & Zhou, J.-G. Anatomic and functional evaluation of the lymphatics and lymph nodes in diagnosis of lymphatic circulation disorders with contrast magnetic resonance lymphangiography. J. Vasc. Surg. 49, 980–987 (2009).
Figures
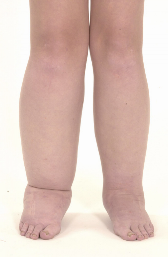
Figure 1. Lower Limbs of a patient with lymphoedema distichiasis, a primary
lymphoedema resultant from a FOXC2 gene mutation, clearly displaying the limb
swelling.
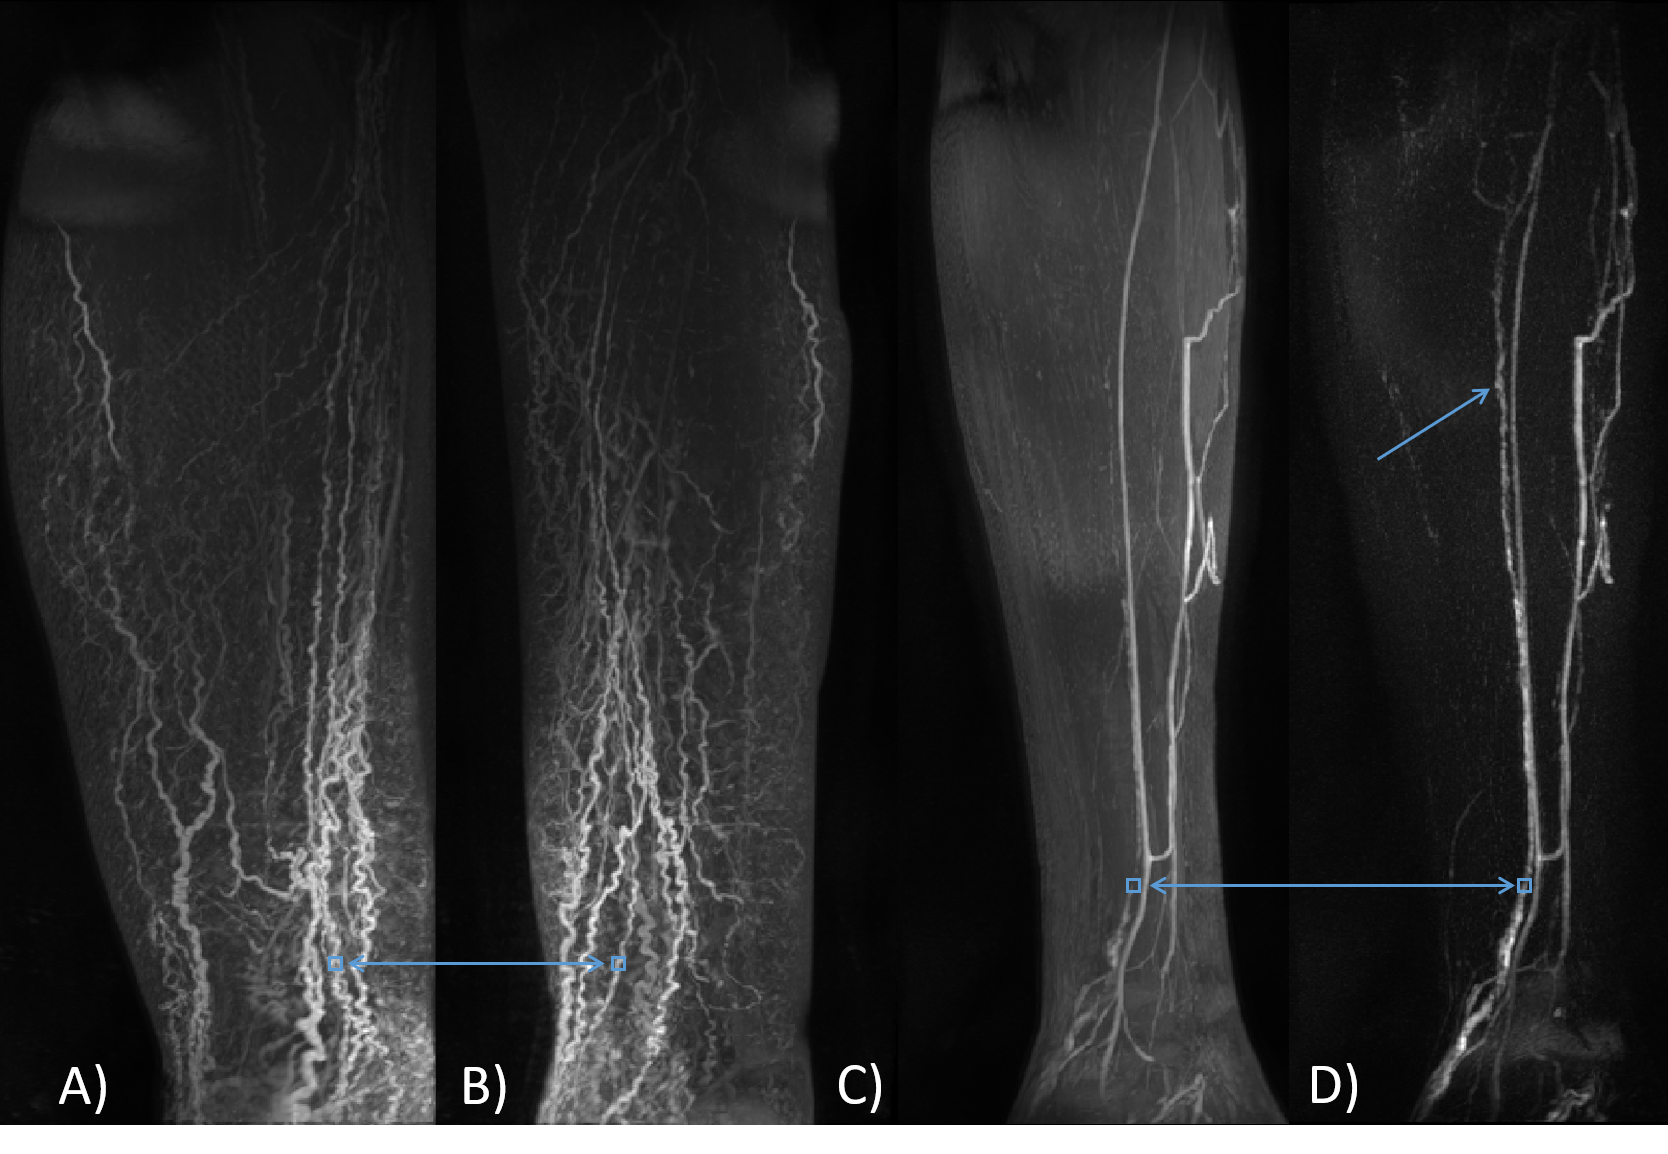
Figure 2 Example locations of regions of interest (blue boxes). Frame A and B show the
approximate ROI location for a lymphoedema participant (FOXC2 genotype) on
coronal (A) and sagittal (B) maximum intensity projections (MIP) over the
entire time course. Frame C and D are sagittal oblique projections in a healthy
limb. In the subtraction image (D) the lymph vessel, in which signal was
measured, can be seen extending up the limb more clearly than in the unsubtracted MIP shown in C (single blue
arrow). ROI size exaggerated for clarity.
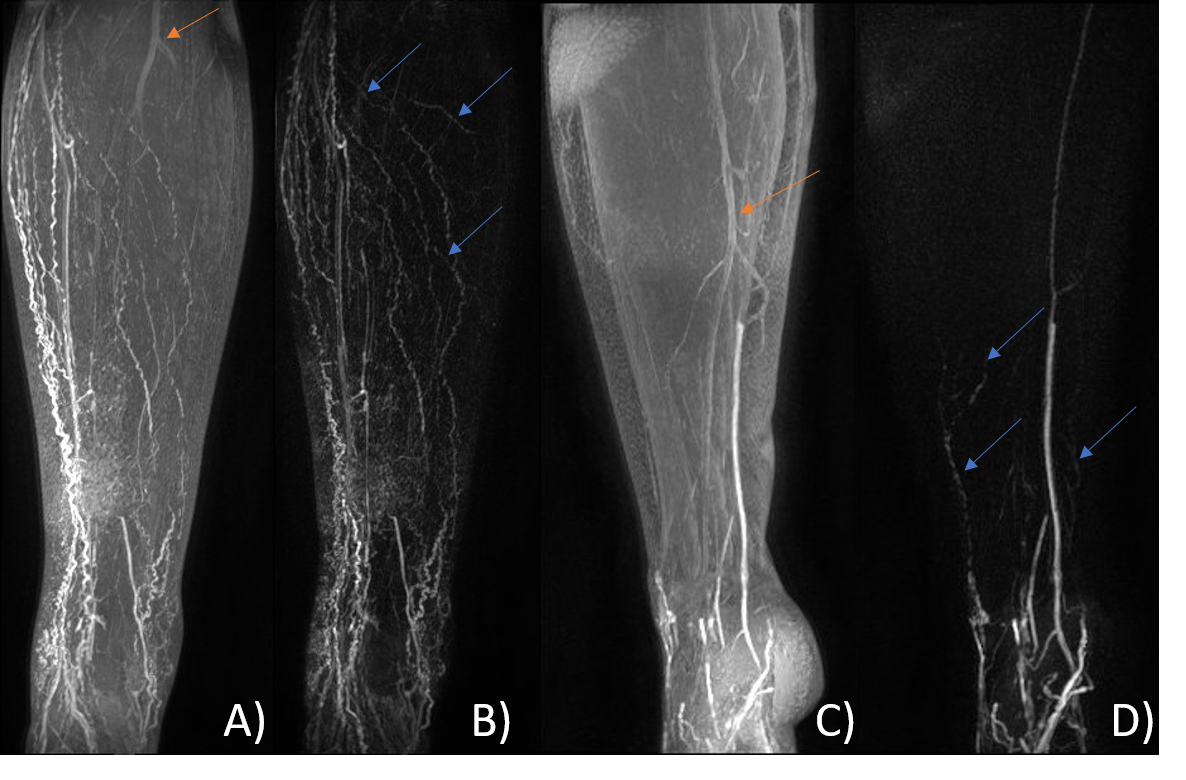
Figure 3 Lower limb coronal Maximum Intensity Projections of the right leg
of a Lymphoedema patient with a FOXC2 genotype (A, B) approximately 23 minutes post-contrast injection and left leg of a healthy
volunteer (C, D) 15 minutes post-injection. Multiple tortuous lymphatic vessels are evident in A, with more emerging
after subtraction (blue arrows, frame B). Lymphatic vessels are barely seen in
C, becoming evident after subtraction (blue arrows, frame D). Subtraction
images also remove unwanted arterial signal (orange arrows). A-B and C-D shown
with identical window/level.
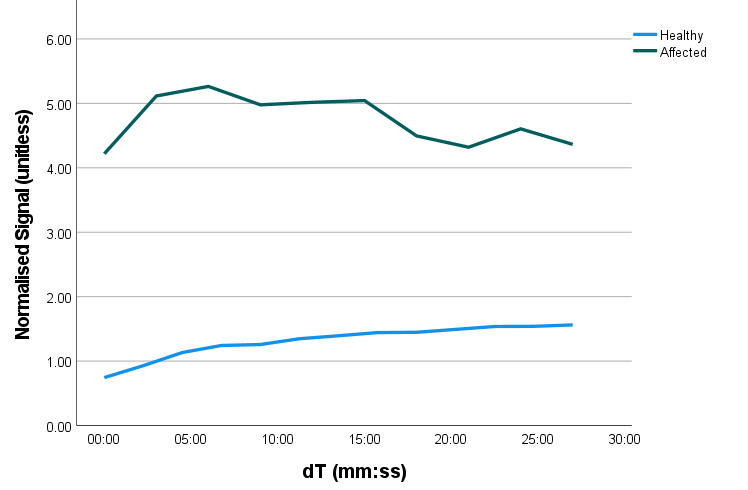
Figure 4 Signal uptake curves, normalised
by local muscle signal, measured in 3 x 3 x 3 voxel regions in lymphatic
vessels just superior to the ankle in an unaffected (blue) and a lymphoedema
(FOXC2 gene mutation) participant (green). In the healthy individual, peak
signal occurred in the final imaging frame and shows a smooth upward trajectory,
while for the lymphoedema participant the peak signal occurred shortly after
imaging began and greater signal variation is seen across the series.
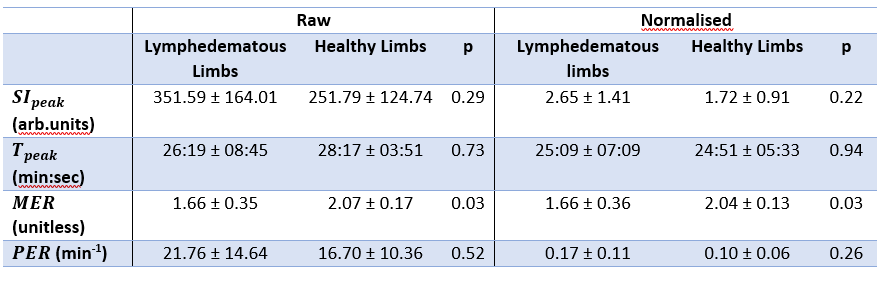
Table
1 Summary of semi-quantitative measurements estimated
within lymph vessels in the inferior aspect of healthy (n=4) and lymphoedematous (n=7) legs. Peak signal intensity (SIpeak), time to peak (Tpeak) and peak enhancement rate (PER) were similar between groups, both for raw signal and
following division of normal appearing muscle signal. Maximum enhancement ratio
(MER) was significantly higher in healthy volunteers (p<0.05) when compared
with a two-sample t-test however.
DOI: https://doi.org/10.58530/2022/0930