0929
Targeted Metabolomic Profiling of Blood Plasma in Aggressive Prostate Cancer Patients using NMR Spectroscopy1Department of NMR & MRI Facility, All India Institute of Medical Sciences, New Delhi, India, 2Department of Urology, All India Institute of Medical Sciences, New Delhi, India, 3Department of Pathology, All India Institute of Medical Sciences, New Delhi, India, 4Department of Radio-diagnosis, IRCH, All India Institute of Medical Sciences, New Delhi, India, 5Dept. of Radiology, Chettinad Academy of Research, Kelambakkam, Tamil Nadu, India
Synopsis
Gleason score (GS) is currently clinical predictor of prostate cancer (PCa) mortality. The present study investigates the metabolic profile of blood plasma for distinguishing aggressive PCa patients from non aggressive using targeted 1H-NMR metabolomics. A significantly higher concentration of lactate, pyruvate, choline, dimethylamine, glucose, betaine and lower concentration of leucine, isoleucine, valine, histidine, phenylalanine, and tyrosine were observed in patients with GS 8-10 as compared to patients with GS 7 and 6. Our results suggested that pathway alterations, amino acids, phospholipids and glucose related to PCa progression. Identifying biomarker/s associated with GS can be improved diagnosis and treatment.
INTRODUCTION
Prostate cancer (PCa) is the most frequently diagnosed adenocarcinoma in men over the age of 50 years1. The elevated prostate specific antigen (PSA) level and/or abnormal digital rectal examination (DRE) are used for diagnosis of PCa. These techniques have limitation in identifying non aggressive tumor from aggressive tumor, because of their low sensitivity and specificity. Gleason score (GS) is currently the clinical predictor of PCa specific-mortality. Identifying biomarkers associated with Gleason score can improve diagnosis and treatment of aggressive PCa. Thus, the present study based on 1H-NMR investigates the differences in metabolic profiling of plasma of PCa patients having different grade of GS such as 3+3, 3+4, 4+3, 4+4, 4+5 and 5+5 to determining potential biomarker/s for improve monitoring and treatment of the PCa.METHODS
Blood samples were collected from 67 PCa patients having [GS 3+3 =30, 3+4 & 4+3 =19, 4+4 & 4+5, 5+5 =18], in morning pre-prandial after overnight fasting. An informed consent was taken and study was approved by institute ethics committee. Proton NMR spectroscopy of the blood plasma samples was carried out at 700 MHz (Agilent, U.S.A.) using one dimensional (1D) CPMG sequence with pre-saturation. The parameters for 1D experiment: spectral width, 12 ppm; data points, 32 K; number of scans, 64; spin echo delay (τ), of 15 ms and a relaxation delay of 70s. The data was processed using the Vnmrj 2.3 A. Univariate and multivariate analysis was carried out using MetaboAnalyst 5.0. For comparison between the two groups, unpaired Mann-Whitney U test was carried out using SPSS software. A p-value <0.05 was considered as significant. Both univariate (receiver operating characteristics (ROC) curve analysis) and multivariate analyses (orthogonal partial least squares–discriminant analyses OPLS-DA, variable importance to projection, VIP score) and pathway analysis were carried.RESULTS
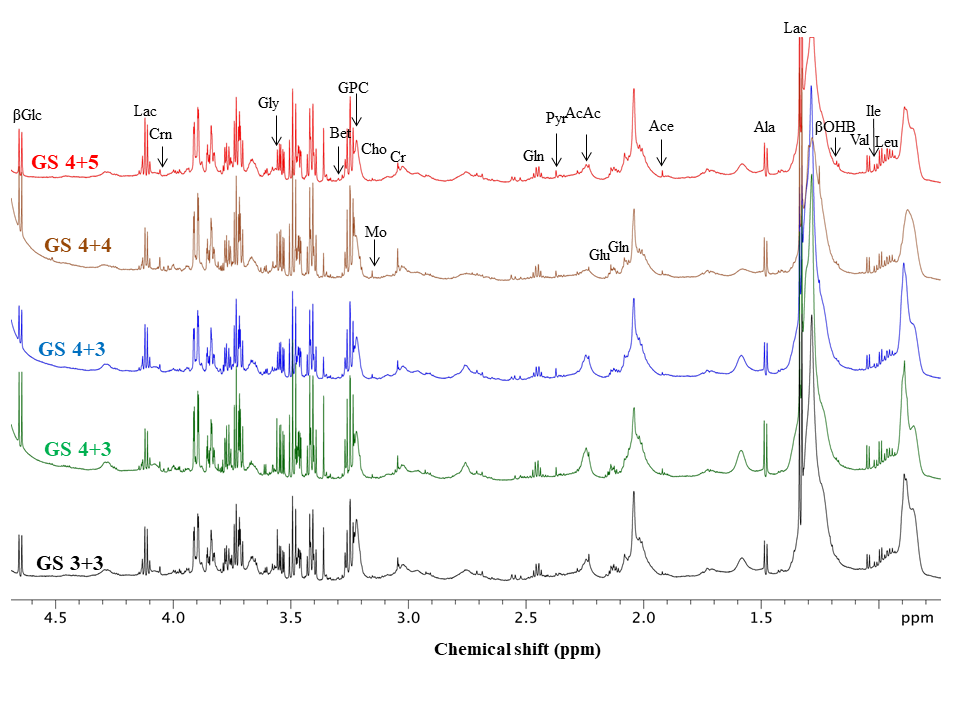
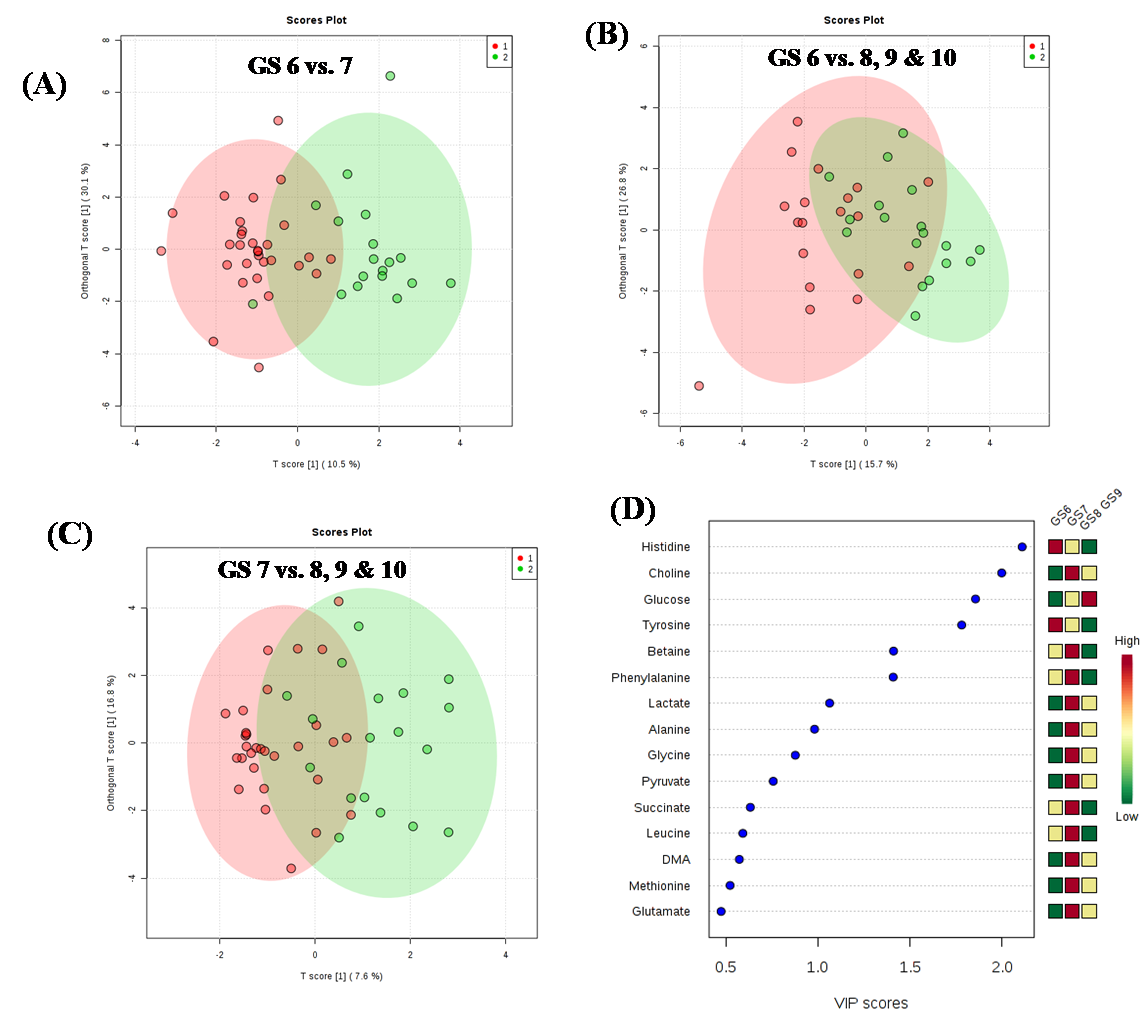
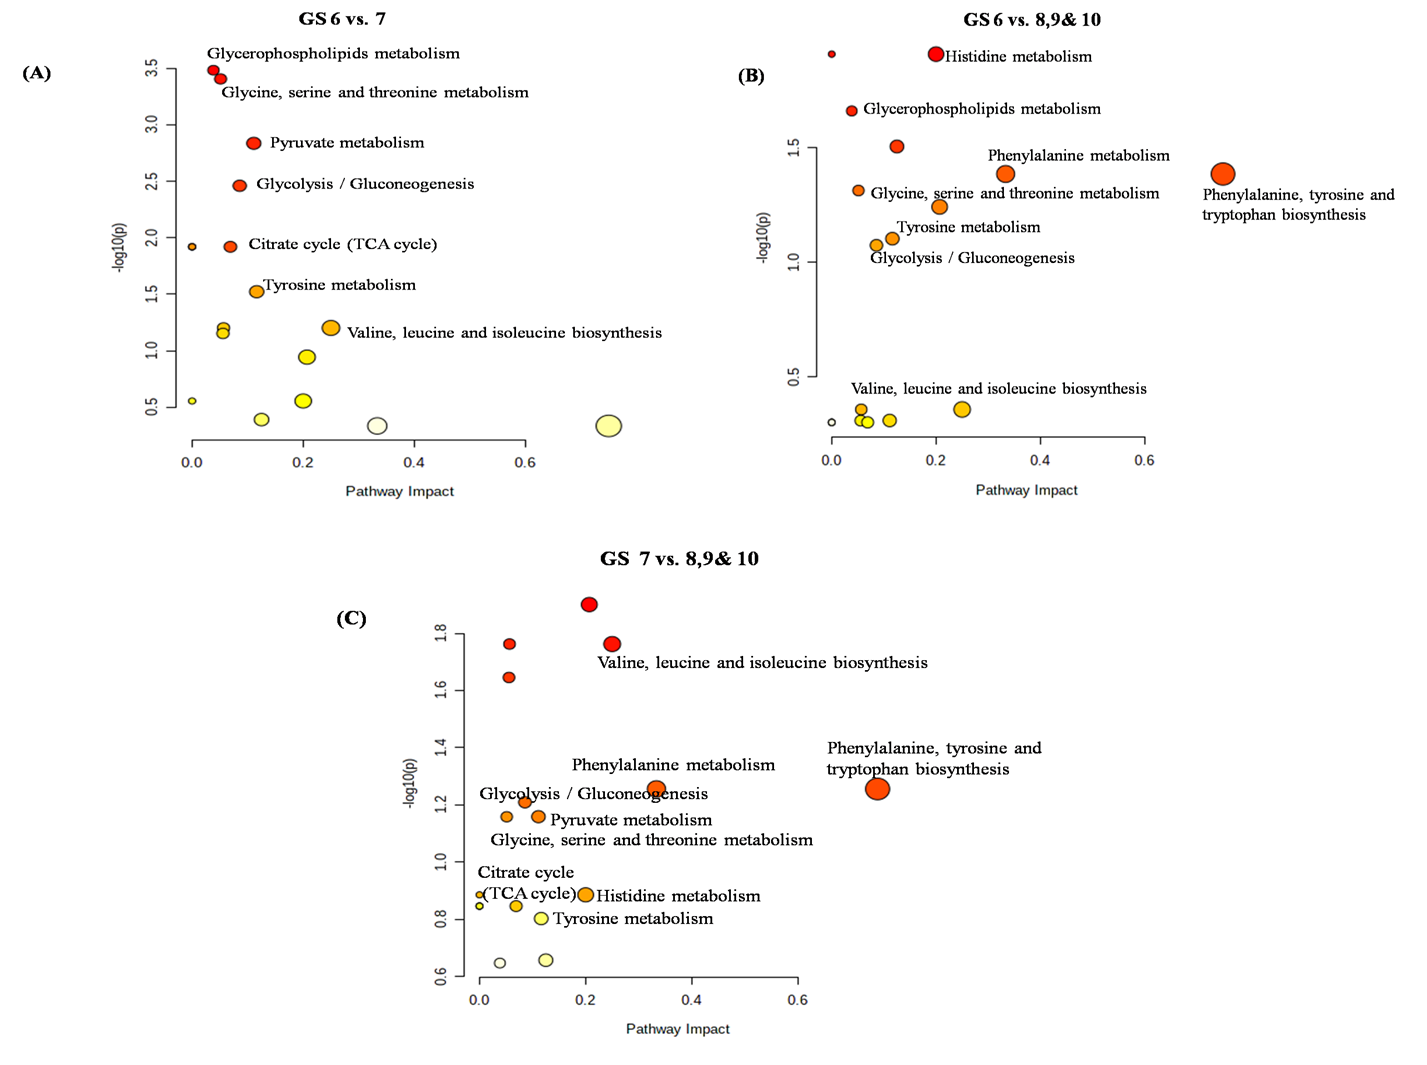
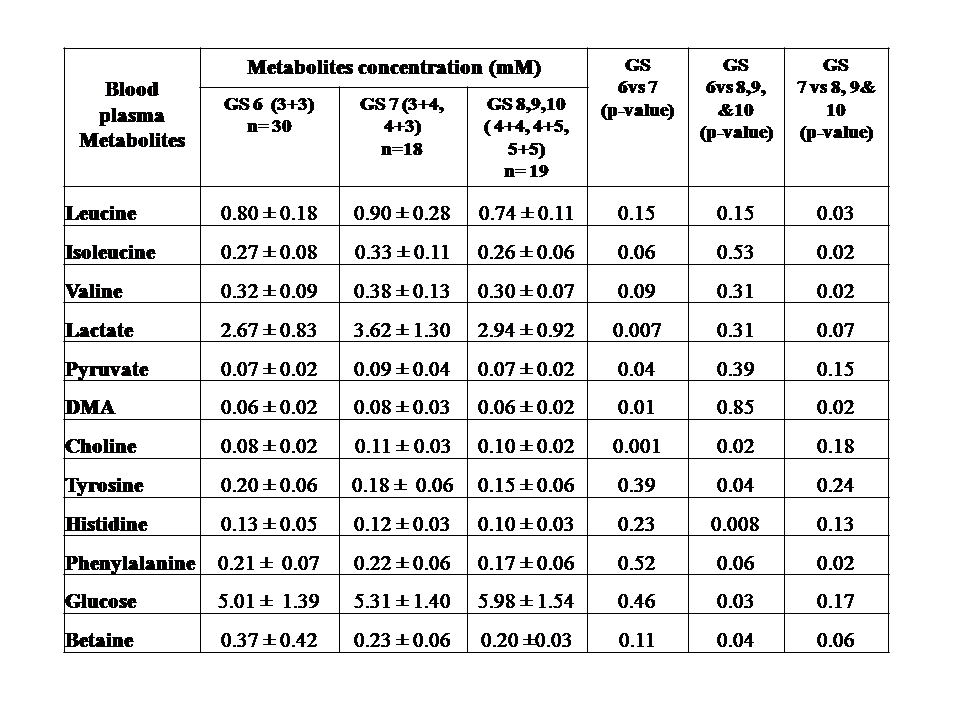
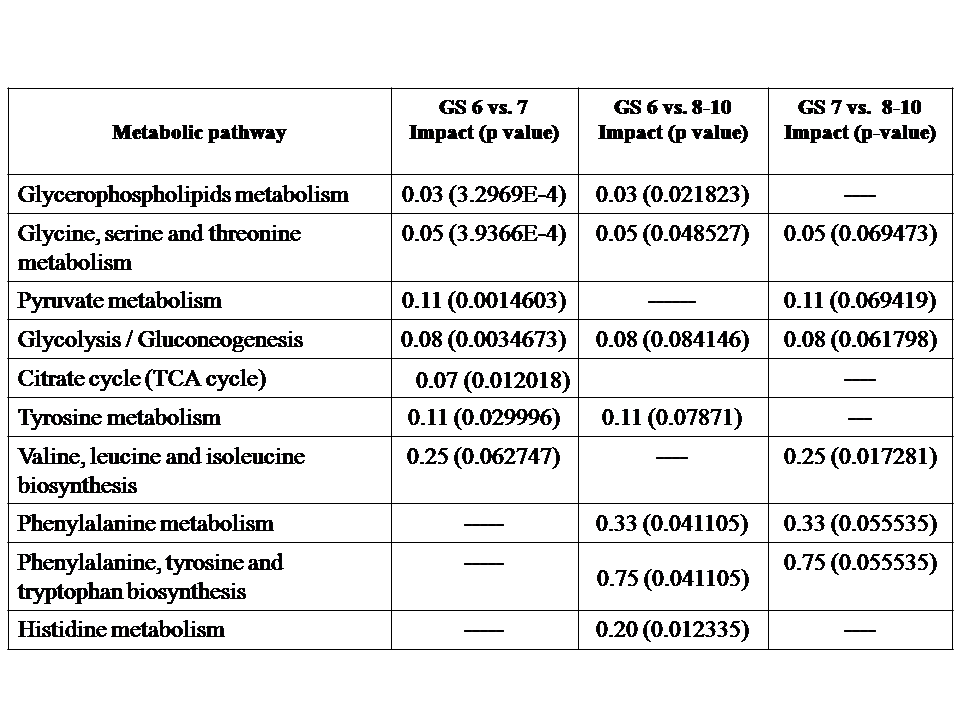
Representative one dimensional (1D) aliphatic region of 1H NMR (700 MHz) spectrum of blood plasma of a PCa patient having (A) GS 4+5, (B) GS 4+4, (C) GS 4+3, (D) GS 3+4, (E) GS 3+3 are shown in Figure 1. The lower concentration of tyrosine (Tyr), histidine (His) and higher concentration of choline (Cho), betaine and glucose (Glc) was seen in blood plasma of GS 8 -10 as compared to GS 6. Further, our data also showed higher concentration of dimethylamine (DMA) and lower concentration of valine (Val), leucine (Leu), isoleucine (IIe), phenylalanine (Phe) in plasma of patients having GS 8-10 as compared to GS 7 are presented in Table 1. The OPLS-DA score plot and VIP score plot shown in Figure 2 depicts discrimination between PCa patients across different GS observed in the study. Figure 3 shows the summary of altered metabolism pathway analysis. Furthermore, impact values (and the Holm p values) obtained from the enrichment analysis for the most important metabolic pathways perturbed in PCa: GS 6 vs. 7, GS 6 vs. 8-10 and GS 7 vs. 8-10.DISCUSSION
1H-NMR is used to detect alterations in blood plasma metabolites and their linkage to metabolic processes in a number of histopathological conditions including PCa. Our results revealed higher concentration of lactate, alanine, pyruvate, dimethylamine and choline in plasma of patient having GS 7 (3+4, 4+3) as compared to GS 62-5. The lower concentration of tyrosine, histidine and higher concentration of choline, betaine and glucose was seen in blood plasma of GS 8-10 as compared to GS 6. Further, our data also showed higher concentration of dimethylamine and lower concentration of valine, leucine, isoleucine, and phenylalanine in blood plasma of patients having GS 8-10 as compared to GS 7. Here, the impact of these relevant metabolic pathways was calculated from the pathway topology analysis and with a value equal to or above 0.1 was considered most significant metabolic pathways. The following ten unique significantly altered metabolic pathways such as glycerophosphocholine metabolism, glycine, serine and threonine metabolism, glycolysis or gluconeogenesis, phenylalanine metabolism, pyruvate metabolism, tricarboxylic acid (TCA) cycle, phenylalanine, tyrosine and tryptophan biosynthesis, phenylalanine metabolism and histidine metabolism that discriminate and identified from GS 6 and 7 patients compare with GS 8-10 patients. The altered metabolites related to aggressive PCa are mostly involved in phospholipids, amino acids, lipids and glucose metabolism.CONCLUSION
The study revealed that metabolic profiling of blood plasma of PCa patients having high GS distinct from lower GS may be provide insight to understand metabolic pathway and carcinogenesis of PCa. Twelve potential biomarker/s or metabolites were identified in different GS patients, indicating BCAAs and aromatic amino acids metabolism, glycolysis or gluconeogenesis, TCA cycle, phospholipids metabolism pathway disruptions.Acknowledgements
Pradeep kumar acknowledges ICMR-RA fellowship.References
(1). Rawla P. World J Oncol.2019; 2:63-89.
(2). Glunde K et al. Nat Rev Cancer. 2011; 11:835-48.
(3). Pérez RC et al. Metabolomics. 2017;13:52.
(4). Gatenby RA et al .Nat Rev Cancer. 2004;4:891-9.
(5). Nagrath D et al. BiochimBiophysActa. 2011; 1807:650-63.
(6).Dereziński P et al.Int J Med Sci. 2017;14:1-12.
Figures