0920
The value of semi-quantitative parameters of Dynamic Contrast-Enhanced MRI(DCE-MRI) to predict the expression of P53 in the ovarian cancer1First Affiliated Hospital of Dalian Medical University, Dalian, China
Synopsis
P53 is a tumor suppressor gene,TP53-mutated tumors in general have an aggressive phenotype and are characterized by poor differentiation, increased invasiveness, and high metastatic potential[1]。The early enhancement rate reflects the blood perfusion in the early enhancement stage of the lesion. Tumor exhibits a higher early enhancement rate with more abundant the blood supply of the tumor. Our study proved that the wash-in rate of ovarian cancer in the p53 positive group was higher than that in the P53 negative group.
Introduction
The mutation in the tumor suppressor gene TP53 is the most common genetic variant in human ovarian HGSC, and the most common and deadly histological subtype of epithelial ovarian cancer (EOC)[2]. The mutations in the P53 gene are related to the growth and development of malignant tumors[3]. This study aims to explore the relationship between semi-quantitative parameters of dynamic enhancement MRI (LAVA) and P53 protein in OC.Methods
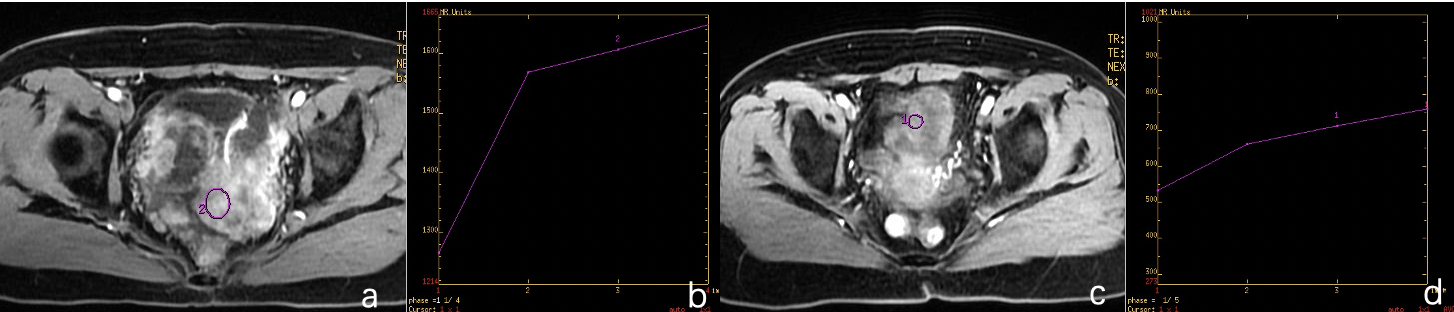
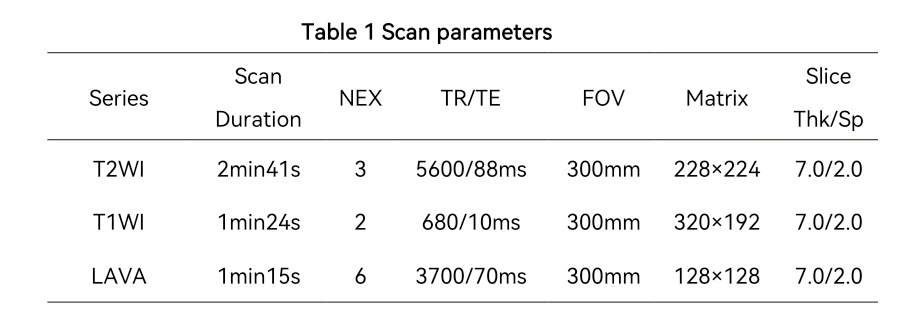
A total of 37 patients with ovarian cancer confirmed by surgery and pathology from 2015 to 2021 were retrospectively collected. Including 19 P53-positive patients (mean age:51.17±9.44; range: 41,-76 years) and 18 negative patients (mean age: 50.50±12.55; range: 35-84 years). All patients underwent abdominal MR examinations (Signa HDxt, GE Medical Systems, USA) included T2WI, and LAVA (Scan parameters show in table 1). Three contrast-enhanced wash-in indexes were calculated depending on the contrast-enhanced phase using equation: Wash-in index = (SIenhanced-SIunenhanced) / SIunenhanced × 100. Where SIenhanced is the signal strength on the contrast-enhanced image, and SIunenhanced is the signal strength on the unenhanced image. The arterial lavage index in the arterial phase, the venous phase lavage index in the venous phase, and the late lavage index in the equilibrium phase using the contrast agent were obtained. The initial wash-out index during the venous phase is calculated as follows:Initial wash-out index = (SIarterial -SIparenchymal) /SIarterial × 100. Among them, SIparenchymal is the signal intensity in the venous phase, and SIarterial is the signal intensity in the arterial phase. By replacing the variable SI excretion with SIparenchyma in the above equation, the later wash-out index between the arterial phase and the equilibrium phase is obtained. The manual regions of interest (ROIs) were drawn along the edge of tumors on the slice with maximal solid area (we choose the solid in tumors) (Fig. 1). Difference between above values and the expression of P53 in OC was compared by Mann-Whitney U test.Results
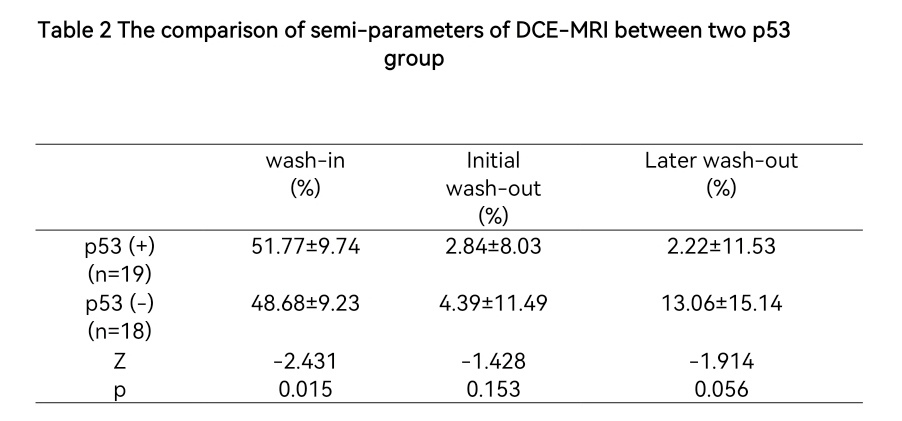
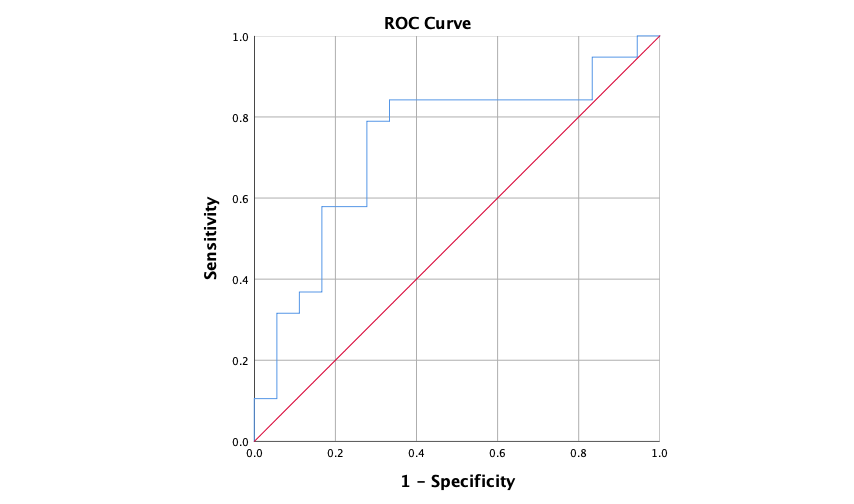
The wash-in of positive group was significantly higher than that of negative group (p <0.05). The initial and later wash-out index had no difference between two groups (p>0.05). (Table 2, Figure 1). The ROC curve of wash-in index in p53 positive group showed an AUC value of 0.734 (Figure 2). When the threshold of wash-in index was set to 50.89%, the corresponding diagnostic sensitivity and specificity would be 84.2% and 66.7%.Discussion and Conclusion
When p53 becomes mutated, it loses its function, resulting in abnormal cell proliferation and tumor progression. The early enhancement rate reflects the blood perfusion in the early enhancement stage of the lesion. In the present study, we proposed that wash-in index could be a promising imaging biomarker in the evaluation of P53 expression.Acknowledgements
NothingReferences
[1]Silwal-Pandit L, Langerød A, Børresen-Dale AL: TP53 Mutations in Breast and Ovarian Cancer.Cold Spring Harbor perspectives in medicine 2017, 7(1).
[2] Saleh A, Perets R. Mutated p543 in HGSC-From a Common Mutation to a Target for Therapy. Cancers (Basel). 2021 Jul 10;13(14):3465. doi: 10.3390/cancers13143465.
[3] Köbel M, Kang EY. The Many Uses of p53 Immunohistochemistry in Gynecological Pathology: Proceedings of the ISGyP Companion Society Session at the 2020 USCAP Annual9 Meeting. Int J Gynecol Pathol. 2021 Jan;40(1):32-40.
Figures