0918
Multiple quantitative parameters diagnosis of cellular and degeneration uterine leiomyoma with non-enhancement MRI
Shifeng Tian1 and Ailian Liu1,2
1the First Affiliated Hospital of Dalian Medical University, Dalian, China, 2Dalian Medical Imaging artificial intelligence engineering technology research center, Dalian, China
1the First Affiliated Hospital of Dalian Medical University, Dalian, China, 2Dalian Medical Imaging artificial intelligence engineering technology research center, Dalian, China
Synopsis
Results shown that several quantitative parameters of diffusion kurtosis imaging (DKI) and enhanced T2 star weighted angiography (ESWAN) sequence had different between cellular uterine leiomyoma (CUL) and degeneration uterine leiomyoma (DUL). Therefore, it is feasible to use DKI and ESWAN to distinguish CUL and DUL.
INTRODUCTION
The MRI imaging findings of cellular uterine leiomyoma (CUL) and degeneration uterine leiomyoma (DUL) do not have obvious characteristics, but there are differences in the treatment methods between the two, so it is necessary to make differential diagnosis before treatment. Compared with the traditional DWI sequence, diffusion kurtosis imaging (DKI) sequence can reflect the changes of microenvironment more accurately, and quantify the deviation of water molecules under the condition of non Gaussian distribution diffusion[1]. Enhanced T2 star weighted angiography (ESWAN) sequence is based on the difference of magnetic sensitivity between different tissues due to the presence of iron in blood[2], which can provide multiple quantitative analysis parameter images. The purpose of this study was to explore the value of multiple quantitative parameters of non-enhancement MRI in identifying CUL and DUL.METHODS
The 68 patients with atypical uterine leiomyoma confirmed by surgery and pathology were retrospective analyzed, accorded to pathological type the patients were divided into two groups, included 17 cases of CUL and 51 cases of DUL. All patients underwent pelvic 1.5T MRI (SignaHDxt, GE Medical Systems, USA) before surgery, the scanning sequences included T1WI, T2WI, DKI and ESWAN. The quantitative parameters of various sequences of lesions were measured, included the mean kurtosis (MK), mean diffusivity (MD), fractional anisotropy (FA) values of DKI, the amplitude, phase, R2* and T2* values of ESWAN. At the same time, the signal ratio of lesions to iliopsoas on T1WI and T2WI was measured and calculated (T1R and T2R) (Fig 1). The independent sample t test or Mann Whitney U test was used to compare the differences between the two groups of cases, the ROC curve was used to evaluate the efficiency of the parameter which had difference between two groups in identifying CUL and DUL. For the parameters with medium or above diagnostic efficiency, logistic regression was used to calculate the combined diagnostic efficiency.RESULTS
The T2R and T2* value of CUL group (3.383±1.412, 71.110±29.288 ms) were significantly higher than that of DUL group (2.596±0.955, 51.907±19.261 ms), while the MD value and R2* value of CUL group (1.539±0.248 μm2/ms, 17.370±6.877 Hz) were significantly lower than that of DUL group (1.742±0.268 μm2/ms, 22.401±7.015 Hz) (P<0.05). No statistical differences were observed in the T1R, MK value, FA value, amplitude value and phase value between two groups (P>0.05). The AUC of T2R, MD value, R2* value and T2* value to identify CUL and DUL were 0.657, 0.703, 0.707 and 0.705, respectively. The AUC of MD combined R2* value, MD combined T2* value, MD combined R2* and T2* value were 0.813, 0.799, and 0.802, respectively.DISCUSSION AND CONCLUSIONS
Compared with DUL, CUL has more abundant and tightly arranged smooth muscle cells, so the extracellular volume is less, and the degree of water movement restriction is more obvious. In addition, DUL can expand the extracellular space due to the presence of denatured substances, which further increases the space for water molecules diffusion and increases the MD value. The metabolic rate and nutritional support of cul are higher than those of DUL, and the tissue blood supply and microvessel density are higher, which can provide more oxygenated hemoglobin. Therefore, it is speculated that the hypoxia degree of CUL is not as serious as that of DUL, so the R2* value decreases. Several quantitative parameters of DKI and ESWAN sequence had different between CUL and DUL, the AUC value of differential diagnosis increased when combined application.Acknowledgements
No acknowledgement.References
[1] Wang X, Gao W, Li F, et al. Diffusion kurtosis imaging as an imaging biomarker for predicting prognosis of the patients with high-grade gliomas. Magn Reson Imaging, 2019, 63:131-136.
[2] Li Z, Cao L, Dong W, et al. Prevalence and Risk Factors of Cerebral Microbleeds in Patients with Nonvalvular Atrial Fibrillation: An Enhanced T2*-Weighted Angiography Imaging Study. Eur Neurol, 2019, 81(3-4):112-119.
Figures
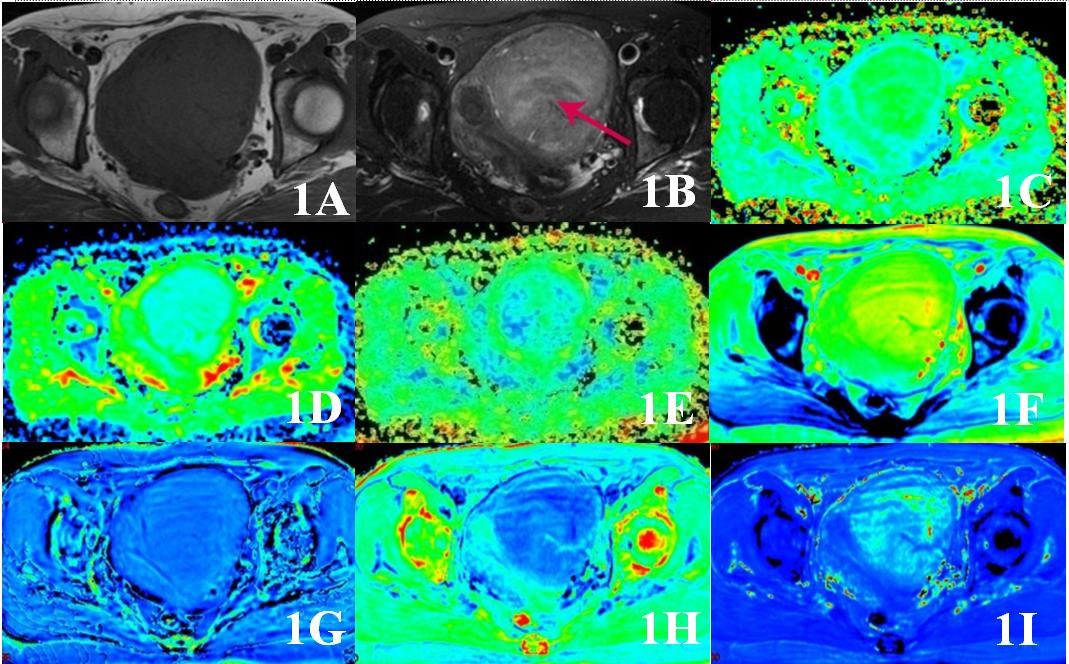
Fig 1 This is a 52 year old patient with CUL. 1A was T1WI and 1B was T2WI, the red arrow indicates the lesion. 1C~1E showed MK, MD and FA of DKI sequence, the values were 0.825, 1.21 μm2/ms and 0.242, respectively. 1F~1I showed amplitude, phase, R2* and T2* images of ESWAN sequence, the values were 898.52, -0.0043 radian, 11.748 Hz and 90.839 ms, respectively
DOI: https://doi.org/10.58530/2022/0918