0916
Repeatability of Apparent Diffusion Coefficient Estimates of Healthy Male and Female Pelvic Tissues1Radiology, University of California, San Diego, La Jolla, CA, United States, 2Neuroscience, University of California, San Diego, La Jolla, CA, United States, 3Radiation Medicine and Applied Sciences, University of California, San Diego, La Jolla, CA, United States, 4Bioengineering, University of California, San Diego, La Jolla, CA, United States
Synopsis
Establishing ADC repeatability is important for clinical translation of quantitative DWI. Pelvic ADC repeatability in healthy men and premenopausal women are not well-defined. Four men were scanned twice and six women were scanned each week of their normal 28-day menstrual cycle using a 3.0T scanner. Prostate, cervix, and uterine tissue ROIs were drawn to calculate median ADC values. Minimum reliably detectable ADC change (RC) was estimated at 16% and 11% within the prostatic peripheral and transition zones, respectively. Female reproductive tissue ADCs and repeatability varied across the menstrual cycle, with the greatest RCs displayed by endometrium (40%) and cervix (36%).
Introduction
Quantitative diffusion-weighted MRI (DWI) is utilized in pelvic MRI to help detect and monitor cancer. The most commonly used diffusion metric is the apparent diffusion coefficient (ADC). The American College of Radiology currently recommends DWI in pretreatment evaluation and follow-up of prostate,1 cervical,2 and endometrial3 cancers.Establishing repeatability and reproducibility of quantitative imaging biomarkers like ADC is paramount for translation into clinical practice.4 Only a handful of studies5,6 have evaluated the repeatability of healthy prostate ADCs in men, and none have done so for the female pelvis. ADC repeatability in premenopausal women in particular has been difficult to establish due to the inherent changes during the menstrual cycle. The objective of this study was to characterize ADC repeatability for healthy male and female pelvic tissues.
Methods
Four men (34±7 years old) were scanned twice (12±8 days apart), and six women (26±6 years old) with a regular 28-day menstrual cycle were scanned once each week of their menstrual cycle. Subjects underwent pelvic MRI (Table 1) using a 3.0T scanner (GE Healthcare, USA) and 32-channel body array.Data were corrected for distortions induced by B0-inhomogeneity, noise, and eddy currents in MATLAB (MathWorks Inc., USA).7,8 ADC maps were estimated after averaging all diffusion directions for a given b-value.
Regions of interest (ROIs) were drawn (Osirix, Pixmeo, Switzerland) on distortion-corrected7 b=0 s/mm2 images for male (peripheral and transition zones) and female (cervix, endometrium, junctional zone, myometrium, ovaries) reproductive structures, along with gluteus maximus, iliac bone, iliacus muscle, and sacral vertebra (S2 or S3). ROIs were reviewed by two radiologists in consensus.
ROIs were used to extract and compute median ADCs for each tissue. Within-subject coefficient of variation (wCV) was calculated to evaluate the variability of ADC measures between timepoints following the Quantitative Imaging Biomarkers Alliance’s recommendations4:
- Variance and mean for each subject were computed using the median ADCs at each timepoint,
- Squared wCV (wCV2) was derived by dividing each subject’s variance by their squared mean,
- wCV was estimated by taking the square root of the mean of the wCV2 over all subjects.
Results
ADC, PD, wCV, and RC values are summarized in Table 2. Prostatic peripheral and transition zones had median (range) RC values of 16% (6-23%) and 11% (5-18%), respectively (Fig 1A). Notably, prostate tissues had lower wCVs and RCs than any female reproductive tissues, while tissues present in both males and females did not differ; among these, vertebrae had the greatest variation (RC=83% (9-202%)).ADCs of female reproductive structures varied across menstrual phases (Fig 2, Table 2). While the cervix, endometrium, and ovaries experienced moderate ADC changes across the menstrual cycle, the junctional zone and myometrium showed little variation. Among tissues, endometrium had the largest RC across the cycle, at 40% (11-67%). The largest variation arose between the menstrual and follicular phases for cervix, endometrium, and junctional zone, RC = 54% (4-98%), 51% (15-81%), and 35% (26-45%), respectively (Table 3). The myometrium displayed the greatest variation between the luteal and menstrual phases, RC = 25% (9-31%), while the ovaries varied the most between the ovulatory and luteal phases, RC = 32% (13-53%).
Discussion
Minimum detectable ADC change for female reproductive tissues across the menstrual cycle were higher than those for prostatic tissues across two timepoints. Overall, the endometrium was found to vary the most (RC=40%) throughout the menstrual cycle, followed by the cervix (RC=36%). While the endometrium is expected to change drastically throughout the cycle, cervical ADCs have not yet been studied in this manner and warrant further investigation. Prostatic RCs were consistent with previous findings.6Similar to prior studies,5,6,9 the peripheral zone was found to have a higher ADC than the transition zone; however, ADCs for both tissues were higher by ~1×10⁻³ mm2/s than previously recorded. Cervix and uterine zone ADCs were higher by a similar magnitude.10-13 A possible explanation is that these structures are small (e.g. endometrium during menstrual phase is very thin), and accurate ROIs are difficult to achieve considering the low resolution of DWI. Partial voluming may produce artificially high ADCs, especially when the imaging plane is not orthogonal to the tissue of interest. Occult Nabothian cysts may also increase cervical ADC. Additionally, we observed significant distortions from bowel gas in several subjects, affecting ROI placement. Lastly, different imaging parameters, such as inclusion of fat suppression, may affect ADC quantification.
Limitations include small sample size of mostly young subjects; future work should evaluate repeatability in older subjects. Secondly, the DWI imaging plane was not prescribed orthogonally to the cervix and uterus, which is relevant for characterizing these small structures. Lastly, low signal-to-noise ratio on tissues with short T2 values may skew repeatability measures.
Conclusions
Our results add to the sparse available data on healthy premenopausal cervical and uterine ADCs and corroborate existing data on repeatability of healthy prostate ADCs. Variability across the menstrual cycle should be considered when performing quantitative DWI studies on premenopausal women. Distortion artifacts remain an issue for pelvic DWI.Acknowledgements
GE Healthcare research grant, R37 CA249659References
[1] Turkbey B, Rosenkrantz AB, Haider MA, et al. Prostate Imaging Reporting and Data System Version 2.1: 2019 Update of Prostate Imaging Reporting and Data System Version 2. Eur Urol. 2019;76:340-51.
[2] Siegel CL, Andreotti RF, Cardenes HR, et al. ACR Appropriateness Criteria® pretreatment planning of invasive cancer of the cervix. J Am Coll Radiol. 2012;9:395-402.
[3] Expert Panel on GYN and OB Imaging, Reinhold C, Ueno Y, Akin EA, et al. ACR Appropriateness Criteria® Pretreatment Evaluation and Follow-Up of Endometrial Cancer. J Am Coll Radiol. 2020;17:S472-86.
[4] Shukla-Dave A, Obuchowski NA, Chenevert TL, et al. Quantitative imaging biomarkers alliance (QIBA) recommendations for improved precision of DWI and DCE-MRI derived biomarkers in multicenter oncology trials. J Magn Reson Imaging. 2019;49:e101-21.
[5] Michoux NF, Ceranka JW, Vandemeulebroucke J, et al. Repeatability and reproducibility of ADC measurements: a prospective multicenter whole-body-MRI study. Eur Radiol. 2021;31:4514-27.
[6] Gibbs P, Pickles MD, Turnbull LW. Repeatability of echo-planar-based diffusion measurements of the human prostate at 3 T. Magn Reson Imaging. 2007;25:1434-9.
[7] Holland D, Kuperman JM, Dale AM. Efficient correction of inhomogeneous static magnetic field-induced distortion in echo planar imaging. Neuroimage. 2010;50:175-183.
[8] White NS, McDonald CR, Farid N, et al. Diffusion-weighted imaging in cancer: Physical foundations and applications of restriction spectrum imaging. Cancer Res. 2014;74:4638-52.
[9] Tamada T, Sone T, Jo Y, et al. Apparent diffusion coefficient values in peripheral and transition zones of the prostate: comparison between normal and malignant prostatic tissues and correlation with histologic grade. J Magn Reson Imaging. 2008;28:720-6.
[10] He Y, Ding N, Li Y, et al. 3-T diffusion tensor imaging (DTI) of normal uterus in young and middle-aged females during the menstrual cycle: evaluation of the cyclic changes of fractional anisotropy (FA) and apparent diffusion coefficient (ADC) values. Br J Radiol. 2015;88:20150043.
[11] Kılıçkesmez Ö, Fırat Z, Oygen A, et al. Diffusion Tensor Imaging of the Uterine Zones Related to the Menstrual Cycle and Menopausal Status at 3 Tesla MRI. Balkan Med J. 2016;33:607-613.
[12] Kilickesmez O, Bayramoglu S, Inci E, et al. Quantitative diffusion-weighted magnetic resonance imaging of normal and diseased uterine zones. Acta Radiol. 2009;50:340-7.
[13] Tsili AC, Argyropoulou MI, Tzarouchi L, Dalkalitsis N, Koliopoulos G, Paraskevaidis E, Tsampoulas K. Apparent diffusion coefficient values of the normal uterus: Interindividual variations during menstrual cycle. Eur J Radiol. 2012;81:1951-6.
Figures
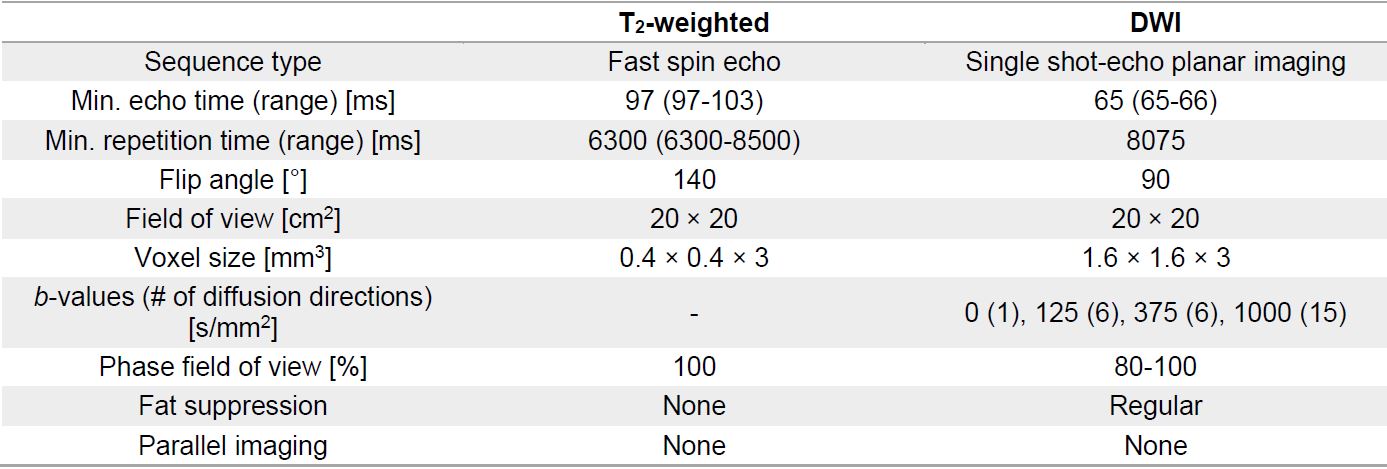
Table 1. Imaging parameters.
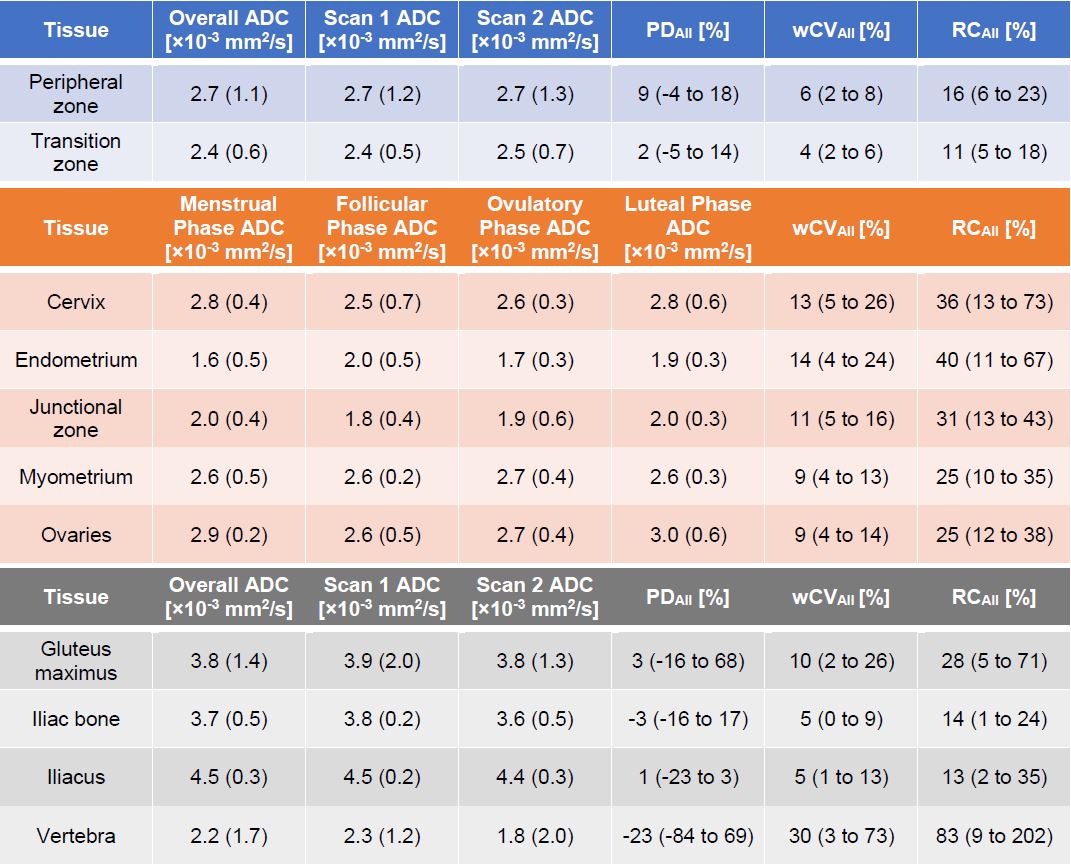
Table 2. ADCs and repeatability metrics for male, female, and shared pelvic tissues. ADCs are presented as median (interquartile range). Percent differences (PDAll) are presented as median (range). Within-subject coefficient of variation (wCVAll) and repeatability coefficient (RCAll) across all timepoints are presented as mean (range). Male and female subjects were aggregated for analysis of shared pelvic structures, with follicular and ovulatory timepoints compared for female subjects.
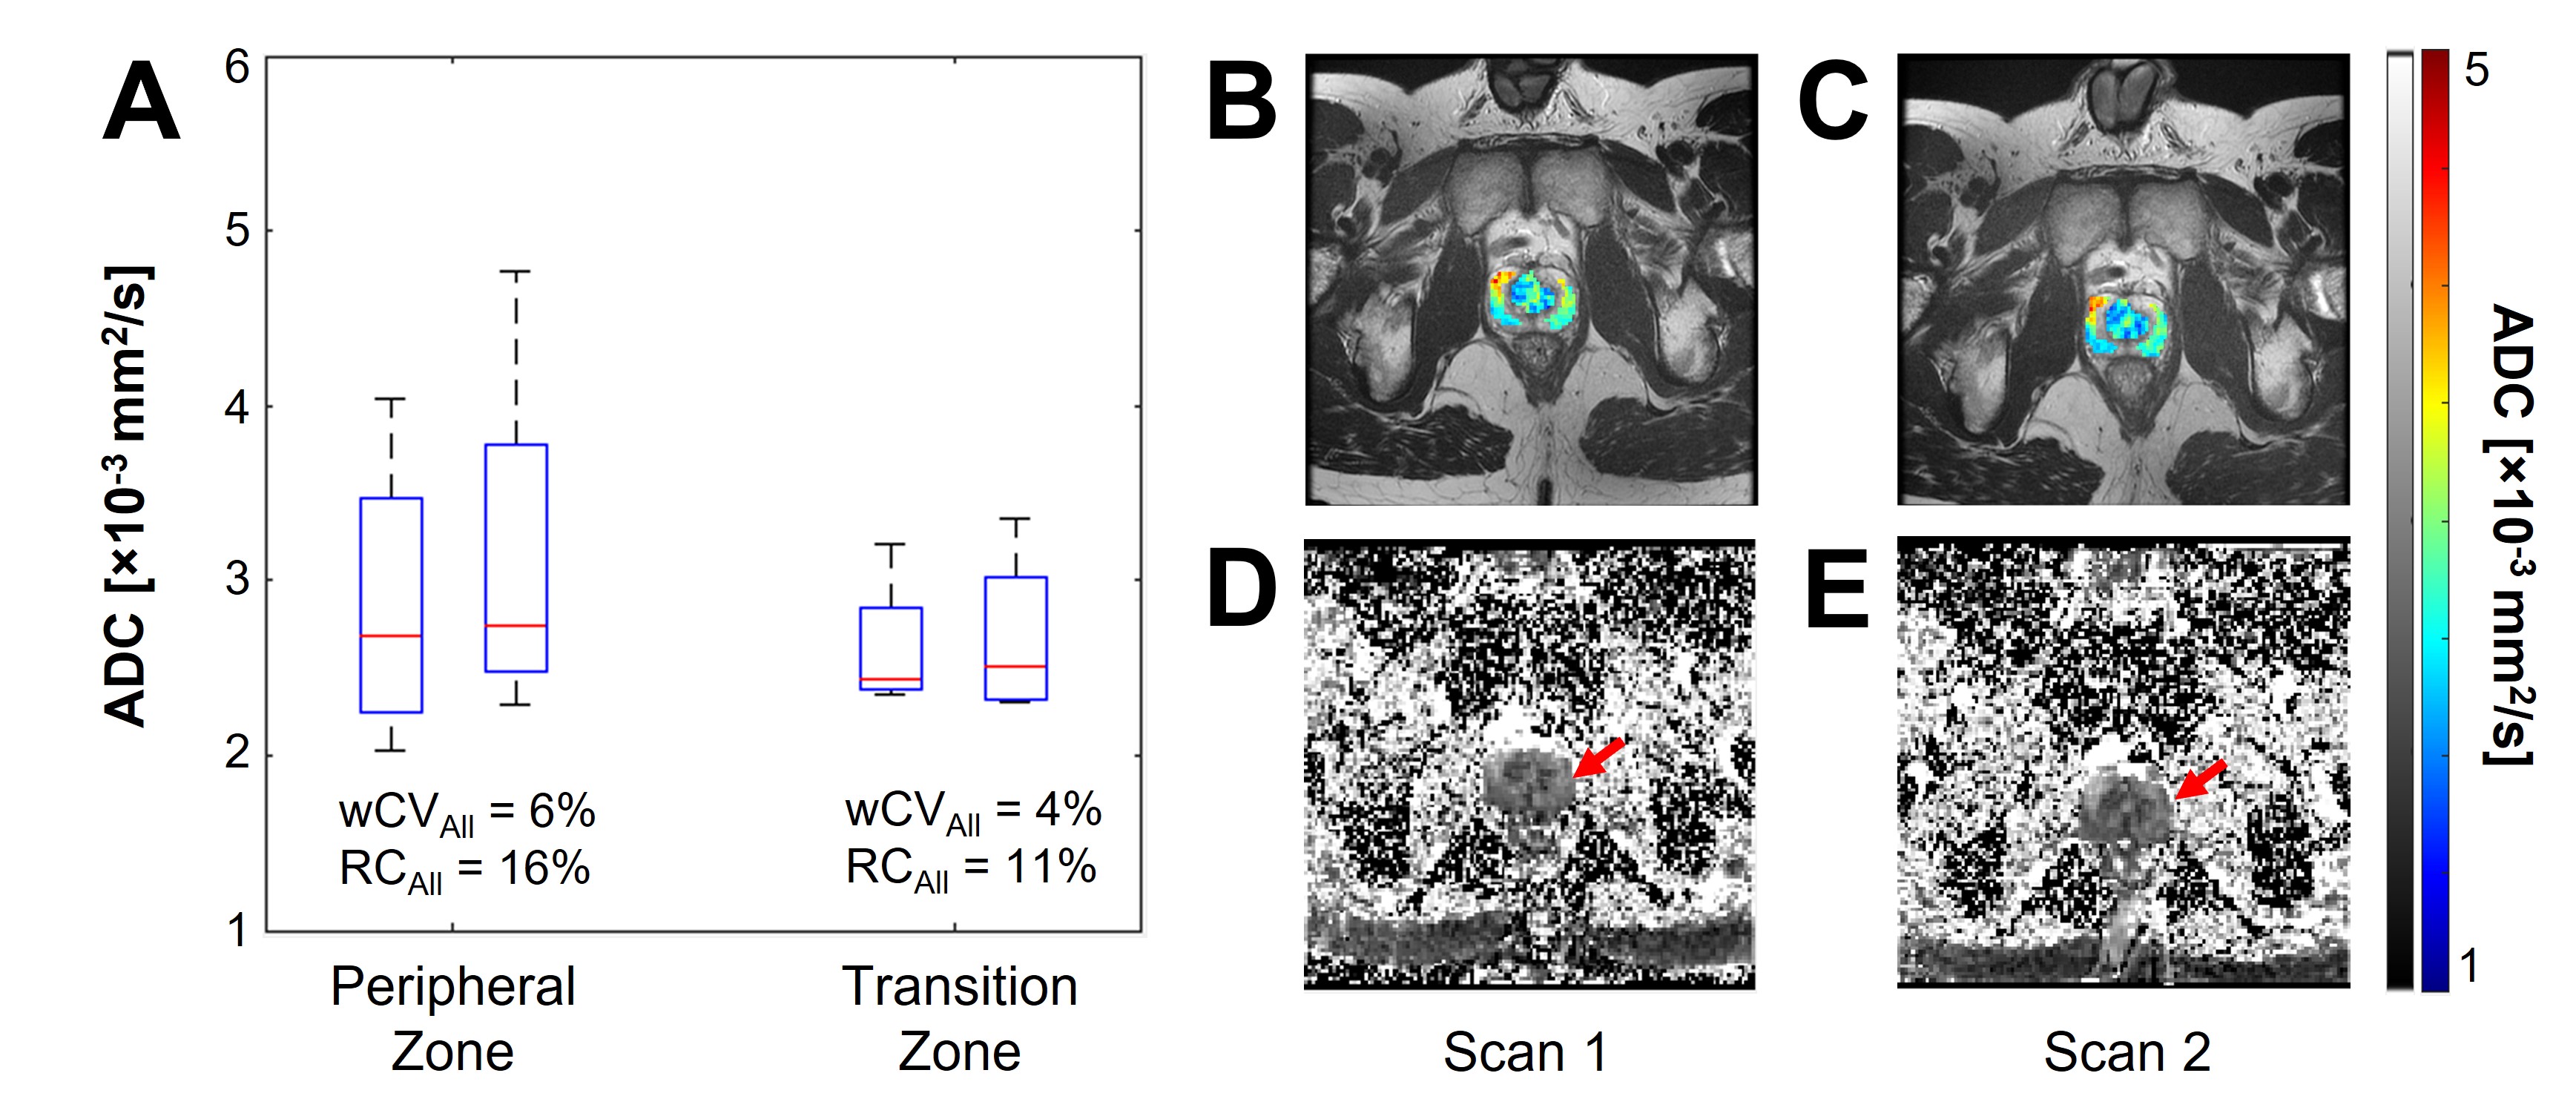
Figure 1. ADC of prostate tissues. (A) Boxplot of median ADCs at each timepoint for peripheral zone and transition zones. Representative ROIs for (B,D) first scan date and (C,E) second scan date are shown in (B,C) as ADC maps overlaid on T2-weighted images and (D,E) full-slice ADC maps, where red arrows indicate the location of the prostate. ROIs were drawn as such to avoid tissue overlap.
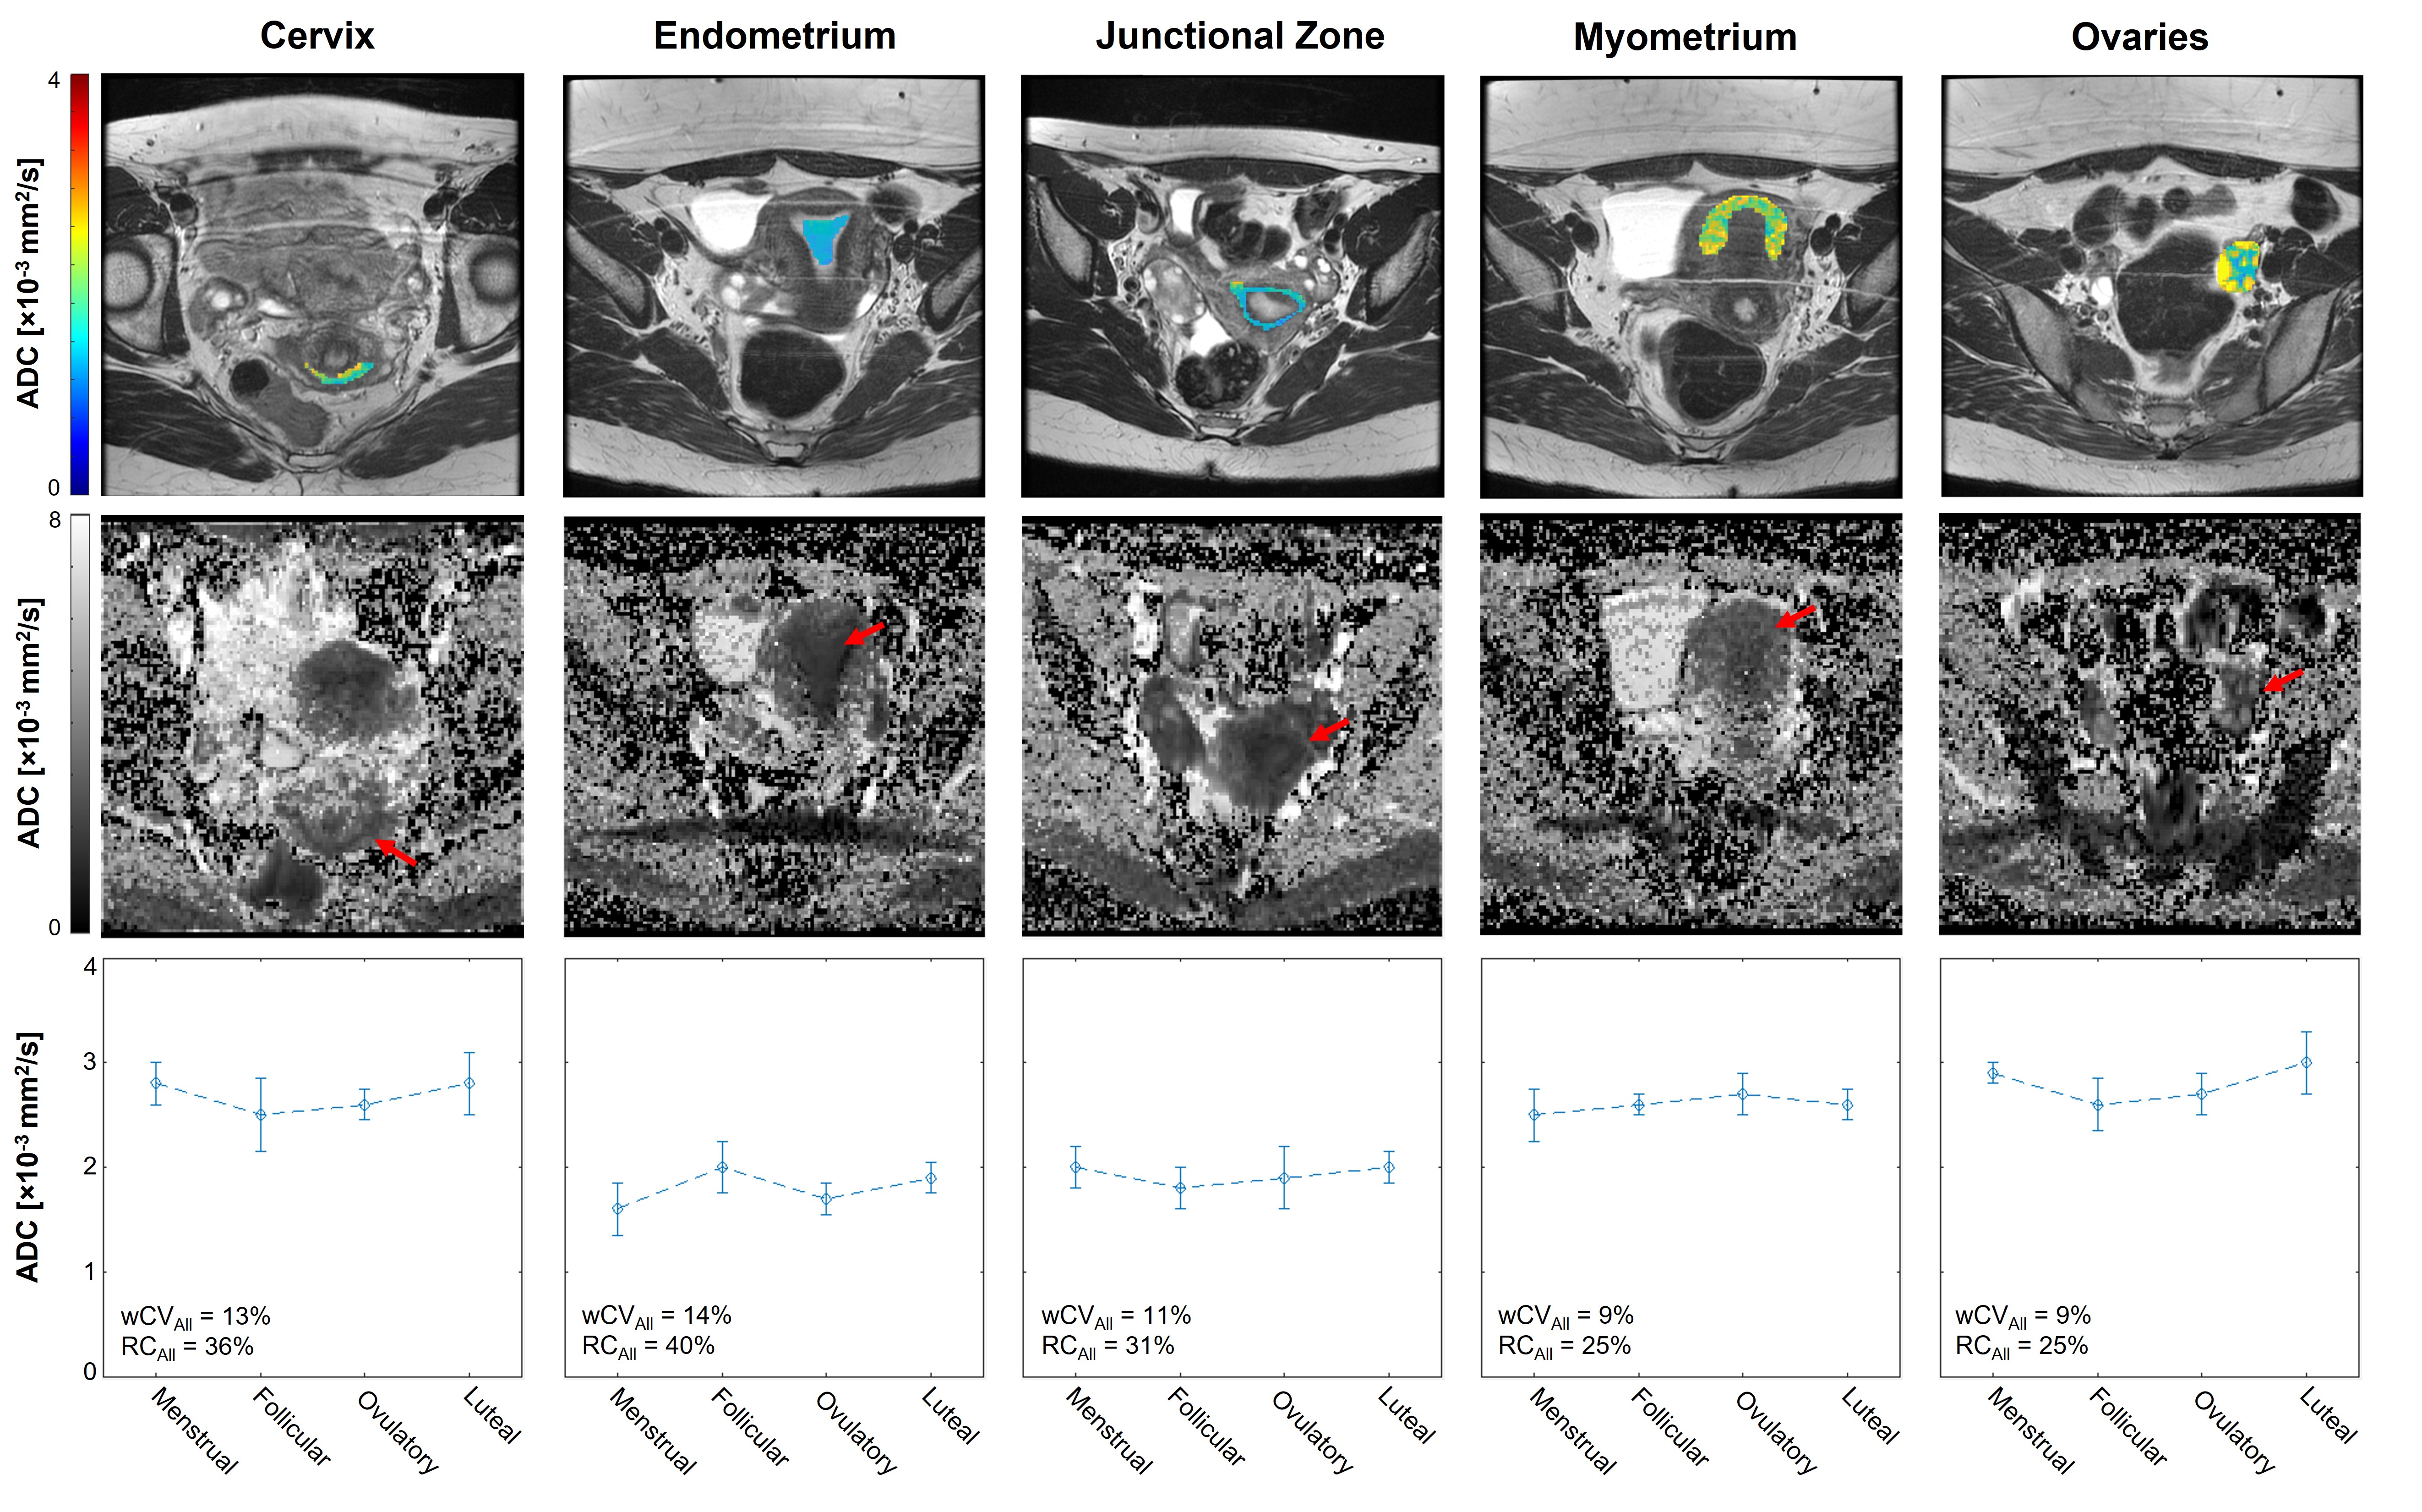
Figure 2. ADCs of female reproductive structures across the menstrual cycle. Representative ROIs are shown as ADC map overlays on T2-weighted images in the first row. Full-slice ADC maps are shown in the second row, with red arrows indicating the tissue of interest. Median and interquartile range are plotted for each phase in the third row.
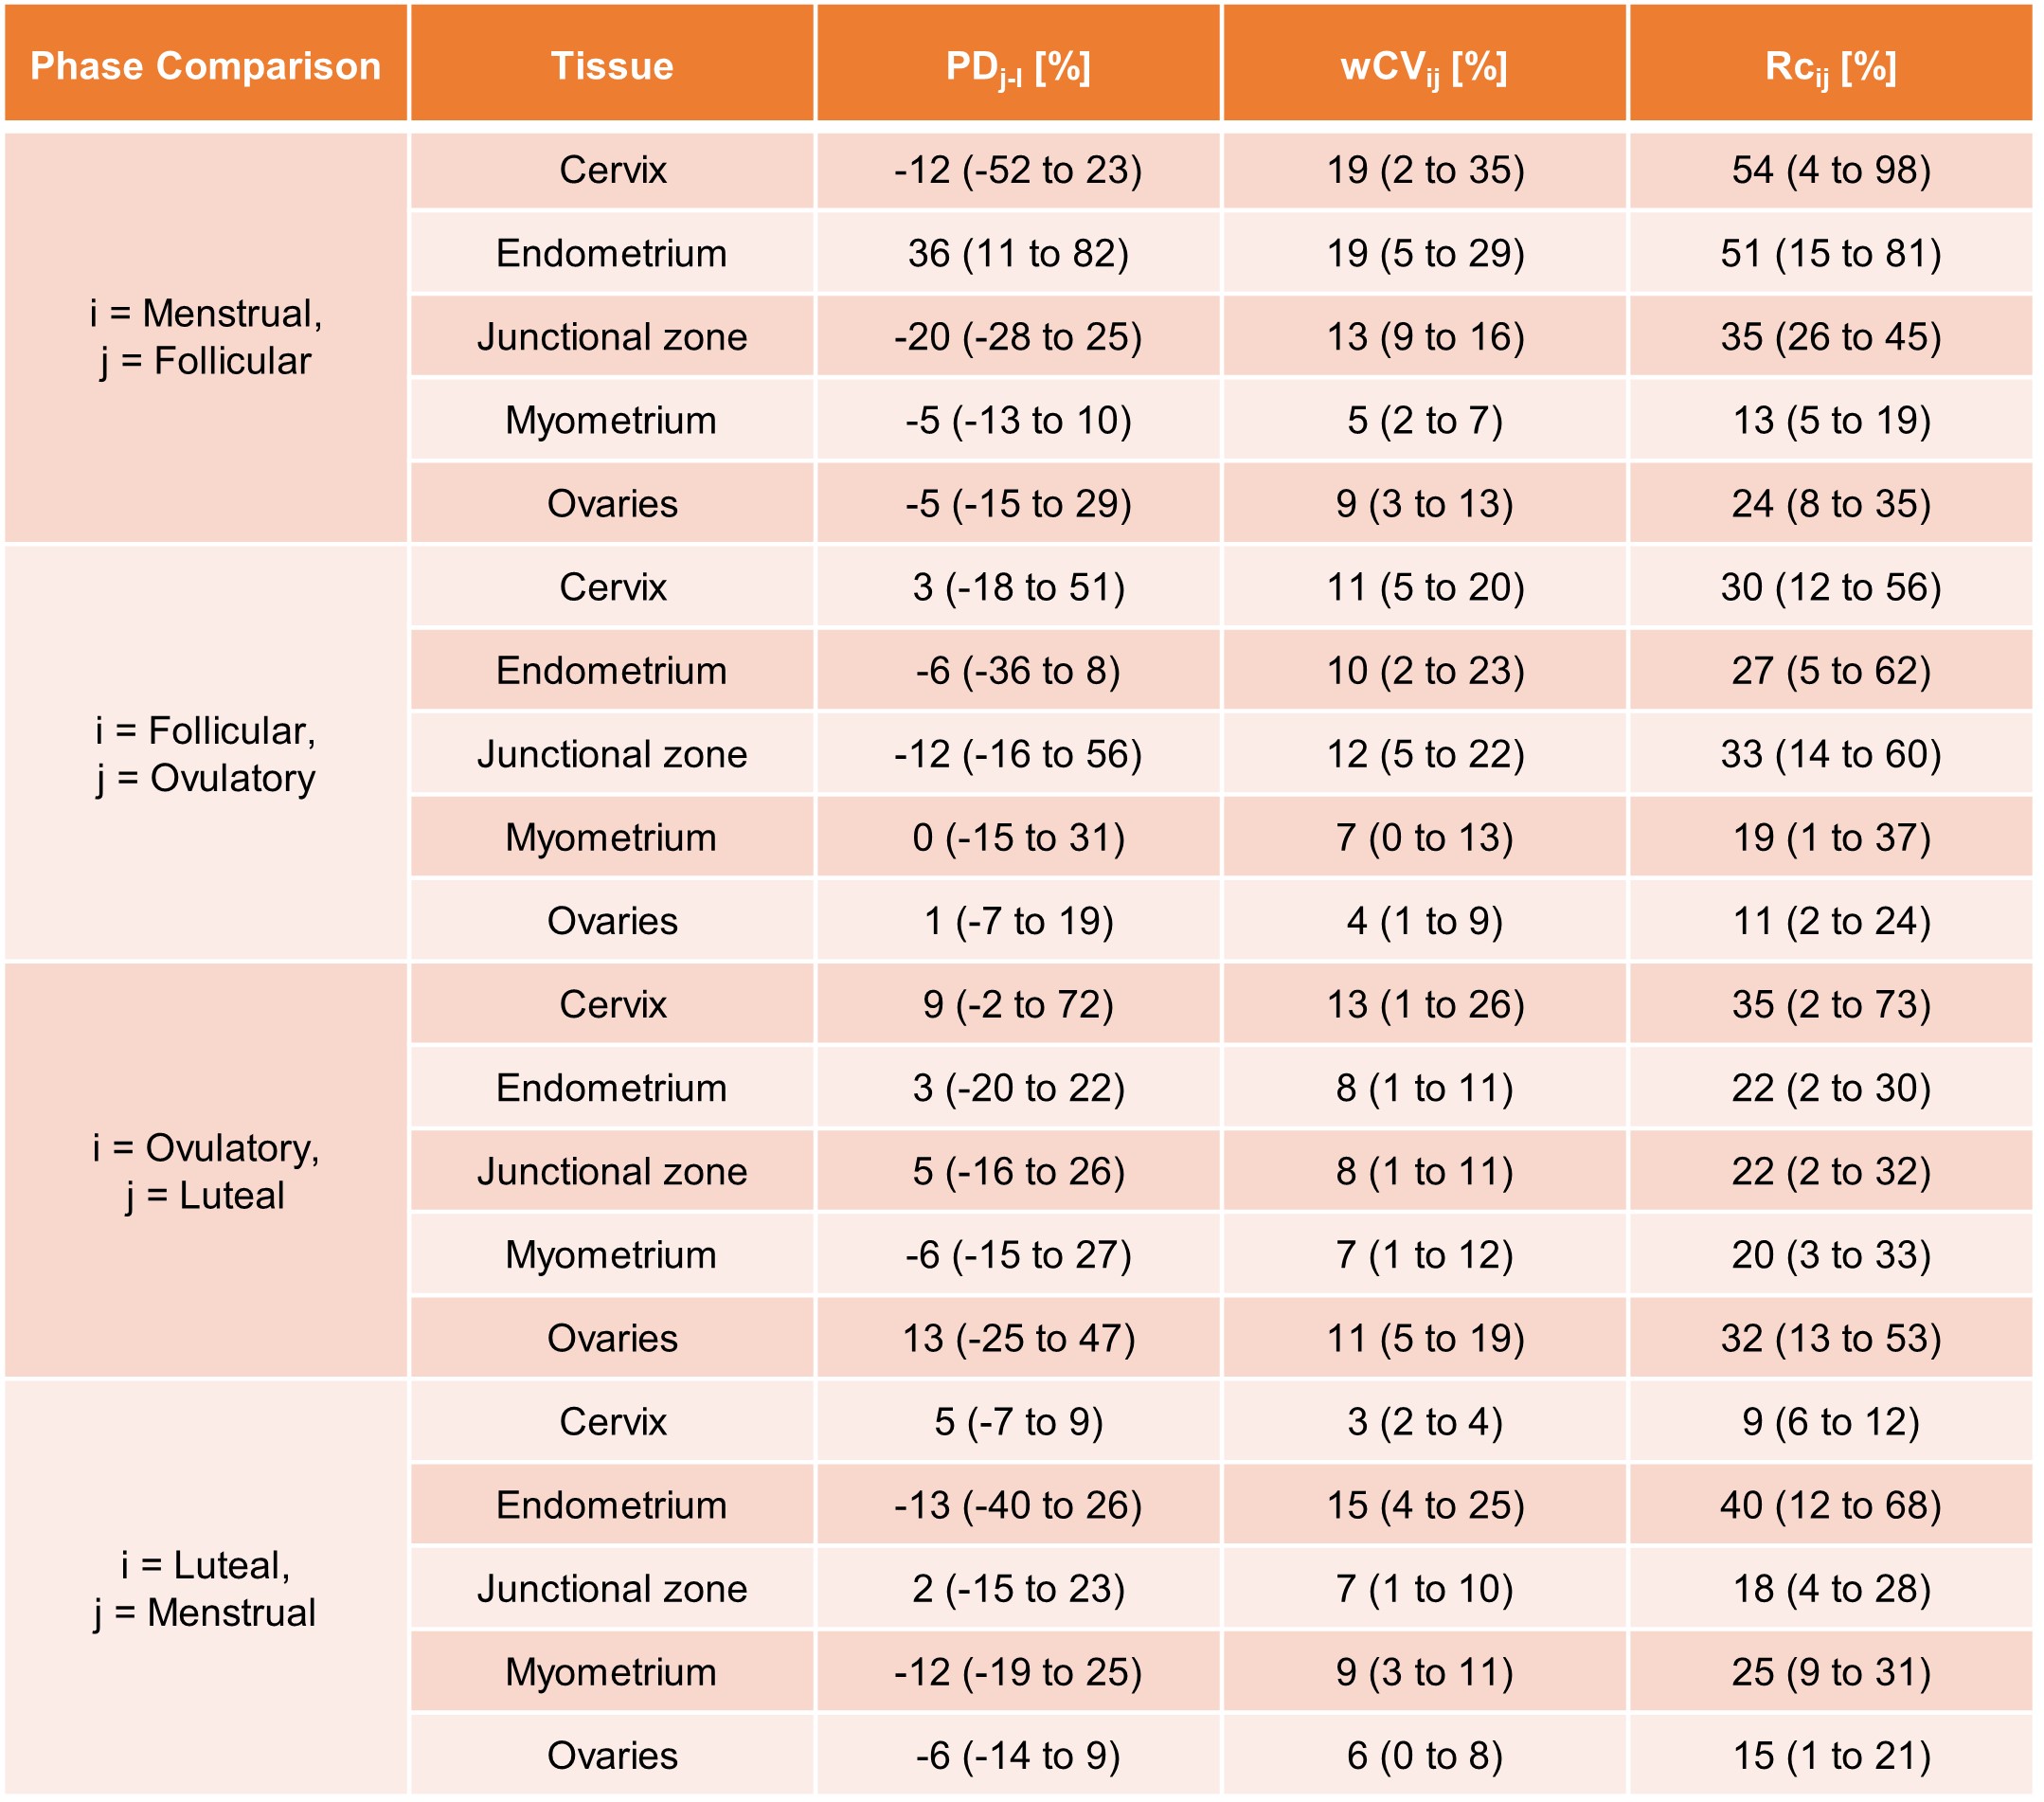
Table 3. Repeatability metrics for female subjects across the menstrual cycle. Percent differences (PDj-i) are presented as median (range), where i and j indicate the first and second phases being compared, respectively. Within-subject coefficient of variation (wCVij) and repeatability coefficient (RCij) are presented as mean (range).