0912
SAR-reduced Asymmetric tr-FOCI for PICORE-ASL1Department of Biomedical Engineering, University of Melbourne, Parkville, Australia, 2Melbourne Brain Centre Imaging Unit, University of Melbourne, Parkville, Australia, 3MR Research Collaborations, Siemens Healthcare Pty Ltd, Melbourne, Australia
Synopsis
PICORE-ASL using tr-FOCI pulses during labelling typically generates high power deposition at 7T. The current study introduces an asymmetric tr-FOCI pulse for PICORE-ASL to achieve SAR reduction. Results from simulations, phantom and in vivo experiments demonstrate the SAR reduction that can be achieved by using the asymmetric pulses without sacrificing inversion efficiency, slice profiles or CBF measurement.
Introduction
Arterial spin labelling (ASL) at 7T is beneficial due to increased signal-to-noise and longer $$$T_1$$$ relaxation times1, but remains challenging due to $$$B_1$$$ inhomogeneity causing inadequate inversion of the blood bolus during labelling. The time-resampled frequency-offset corrected inversion (tr-FOCI) pulse1,2,3, based on the hyperbolic secant (HS) pulse4 and the FOCI pulse5, has been a popular choice for ASL. In tr-FOCI pulse design, RF amplitude, phase and gradient functions are optimized to achieve a desired slice inversion profile. However, tr-FOCI pulses deposit more power than HS pulses, resulting in a higher specific absorption rate (SAR).The current study presents a SAR-reduced tr-FOCI pulse by introducing an asymmetric amplitude function. Asymmetric adiabatic pulses have been used in fat suppression6 and NMR experiments7 when only one sharp transition edge is required to select a specific frequency range. In ASL, proximal inversion with a control for off-resonance effects (PICORE)8 requires the inversion profile to have one sharp transition band adjacent to the imaging slab9. Hence an asymmetric pulse can be used with PICORE to achieve both a desirable inversion profile and reduced power deposition. We demonstrate this in simulations, phantom and in vivo experiments.
Method
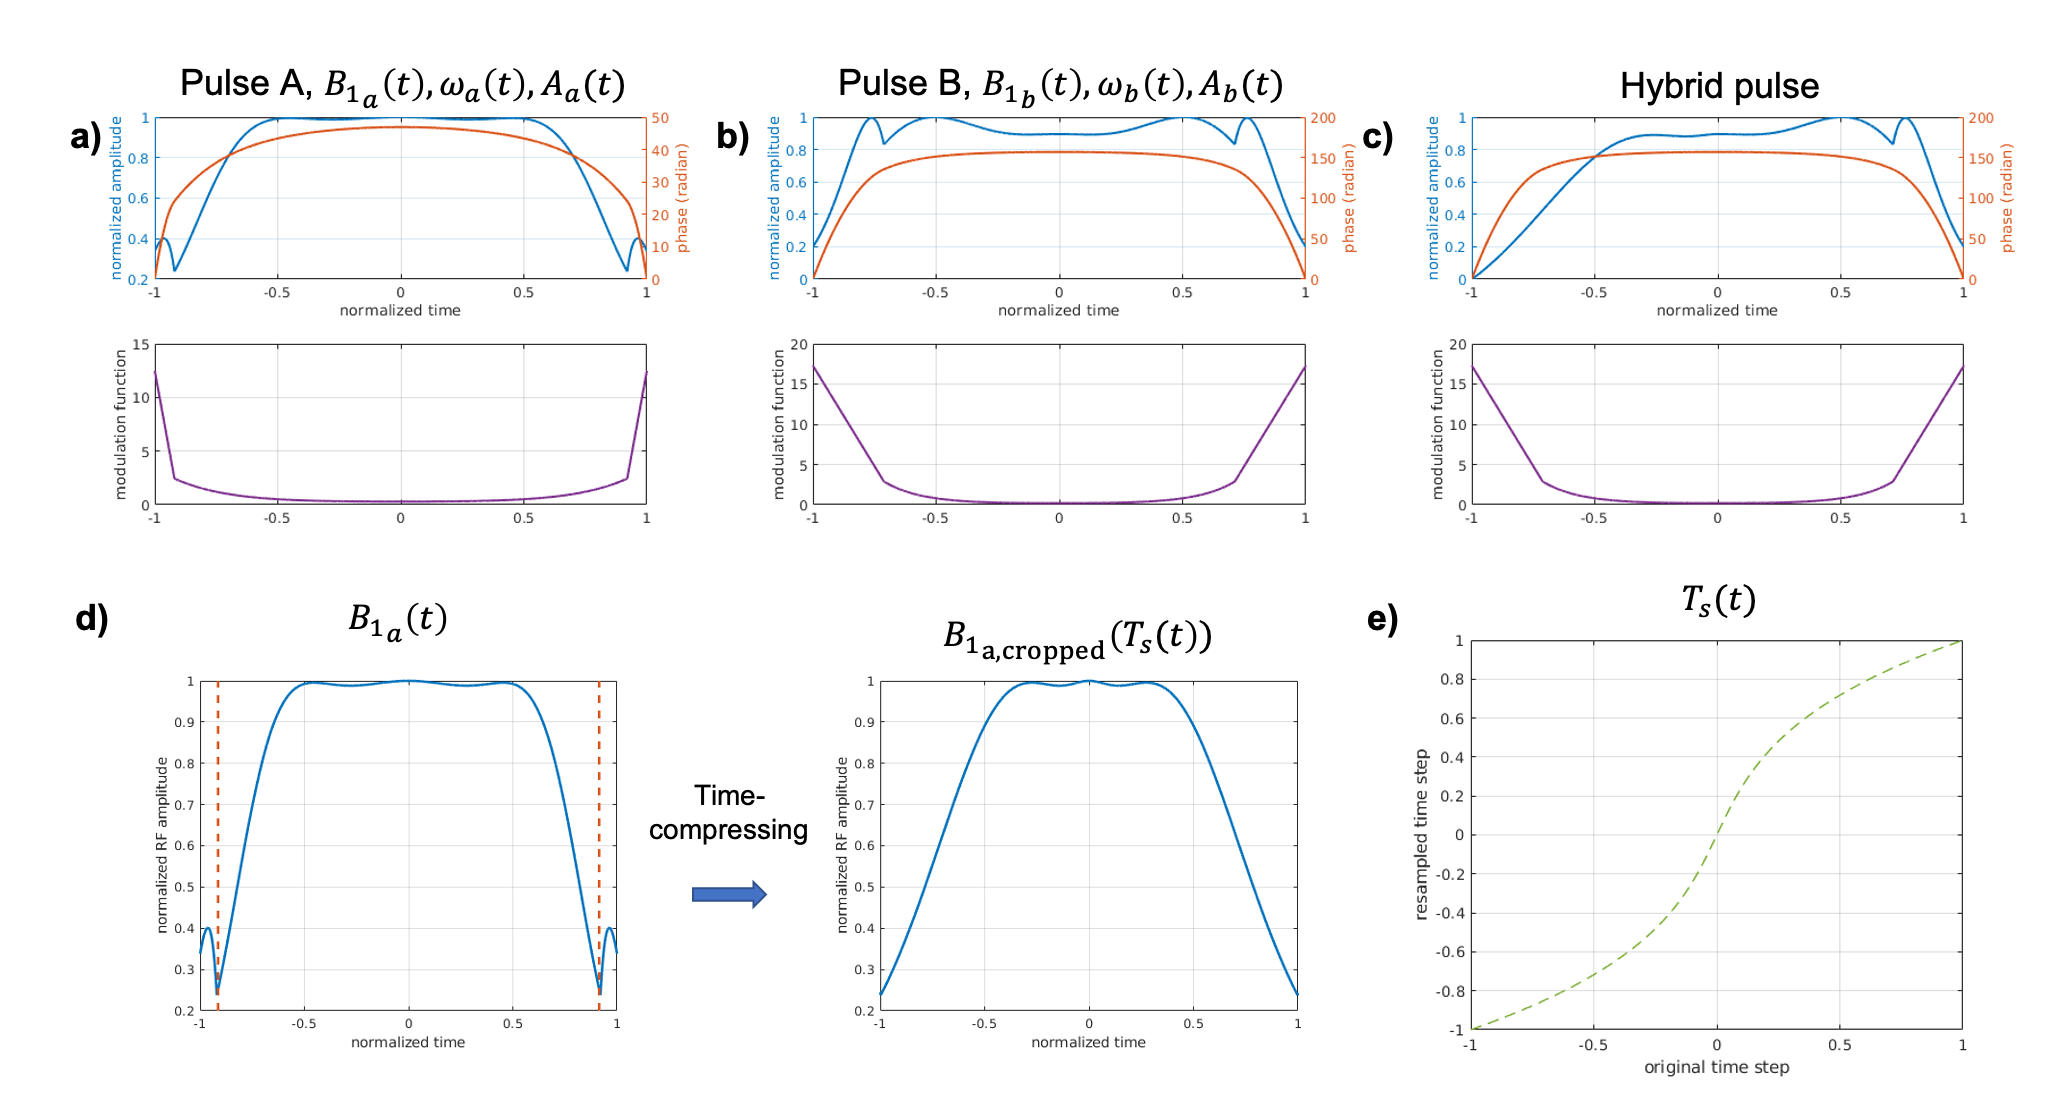
Pulse designTwo trFOCI pulses, Pulses A and B, were combined to create the asymmetric pulse; tr-FOCI Pulse A (Figure 1a) was used in a previous 7T-PICORE-ASL study1, while tr-FOCI Pulse B (Figure 1b) was generated from optimization of the cost function introduced by Wang et al10.
The proposed asymmetric Hybrid pulse (Figure 1c) is defined as:
Radiofrequency (RF) Amplitude function: $$${B_1}_{\text{hybrid}}(t) = \begin{cases}{m}\cdot{B_1}_{a,\text{cropped}}(T_s(t)) &-1 < t < 0\\{B_1}_b(t)&0 < t < 1 \end{cases}$$$
RF Phase function: $$$\omega_{\text{hybrid}}(t)=\omega_{b}(t)$$$
Gradient Modulation function: $$$A_{\text{hybrid}}=A_b(t)$$$
Here $$${B_1}_a(t)$$$, $$${B_1}_{b}(t)$$$ are the RF amplitude functions of Pulse A and B and $$$m=\frac{{B_1}_b(0)}{{B_1}_{a,\text{cropped}}(T_s(0))}$$$. $$${B_1}_{a,\text{cropped}}(t)$$$ (Figure 1d) is taken from the center section of $$${B_1}_{a}(t)$$$ and compressed by time-resampling function $$$T_s(t)$$$ (Figure 1e).
A SAR-reduced Hybrid pulse (same duration as Pulse A) and a SAR-matched Hybrid pulse (same power as Pulse A) are considered in the current study.
Simulation
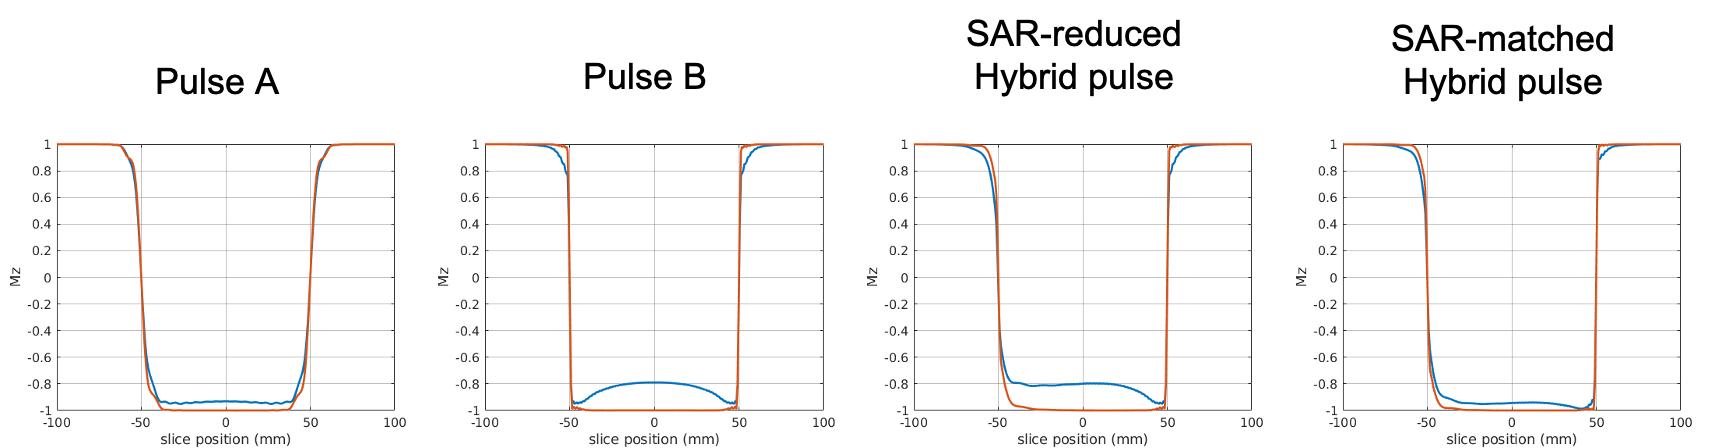
Bloch equation simulation of the four inversion pulses (Pulse A, Pulse B, SAR-reduced and SAR-matched Hybrid pulses) was done in MATLAB with inversion thickness=100mm. Two peak B1 values were chosen: 5$$$\mu$$$T and 10$$$\mu$$$T.
Data acquisition
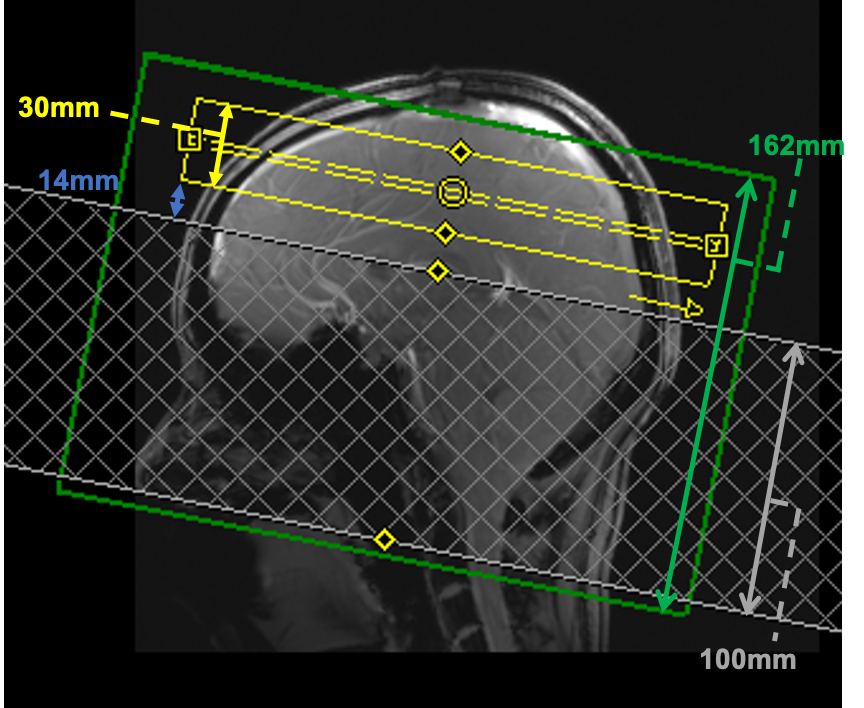
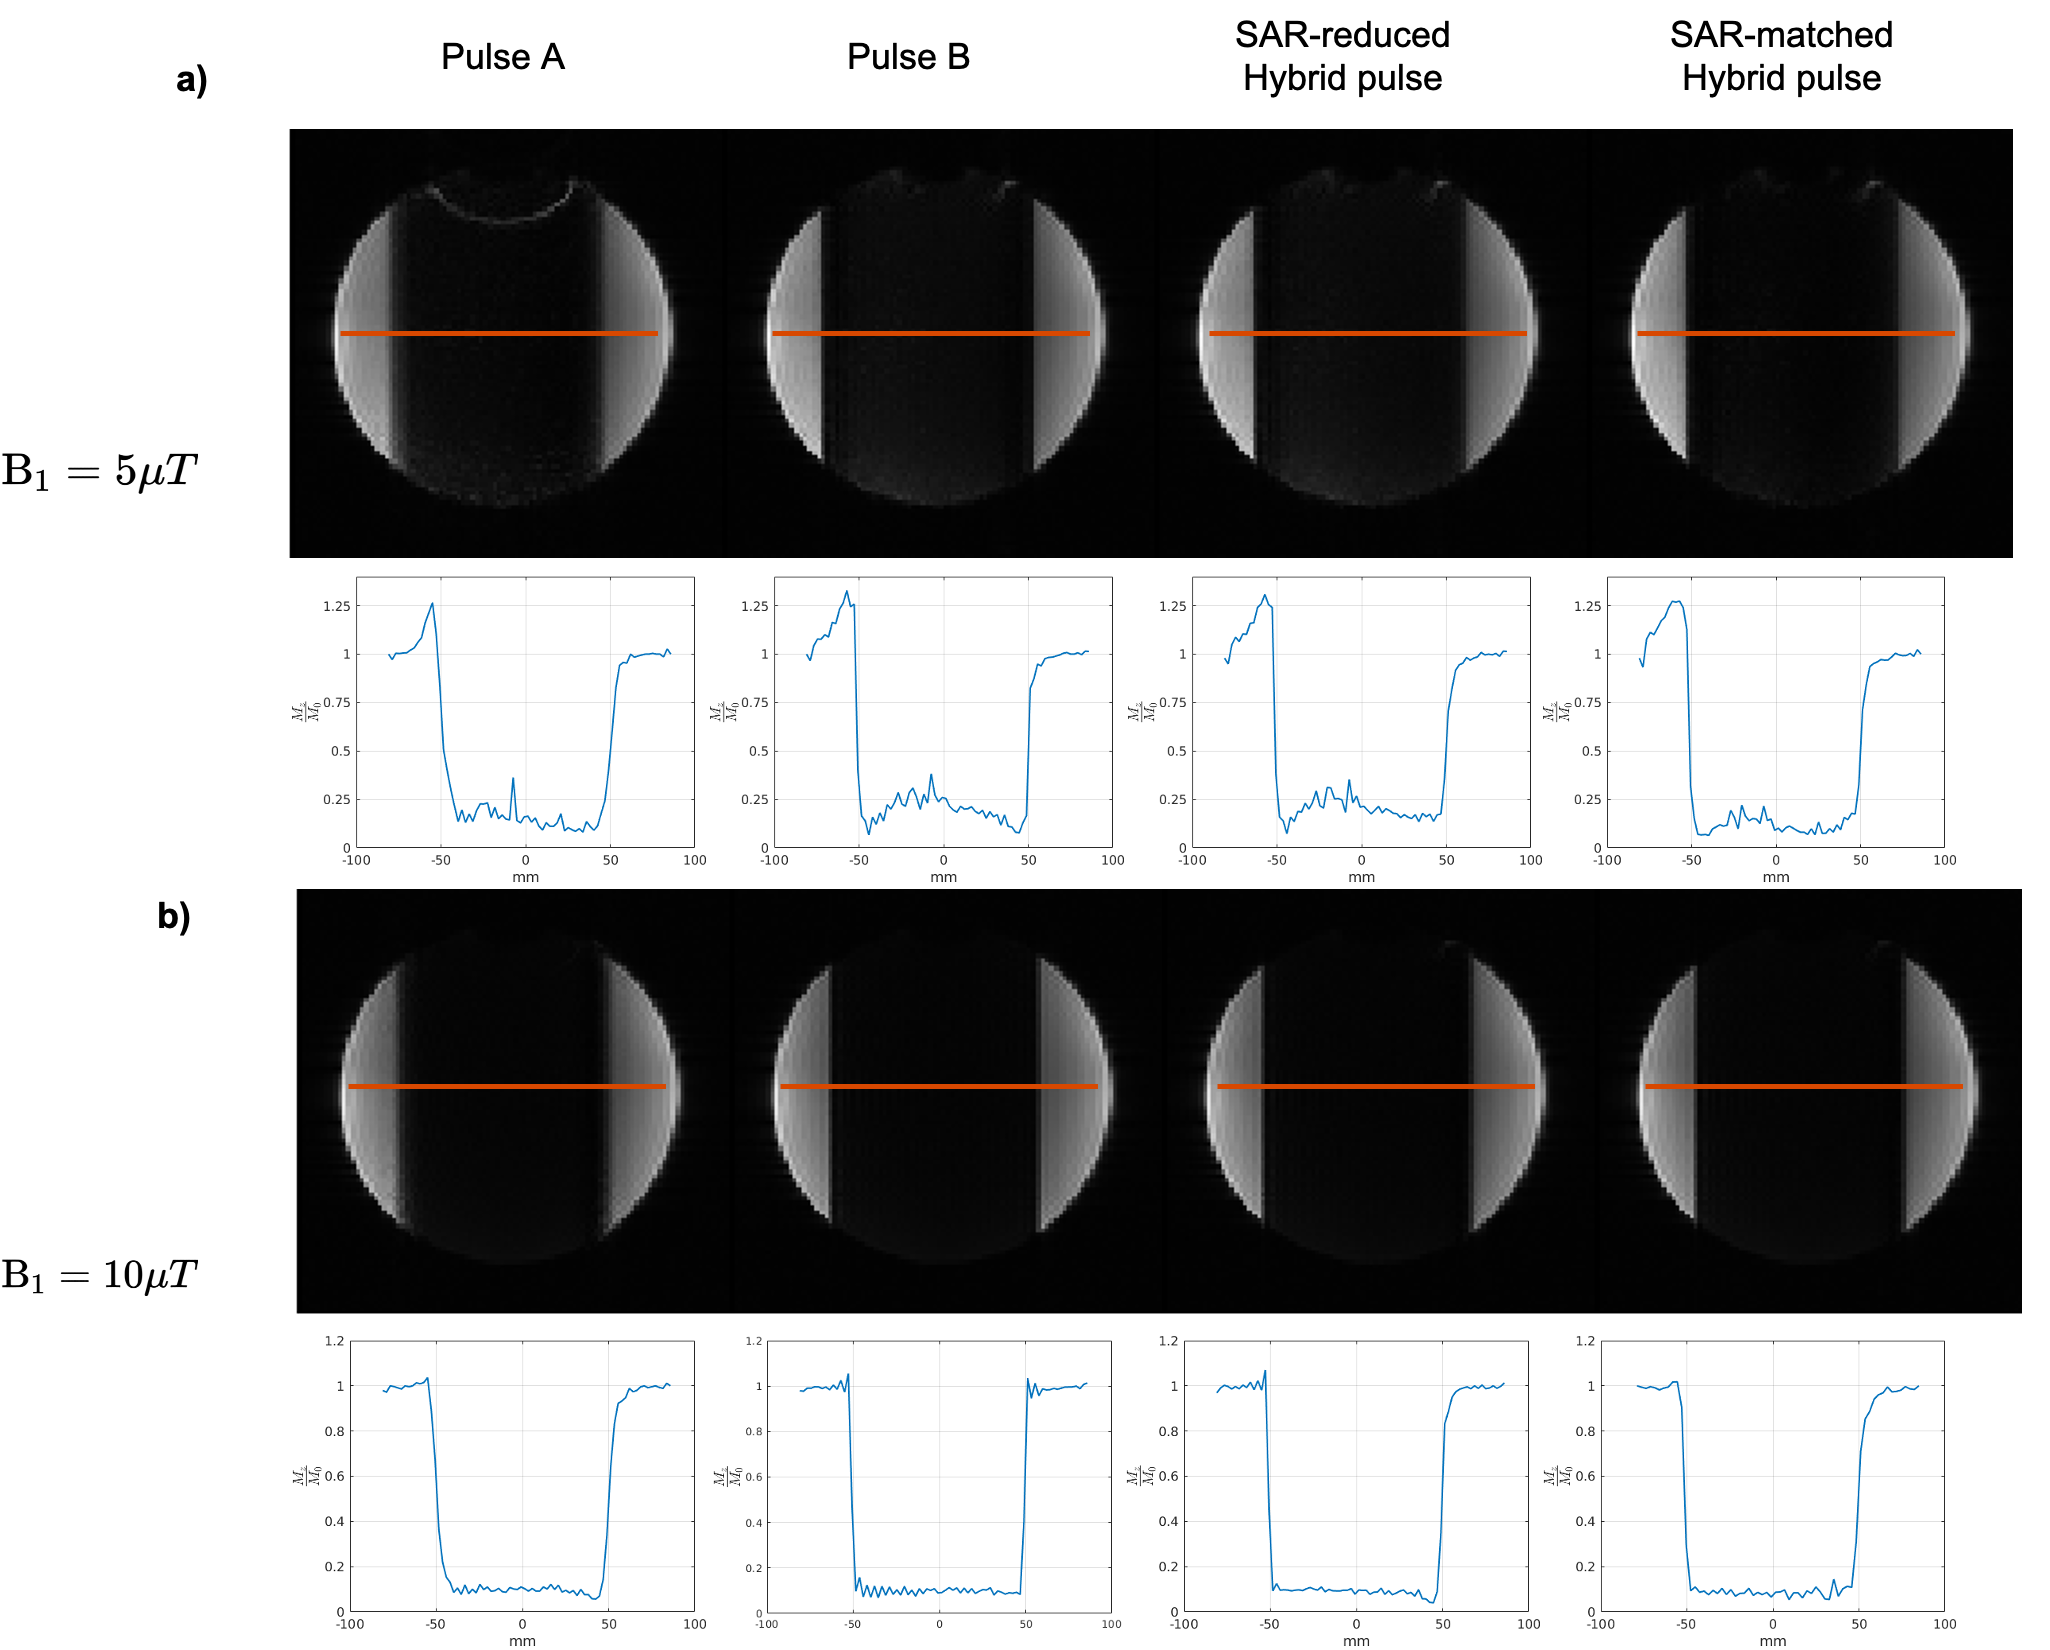
Phantom and in vivo scans were performed on an investigational 7T whole-body MRI scanner (MAGNETOM 7T plus, Siemens Healthcare, Erlangen, Germany) using an 8Tx-32Rx head coil (Nova Medical Inc. USA). An oil phantom was scanned to test the inversion pulses using an IR-FLASH sequence with the peak inversion pulse voltage at 168V (10$$$\mu$$$T) and 84V (5$$$\mu$$$T) (reference voltage=204V). PICORE-ASL with Q2TIPS11 pulses (TI1 = 700ms, TI2 = 1800ms) was used, with positions of the labelling region and imaging slab as shown in Figure 2. Fifteen label-control pairs and one $$$M_0$$$ image were acquired using 2D GE-EPI sequence (TE/TR=11/3500ms, resolution=2.5mm-isotropic, in-plane acceleration (GRAPPA) factor=3, bandwidth=1690Hz/px, number of slices=12). Fifteen label-control pairs and one image were acquired, with reference voltage 270V and peak voltage of all four pulses 400V, calibrated manually. Pulse power was measured as ($$$\int {B^2_1}(t)dt$$$).
T1-weighted images were acquired using MP2RAGE (TI1/TI2=700/2700ms, TE/TR=2.04/5000ms, resolution=0.75mm-isotropic) for FAST13 brain segmentation.
Results & Discussion
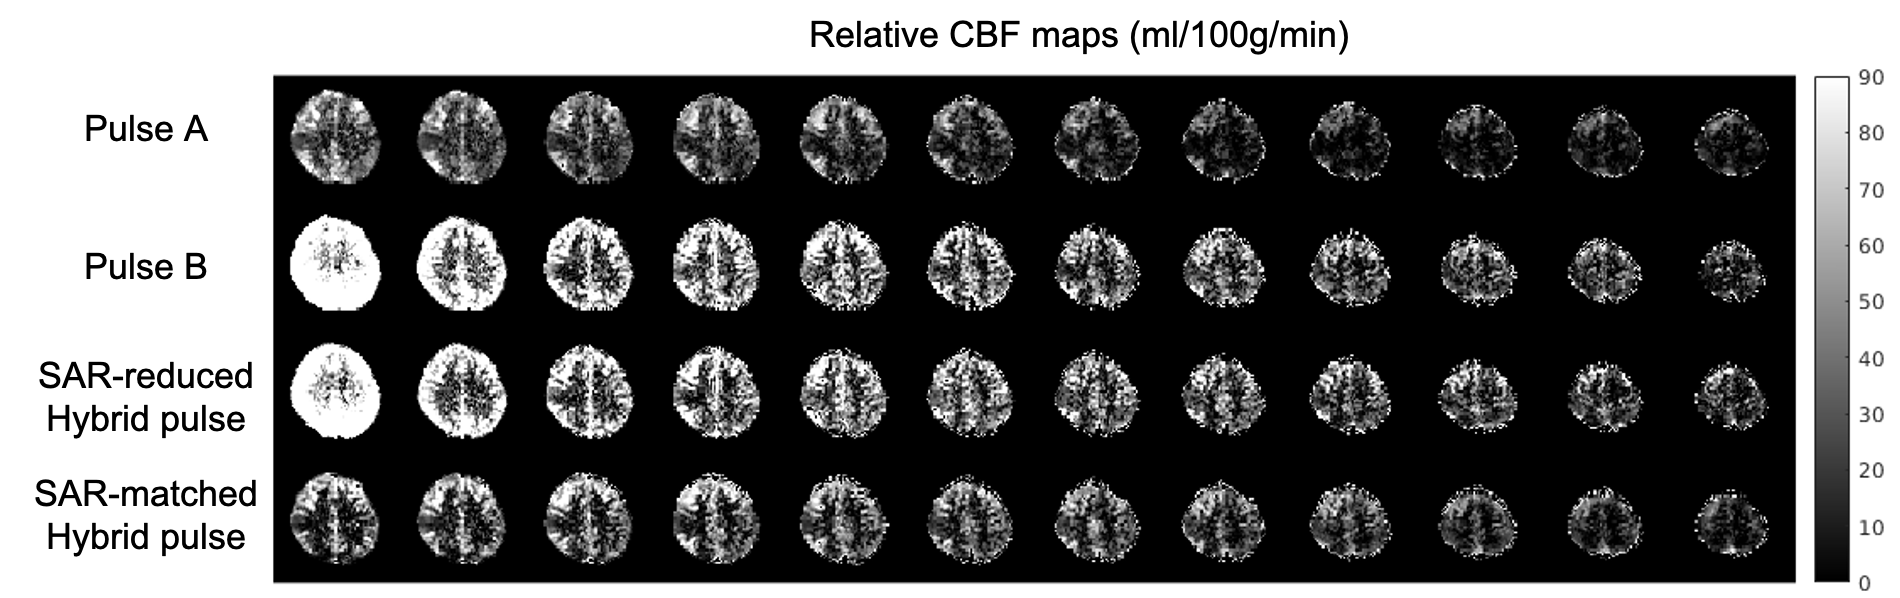
In simulation, the SAR-matched Hybrid pulse power of 7.64 matched Pulse A, while the SAR-reduced Hybrid pulse power (6.36) achieves approximately 17% and 20% power reduction compared with Pulses A and B (7.90), respectively. This is reflected in phantom scans that at $$$B_1=10\mu$$$T, the SAR-reduced Hybrid pulse achieved 18.6% and 20.4% SAR reduction compared with Pulses A and B, respectively. Simulation results (Figure 3) demonstrate that all four pulses achieve no less than 80% inversion efficiency at all simulated B1 amplitudes. The desired asymmetric inversion profiles were obtained (Figure 4). Note that the asymmetric side in the phantom images is flipped compared with simulations, due to a negative inversion pulse gradient. For the phantom scans, the fluctuation in the passband was likely due to $$$T_2$$$ relaxation9, which was not considered in simulation. Furthermore, the SAR-matched Hybrid pulse achieved better inversion efficiency than both the SAR-reduced Hybrid and Pulse B, and a sharper transition band than Pulse A without increasing power deposition.SAR-reduced Hybrid pulse in Q2TIPS-PICORE achieved 15% and 10% SAR reduction compared to Pulse A and Pulse B respectively. Compared to Pulse A, both Hybrid pulses achieved an increase in the averaged relCBF value in grey matter. Compared to Pulse B, using around 5% lower SAR, the SAR-matched Hybrid pulse generated less residual signal in the slice adjacent to the tagged region, caused by $$$T_2$$$ relaxation-related passband fluctuation as in the phantom results (Figure 5).
Conclusion
A SAR-reduced asymmetric hybrid tr-FOCI pulse was presented in the current study. Both simulation and experimental results show the potential to achieve SAR reduction without sacrificing labelling efficiency using an asymmetric RF amplitude function. In vivo scans using Q2TIPS-PICORE show that relCBF measurement may be improved in addition to SAR reduction. Based on the current results, an advanced optimization process that considers $$$T_2$$$ relaxation effects will be considered, to make the inversion more robust to these effects.Acknowledgements
We acknowledge the facilities, and the scientific and technical assistance of the Australian National Imaging Facility, a National Collaborative Research Infrastructure Strategy (NCRIS) capability, at the Melbourne Brain Centre Imaging Unit of the University of Melbourne. The work is also supported by a research collaboration agreement with Siemens Healthineers.References
1. Zimmer, F., O’Brien, K., Bollmann, S., et al. Pulsed arterial spin labelling at ultra-high field with a B 1+-optimised adiabatic labelling pulse. Magnetic Resonance Materials in Physics, Biology and Medicine. 2016; 29(3): 463-473.
2. Hurley, A. C., Al‐Radaideh, A., Bai, L., et al. Tailored RF pulse for magnetization inversion at ultrahigh field. Magnetic Resonance in Medicine. 2010; 63(1): 51-58.
3. Ivanov, D., Poser, B. A., Huber, L., et al. Optimization of simultaneous multislice EPI for concurrent functional perfusion and BOLD signal measurements at 7T. Magnetic Resonance in Medicine. 2014; 78(1): 121-129.
4. Silver, M. S., Joseph, R. I., & Hoult, D. I. Highly selective $$$\pi$$$/2 and $$$\pi$$$ pulse generation. Journal of Magnetic Resonance. 1984; 59(2): 347-351.
5. Ordidge, R. J., Wylezinska, M., Hugg, J. W., et al. Frequency offset corrected inversion (FOCI) pulses for use in localized spectroscopy. Magnetic Resonance in Medicine. 1996; 36(4): 562-566.
6. Rosenfeld, D., Panfil, S. L., & Zur, Y. Design of adiabatic pulses for fat‐suppression using analytic solutions of the Bloch equation. Magnetic Resonance in Medicine. 1997; 37(5): 793-801.
7. Hwang, T. L., Van Zijl, P. C., & Garwood, M. Asymmetric adiabatic pulses for NH selection. Journal of Magnetic Resonance. 1999; 138(1): 173-177.
8. Wong, E. C., Buxton, R. B., & Frank, L. R. Implementation of quantitative perfusion imaging techniques for functional brain mapping using pulsed arterial spin labeling. NMR in Biomedicine. 1997; 10(4‐5): 237-249.
9. Frank, L. R., Wong, E. C., & Buxton, R. B. Slice profile effects in adiabatic inversion: application to multislice perfusion imaging. Magnetic Resonance in Medicine. 1997; 38(4): 558-564.
10. Wang, K., Shao, X., Yan, L., et al. Optimization of adiabatic pulses for pulsed arterial spin labelling at 7 Tesla: Comparison with pseudo‐continuous arterial spin labelling. Magnetic Resonance in Medicine. 2021; 21(6): 3227-3240.
11. Luh, W. M., Wong, E. C., Bandettini, P. A., et al. QUIPSS II with thin‐slice TI1 periodic saturation: a method for improving accuracy of quantitative perfusion imaging using pulsed arterial spin labeling. Magnetic Resonance in Medicine. 1997; 41(6): 1246-1254.
12. Chappell, M. A., Groves, A. R., Whitcher, B., et al. Variational Bayesian inference for a nonlinear forward model. IEEE Transactions on Signal Processing. 2008; 57(1): 223-236.
13. Zhang, Y., Brady, M., & Smith, S. Segmentation of brain MR images through a hidden Markov random field model and the expectation-maximization algorithm. IEEE Transactions on Medical Imaging. 2001; 20(1): 45–57.
Figures