0911
A vortical phantom for ASL perfusion MRI
Aaron Oliver-Taylor1 and Xavier Golay1,2
1Gold Standard Phantoms, London, United Kingdom, 2Queen Square Institute of Neurology, University College London, London, United Kingdom
1Gold Standard Phantoms, London, United Kingdom, 2Queen Square Institute of Neurology, University College London, London, United Kingdom
Synopsis
Most perfusion phantoms that have been created make use of porous media to simulate the microvasculature, however their characterisation introduces additional uncertainties into a perfusion measurement. We take inspiration from a recently published impinging jet perfusion phantom and presenting a phantom that makes use of vortices to mix and disperse the perfusion signal. Multi post labelling delay pCASL data was acquired, and fit to the general kinetic model. By assuming the measured perfusion equates to the equivalent perfusion from the systemic flow rate the labelling efficiency can be estimated, and the resultant measured and fitted signal curves closely match.
Introduction
Despite standardisation of Arterial Spin Labelling (ASL) implementations1, it is challenging to demonstrate ASL as a truly quantitative and calibrated measurement technique, in particular in validating against a reference standard. Currently, reference standards are either based on independent measurements using a validated method (for ASL, this would be 15O-PET2), or the use of phantoms.The majority of existing perfusion phantoms for ASL rely upon a distribution network and/or a porous media to simulate the microvasculature3–5. A recent new phantom design based on impinging jets6 is able to simulate perfusion without the presence of e.g. a porous media. This has advantages because there is no need to separately characterise the properties of the porous media, reducing the overall uncertainty associated with a perfusion measurement. Here, we investigate whether a commercially available perfusion phantom7 can be adapted to this concept.
Methods
The perfusion chamber from a commercial perfusion phantom was modified by removing the set of six porous discs and their retaining hardware, resulting in sixty 1mm tubes entering the perfusion chamber. It was filled with the standard water-based perfusate, and connected as normal to the pump system.The phantom was scanned on a 3T MRI system (Achieva dStream, Philips Healthcare) at a system flow rate of 350ml/min. Four pCASL 2D-EPI control label pairs were acquired for post labelling delays (PLD) ranging from 0.8 to 2.4s (0.2s increment); each comprising 14 slices, 4mm slice thickness, 2 x 2mm in-plane resolution, 128x96 acquisition matrix, 256 x 192 x 56mm FOV, flow compensated, EPI factor of 7, SENSE factor 2.3, 8 shot, 1.8s label duration, 8.622ms TE, 5s TR, 260s acquisition duration per PLD. A M0 with the same acquisition parameters was also acquired. In addition, a time-of-flight (TOF) angiogram of the entire perfusion chamber and single-slice sagittal phase contrast velocimetry with weighting along all three axes were acquired.
ASL data was converted to NIFTI using dcm2niix, and then analysed using custom software developed using Matlab (R2016b, The Mathworks), comprising pairwise subtraction and averaging over dynamics, construction of a 4D multi-PLD image, manual drawing of a mask region of interest (ROI) encompassing the entire perfusion chamber, fitting of the General Kinetic Model7,8 to the mean perfusion signal within this ROI, assuming perfusate $$$T_1=1.25 s$$$, and the partition coefficient, $$$\lambda =1.0 g/ml $$$. The corresponding mean perfusion within the ROI was also calculated based on the measured pump flow rate as $$$f_{pump} = \frac{100 Q}{M_{ROI}}$$$, where Q is the flow rate in ml/min, MROI is the mass of the voxels in the mask ROI, assuming a perfusate density of 1g/ml. The effective labelling efficiency was then calculated as the ratio of ASL and flow rate derived perfusion values, and then used to normalise the ASL derived perfusion rate.
Results
Figure 1, a sagittal maximum intensity projection from the TOF angiogram shows the general path within the perfusion chamber. This flow becomes vortical, as indicated by the phase contrast-based velocimetry image in Figure 2, and the separate inlet streams mix. Tracer kinetics for a slice at the inlet and outlet of the perfusion chamber are shown in the images of $$$\frac{M}{M_0}$$$ for each PLD in Figure 3.Signal curves for the measured global $$$\frac{M}{M_0}$$$ within the perfusion chamber, and based on the fitted values for perfusion rate and transit time are shown in Figure 4. The fitted value for transit time was 1.25s, and after normalisation using measured flow rate (350.00 ± 3.38 ml/min) the estimated labelling efficiency was 0.6055 and the sum-of-squares error between measured and fitted curves was 3.99x10⁻⁷.
Discussion
Results demonstrate that it is possible to simulate perfusion without the need for porous media or impinging jets, utilising vortical mixing from multiple adjacent inlets. In comparison with human data9, the calibrated flow measurement system within the phantom provides greater accuracy in the systemic flow rate and so once corrected for estimated labelling efficiency, the measured data closely matches modelled data. However, due to clinical software restrictions it was not possible to acquire an extended range of PLDs, which would improve this assessment. The actual labelling efficiency of 0.6 is significantly lower than would be expected for the velocities in the labelling tube (20-40ms), however, the phantom is irregularly shaped and so a poor shim may explain this reduction in efficiency.A phantom in which it is possible to equate measured perfusion with the systemic flow rate has great appeal: validation of new imaging methods10; a measurement of labelling efficiency alongside independent measurements of T1 and $$$\alpha$$$; assessment of linearity between flow and measured ASL perfusion, necessary for establishing claims for QIBA11 profiles where there is a requirement to demonstrate the linearity between a quantitative imaging biomarker and physical inputs, based on a reference standard; as well as routine quality assurance of ASL acquisitions.
Conclusion
Presented is a perfusion phantom that demonstrates porous media free perfusion. As no porous media needs to be characterised, we are able to equate the measured perfusion with the pump flow rate. Future work will be to acquire a fuller set of PLDs, and to independently measure the labelling efficiency for verification.Acknowledgements
This work is part of Eurostars-Project ASPIRE 01QE2026A is funded by the Eurostars program via the Federal Ministry of Education and Research, Innovate UK, and the Netherlands Enterprise Agency (RvO).References
- Alsop, D. C. et al. Recommended implementation of arterial spin-labeled perfusion MRI for clinical applications: A consensus of the ISMRM perfusion study group and the European consortium for ASL in dementia: Recommended Implementation of ASL for Clinical Applications. Magn. Reson. Med. 73, 102–116 (2015).
- Fan, A. P., Jahanian, H., Holdsworth, S. J. & Zaharchuk, G. Comparison of cerebral blood flow measurement with [ 15 O]-water positron emission tomography and arterial spin labeling magnetic resonance imaging: A systematic review. J. Cereb. Blood Flow Metab. 36, 842–861 (2016).
- Oliver-Taylor, A. et al. A Calibrated Perfusion Phantom for Quality Assurance of Quantitative Arterial Spin Labelling. in Proc. Intl. Soc. Mag. Reson. Med. 25 A0681 (2017).
- Stafford, R. B., Langham, M. C., Davis, S. V., Lee, J. & Detre, J. A. A Standardization Phantom for Quantitative Perfusion with Arterial Spin Labeling. in Proc. Intl. Soc. Mag. Reson. Med. 22 A4572 (2014).
- Esparza-Coss, E., Wosik, J. & Narayana, P. A. Perfusion in rat brain at 7 T with arterial spin labeling using FAIR-TrueFISP and QUIPSS. Magn. Reson. Imaging 28, 607–612 (2010).
- Gabrielyan, M. et al. A perfusion phantom for ASL MRI based on impinging jets. Magn. Reson. Med. 86, 1145–1158 (2021).
- Golay, X., Oliver-Taylor, A., Suzuki, Y. & Chappell, M. How to quantity ASL values in a perfusion phantom. in ESMRMB 2019 Congress A1672 (2019). doi:https://doi.org/10.1007/s10334-019-00754-2.
- Buxton, R. B. et al. A general kinetic model for quantitative perfusion imaging with arterial spin labeling. Magn. Reson. Med. 40, 383–396 (1998).
- Aslan, S. et al. Estimation of labeling efficiency in pseudocontinuous arterial spin labeling: Estimation of Labeling Efficiency in pCASL. Magn. Reson. Med. 63, 765–771 (2010).
- Xu, F. et al. Magnetic resonance angiography and perfusion mapping by arterial spin labeling using Fourier transform–based velocity‐selective pulse trains: Examination on a commercial perfusion phantom. Magn. Reson. Med. 86, 1360–1368 (2021).
- QIBA. https://www.rsna.org/research/quantitative-imaging-biomarkers-alliance.
Figures
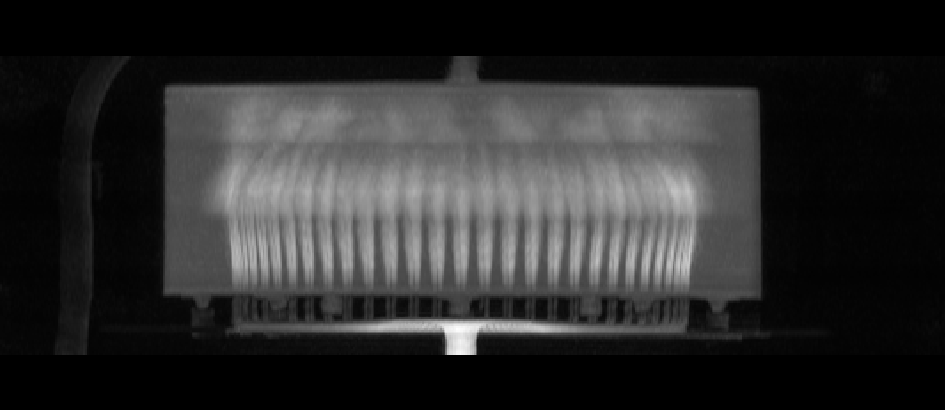
Sagittal maximum intensity projection (MIP) from the TOF, showing the 60 ‘arteriole’ inlets. Banding due to the multiple slabs that make up the acquisition are visible.
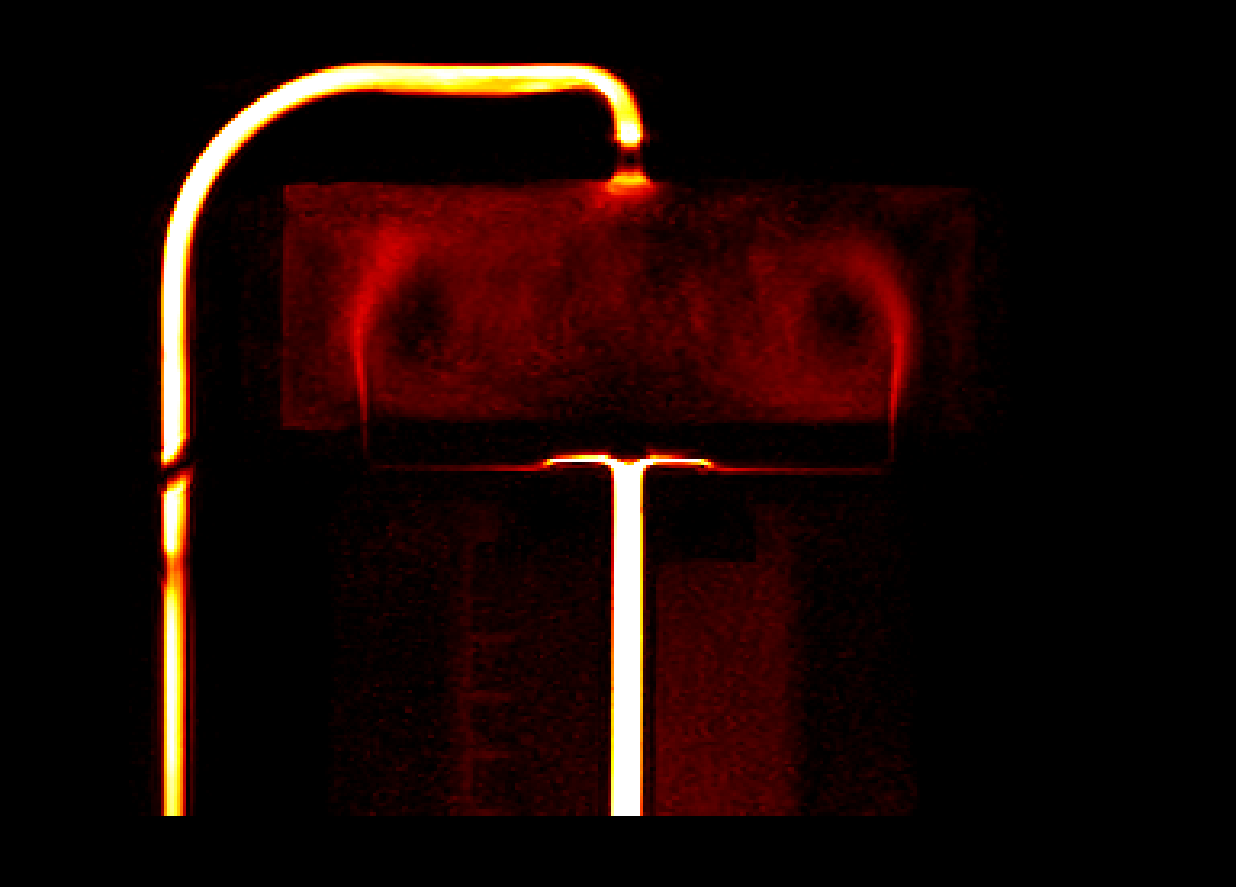
Phase contrast velocimetry image through the middle of the phantom showing the calculated norm of the velocity vector in each pixel. The dark regions just inside the inlets indicate that vortices develop, consisting of rotating currents that recirculate perfusate towards the centre of the chamber and then back towards the inlets.
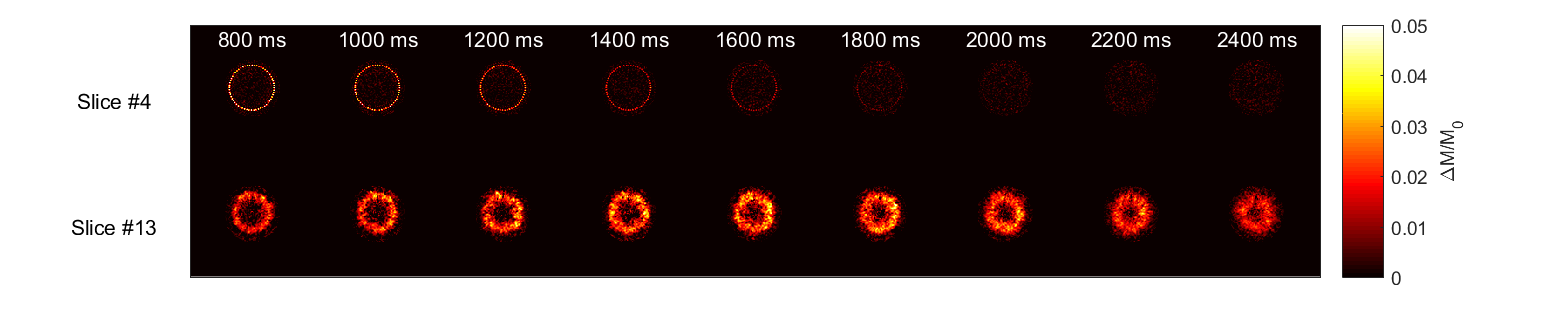
$$$\frac{\Delta M}{M_0}$$$ images for a slice close to the inlets (slice #4) and outlet (slice #13) of the perfusion chamber. Signal has not yet left the perfusion chamber at a PLD of 2.4s, indicated by the hypointense region at the centre of slice #13 for PLD = 2400ms.
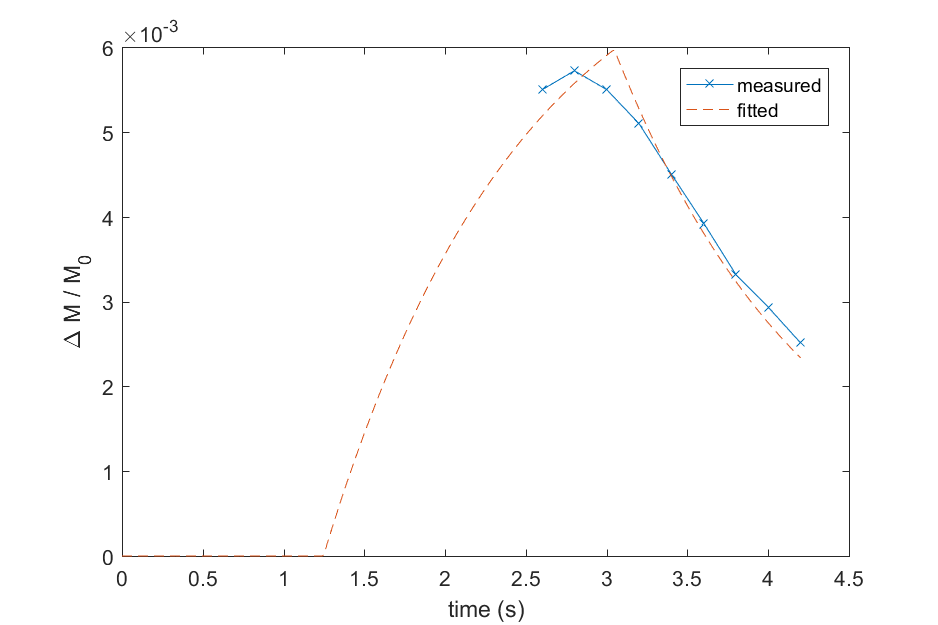
$$$\frac{\Delta M}{M_0}$$$ plots against time (since labelling onset) for the measured data (blue line) and a calculated curve based on the fitted values for perfusion rate and transit time, corrected for labelling efficiency (orange dashed line).
DOI: https://doi.org/10.58530/2022/0911