0910
The Open Science Initiative for Perfusion Imaging (OSIPI): Results from the ASL MRI Challenge
Udunna Anazodo1,2, Joana Pinto3, Flora Kennedy McConnell4,5,6, Cassandra Gould van Praag7,8, Henk Mutsaerts9, Aaron Oliver Taylor10, Jan Petr11, Diego Pineda-Ordóñez12, Maria-Eleni Dounavi13, Irène Brumer14, Wei Siang Marcus Chan14, Jack Toner15, Jian Hu15, Logan X. Zhang3, Laura Bell16, Joseph G. Woods17, Moss Y Zhao18, Paula Croal4,5, and Andre Monteiro Paschoal19
1Lawson Health Research Institute,, London, ON, Canada, 2Western University, London, ON, Canada, 3Institute of Biomedical Engineering, Department of Engineering Science, University of Oxford, Oxford, United Kingdom, 4Radiological Sciences, Division of Clinical Neuroscience, School of Medicine, University of Nottingham, Nottingham, United Kingdom, 5Sir Peter Mansfield Imaging Centre, School of Medicine, University of Nottingham, Nottingham, United Kingdom, 6Nottingham Biomedical Research Centre, Queens Medical Centre, Nottingham, United Kingdom, 7Wellcome Centre for Integrative Neuroimaging, University of Oxford, Oxford, United Kingdom, 8Department of Psychiatry, University of Oxford, Oxford, United Kingdom, 9Department of Radiology and Nuclear Medicine, Amsterdam Neuroscience, Amsterdam University Medical Center,, Amsterdam, Netherlands, 10Gold Standard Phantoms Limited, London, United Kingdom, 11Helmholtz-Zentrum Dresden-Rossendorf, Institute of Radiopharmaceutical cancer research, Dresden, Germany, 12Department of Radiology, Clinica Del Country, Bogotá, Colombia, 13Department of Psychiatry, University of Cambridge, Cambridge, United Kingdom, 14Computer Assisted Clinical Medicine, Mannheim Institute for Intelligent Systems in Medicine, Medical Faculty Mannheim, Heidelberg University, Heidelberg, Germany, 15Mental Health & Clinical Neurosciences, School of Medicine, University of Nottingham, Nottingham, United Kingdom, 16Genentech, Inc., South San Francisco, CA, United States, 17Center for Functional Magnetic Resonance Imaging, Department of Radiology, University of California San Diego, La Jolla, CA, United States, 18Department of Radiology, Stanford University, Stanford, CA, United States, 19Institute of Radiology and Department of Radiology and Oncology, University of Sao Paulo, Sao Paulo, Brazil
1Lawson Health Research Institute,, London, ON, Canada, 2Western University, London, ON, Canada, 3Institute of Biomedical Engineering, Department of Engineering Science, University of Oxford, Oxford, United Kingdom, 4Radiological Sciences, Division of Clinical Neuroscience, School of Medicine, University of Nottingham, Nottingham, United Kingdom, 5Sir Peter Mansfield Imaging Centre, School of Medicine, University of Nottingham, Nottingham, United Kingdom, 6Nottingham Biomedical Research Centre, Queens Medical Centre, Nottingham, United Kingdom, 7Wellcome Centre for Integrative Neuroimaging, University of Oxford, Oxford, United Kingdom, 8Department of Psychiatry, University of Oxford, Oxford, United Kingdom, 9Department of Radiology and Nuclear Medicine, Amsterdam Neuroscience, Amsterdam University Medical Center,, Amsterdam, Netherlands, 10Gold Standard Phantoms Limited, London, United Kingdom, 11Helmholtz-Zentrum Dresden-Rossendorf, Institute of Radiopharmaceutical cancer research, Dresden, Germany, 12Department of Radiology, Clinica Del Country, Bogotá, Colombia, 13Department of Psychiatry, University of Cambridge, Cambridge, United Kingdom, 14Computer Assisted Clinical Medicine, Mannheim Institute for Intelligent Systems in Medicine, Medical Faculty Mannheim, Heidelberg University, Heidelberg, Germany, 15Mental Health & Clinical Neurosciences, School of Medicine, University of Nottingham, Nottingham, United Kingdom, 16Genentech, Inc., South San Francisco, CA, United States, 17Center for Functional Magnetic Resonance Imaging, Department of Radiology, University of California San Diego, La Jolla, CA, United States, 18Department of Radiology, Stanford University, Stanford, CA, United States, 19Institute of Radiology and Department of Radiology and Oncology, University of Sao Paulo, Sao Paulo, Brazil
Synopsis
The OSIPI ASL MRI Challenge is an initiative of the ASL community aiming to characterize the variability of CBF quantification arising from different pipelines. The goal of this challenge is to establish best practice in ASL data processing, understand the sources of variability, make ASL analysis more reproducible, and enable fair comparison between studies. Here, we analyzed 3 submitted entries from 7 teams registered in the challenge. The preliminary results showed pipelines based in different programming languages and analysis tools, leading to important variability in the quantitative CBF maps compared to the ground-truth.
Introduction
Arterial spin labeling (ASL) is a non-invasive perfusion MRI method1 whose translation towards clinical practice is continuously increasing. However, successful use of ASL in clinical research and practice relies on the standardization of acquisition protocols to allow studies comparison and image processing pipelines that provide reproducible, reliable and/or quantitative metrics. While the ASL “White Paper” reached a consensus on appropriate clinical acquisition protocols1, there is still quite a heterogeneity of image processing pipelines, leading to results that cannot be compared between studies, let alone pooled for metadata analyses.MRI focused challenges may play an important role in the comparison and validation of novel methods2,3, which motivated the ISMRM Open Science Initiative for Perfusion Imaging (OSIPI) to organize the ISMRM ASL MRI challenge. Launched in February 2021 and introduced at the 2021 ISMRM annual meeting4 (complete timeline is shown in Figure 1), the ASL challenge is focused on comparing image processing pipelines regarding image analysis and quantification of ASL perfusion-related parameters. We will assess the qualitative reproducibility of the pipelines based on the completeness of the supporting methods documentation. We expect to quantify the effective heterogeneity of the results from different pipelines used by the community, hopefully allowing a better understanding of the main components leading to the variety of pipeline results. In this abstract, we report the preliminary results for the challenge, providing an overview of the used analysis tools as well as illustrative results of data from the participants to highlight their differences and exemplify key scoring points. Reproducibility report will be released after the announcement of the challenge winner to avoid biasing future submissions.
Methods
Imaging data: The ASL MRI challenge data consisted of ten pseudo-continuous ASL (PCASL) datasets: one population-based and nine synthetic data simulated using an existing ASL-DRO5. All data was in ASL-BIDS format6: 4D control-label time-series with a separate M0 image, and a high-resolution T1-weighted anatomical image. The detailed parameters are shown in Figure 2.Evaluation: Entries were scored 0-100 according to: 1) voxel-wise and region-wise CBF accuracy by measuring the errors compared to the ground-truth perfusion map (scored 0-70); 2) Reproducibility of the analysis results using description of the pipeline reported in the documentation submitted by the participants (scored 0-20); and 3) The quality of the documentation provided (scored 0-10) (https://challenge.ismrm.org/wp-content/uploads/2021/05/OSIPI_ASL_Challenge_Manual.pdf).
Results
Challenge setup: The challenge opened in May, 2021 and 7 participants registered thus far of which 3 participants have submitted their results. For each dataset, participants submitted a CBF map in native ASL space, along with mean GM and WM CBF values, and the GM and WM tissue masks. When partial volume correction (PVC) was performed, uncorrected and corrected results were submitted. The pipeline documentation with participants’ local scripts or detailed settings of software’s option was also included in the submission. Among the submissions received, participants have used pipelines based on different programming languages and image analysis tools, specifically in-house scripts in Matlab/SPM127, and FSL-based scripts (oxford_asl functions)8 and pipeline (Quantiphyse)9.The population-based CBF maps in Figure 3 illustrate that although the patterns for all entries are quite similar, the quantitative CBF values for gray matter (GM) are higher overall compared to ground truth. The variability among datasets and different entries is evidenced through the violin plots of Figure 4. Figure 5 shows illustrative CBF maps from one submission corrected for GM and WM partial volumes, for which the quantitative comparison of CBF maps is reported in the violin plots of Figure 5c.
Discussion
The results presented here illustrate how the analysis and quantification results can vary between pipelines and pipeline choices. The first obvious variability regards the choice of processing tool. Two of the three entries have used processing tools based on the oxford_asl function of FSL, while the other entry based the analysis in Matlab/SPM12. Interestingly, for the two entries processed with oxford_asl, the results were not the same. There were large differences in the population-based dataset and the distribution of CBF values in the white matter, which emphasises that pipeline choices can impact the final results.Another important analysis variance refers to the DROs 7, 8 and 9 that were simulated considering motion correction and whose results for entry 2 showed significantly higher CBF values when compared to the other two. This is a good example of how characteristics of the data can interact negatively with the processing pipeline and, therefore, must be taken into account.
Conclusion
The preliminary results reported in this abstract showed an interesting sample among the extensive range of different ASL processing pipelines and its variability in the quantitative perfusion measurements. The three entries submitted so far had three different ASL analysis tools and showed differences in the final CBF maps and estimated errors. Future challenge entries are expected to further highlight the variability in perfusion measurements from different pipelines, strengthening the need for standardization of ASL data processing.Acknowledgements
MYZ is supported by the American Heart Association (Grant: 826254).CGVP is funded by The Wellcome Trust and supported by the NIHR Oxford Health Biomedical Research Centre.
References
1. Alsop DC, et al. Recommended implementation of arterial spin-labeled perfusion MRI for clinical applications: A consensus of the ISMRM perfusion study group and the European consortium for ASL in dementia. Magn Reson Med. 2015;73(1):102–16. Available from: http://www.ncbi.nlm.nih.gov/pubmed/247154262. Pujol et al, The DTI challenge: toward standardized evaluation of diffusion tensor imaging tractography for neurosurgery. J Neuroimaging, 2015; 25(6):8782
3. Grissom et al., Advancing RF pulse design using an open-competition format: report from the 2015 ISMRM challenge. 2017; 78(4): 1352-1361
4. Anazodo et al., The Open Source Initiative for Perfusion Imaging (OSIPI) ASL MRI Challenge. Proc 21th Sci Meet Int Soc Magn Reson Med 2021. 2021
5. Pypi.org/project/asldro
6. Clement et al. “ASL-BIDS, the Brain Imaging Data Structure Extension for Arterial Spin Labeling.” PsyArXiv, 25 Oct. 2021. https://doi.org/10.31234/osf.io/e87y3
7. https://www.fil.ion.ucl.ac.uk/spm/software/spm12/
8. https://asl-docs.readthedocs.io/en/latest/index.html
9. https://eng.ox.ac.uk/quantiphyse/
Figures
Figure 1: Projected timeline for the OSIPI ASL Challenge. The challenge was open for a period of six months, with winning teams presenting at the ISMRM Perfusion Study Group meeting at ISMRM 2022.
Figure 2: Detailed dataset parameters for the population-based data set and the parameters of reference to simulate the synthetic datasets.
Figure 3: Estimated non-PVC CBF from a) population-based dataset and b) Synthetic - DRO dataset for all the three entries received in ASL challenge. (Two slices are shown in each case)
Figure 4: Quantitative gray and white matter CBF measurements for all datasets of the three entries.
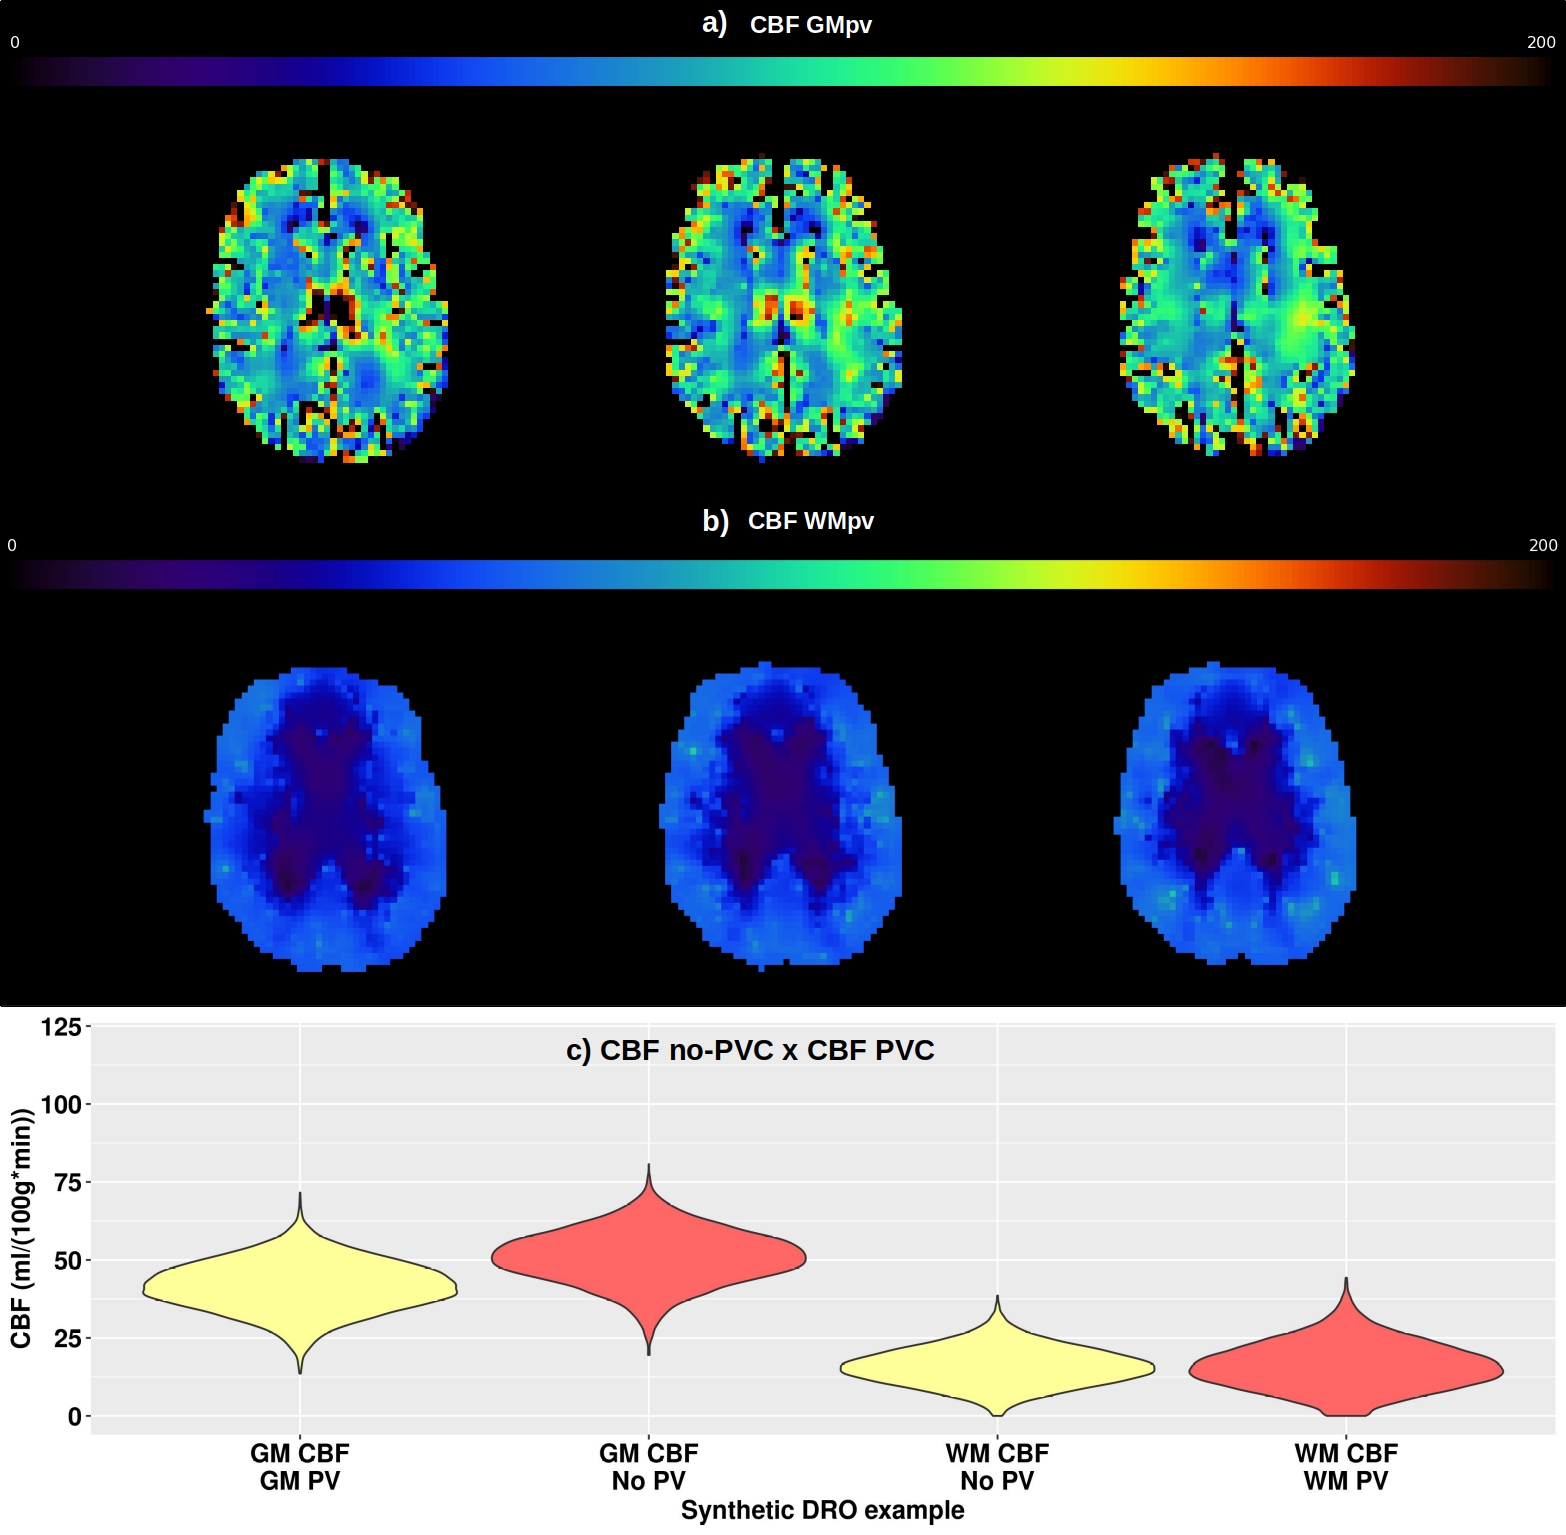
Figure 5: Example of analysis including the use of partial volume correction for one illustrative synthetic DRO dataset for one entry. a) CBF with GM partial volume correction. b) CBF with WM partial volume correction. c) Measurements comparison between CBF with and without partial volume correction. Three slices are shown in a) and b).
DOI: https://doi.org/10.58530/2022/0910