0905
The minimal processing pipeline for arterial spin labeling data from the Human Connectome Project Lifespan studies of Aging and Development1Radiological Sciences, Mental Health and Clinical Neurosciences, School of Medicine, University of Nottingham, Nottingham, United Kingdom, 2Sir Peter Mansfield Imaging Centre, School of Medicine, University of Nottingham, Nottingham, United Kingdom, 3Nottingham Biomedical Research Centre, Queen's Medical Centre, University of Nottingham, Nottingham, United Kingdom, 4Institute of Biomedical Engineering, University of Oxford, Oxford, United Kingdom, 5Wellcome Centre for Integrative Neuroimaging, FMRIB, Nuffield Department of Clinical Neurosciences, University of Oxford, Oxford, United Kingdom, 6Department of Neuroscience, Washington University School of Medicine, Washington University in St Louis, St Louis, MO, United States, 7Department of Psychiatry, Washington University School of Medicine, Washington University in St Louis, St Louis, MO, United States, 8Department of Radiology, Washington University School of Medicine, Washington University in St Louis, St Louis, MO, United States
Synopsis
The arterial spin labelling (ASL) data from the Human Connectome Project (HCP) Lifespan studies can provide a source of unusually high-resolution hemodynamic measures from >2500 individuals with ages 5-21 and 37-100+. This work presents a summary of the minimal ASL processing pipeline used to provide pre-processed calibrated perfusion and arterial arrival time measurements for the cortical surface and subcortical volumes, from these individuals. The pipeline accounts for slice-wise image intensity variations resulting from the simultaneous multi-slice acquisition used to achieve high spatial resolution. These measures and this pipeline will be made available to the global neuroscience and neuroimaging communities.
Introduction
The Human Connectome Project (HCP) Lifespan studies extend the existing HCP work to the full lifespan and, for the first time, characterize brain organization and connectivity throughout Aging (36-100+ years) [1] and Development (5-21 years) [2]. These studies aim to acquire comprehensive neuroimaging datasets from >2500 individuals. The Lifespan studies added arterial spin labelling (ASL) data as an imaging modality, and thereby include hemodynamic measures amongst the information that the HCP provides. This work presents a summary of the minimal processing pipeline developed for the HCP Lifespan ASL datasets, used to provide perfusion and arterial transit time measures to the global neuroscience and neuroradiology research communities.Methods
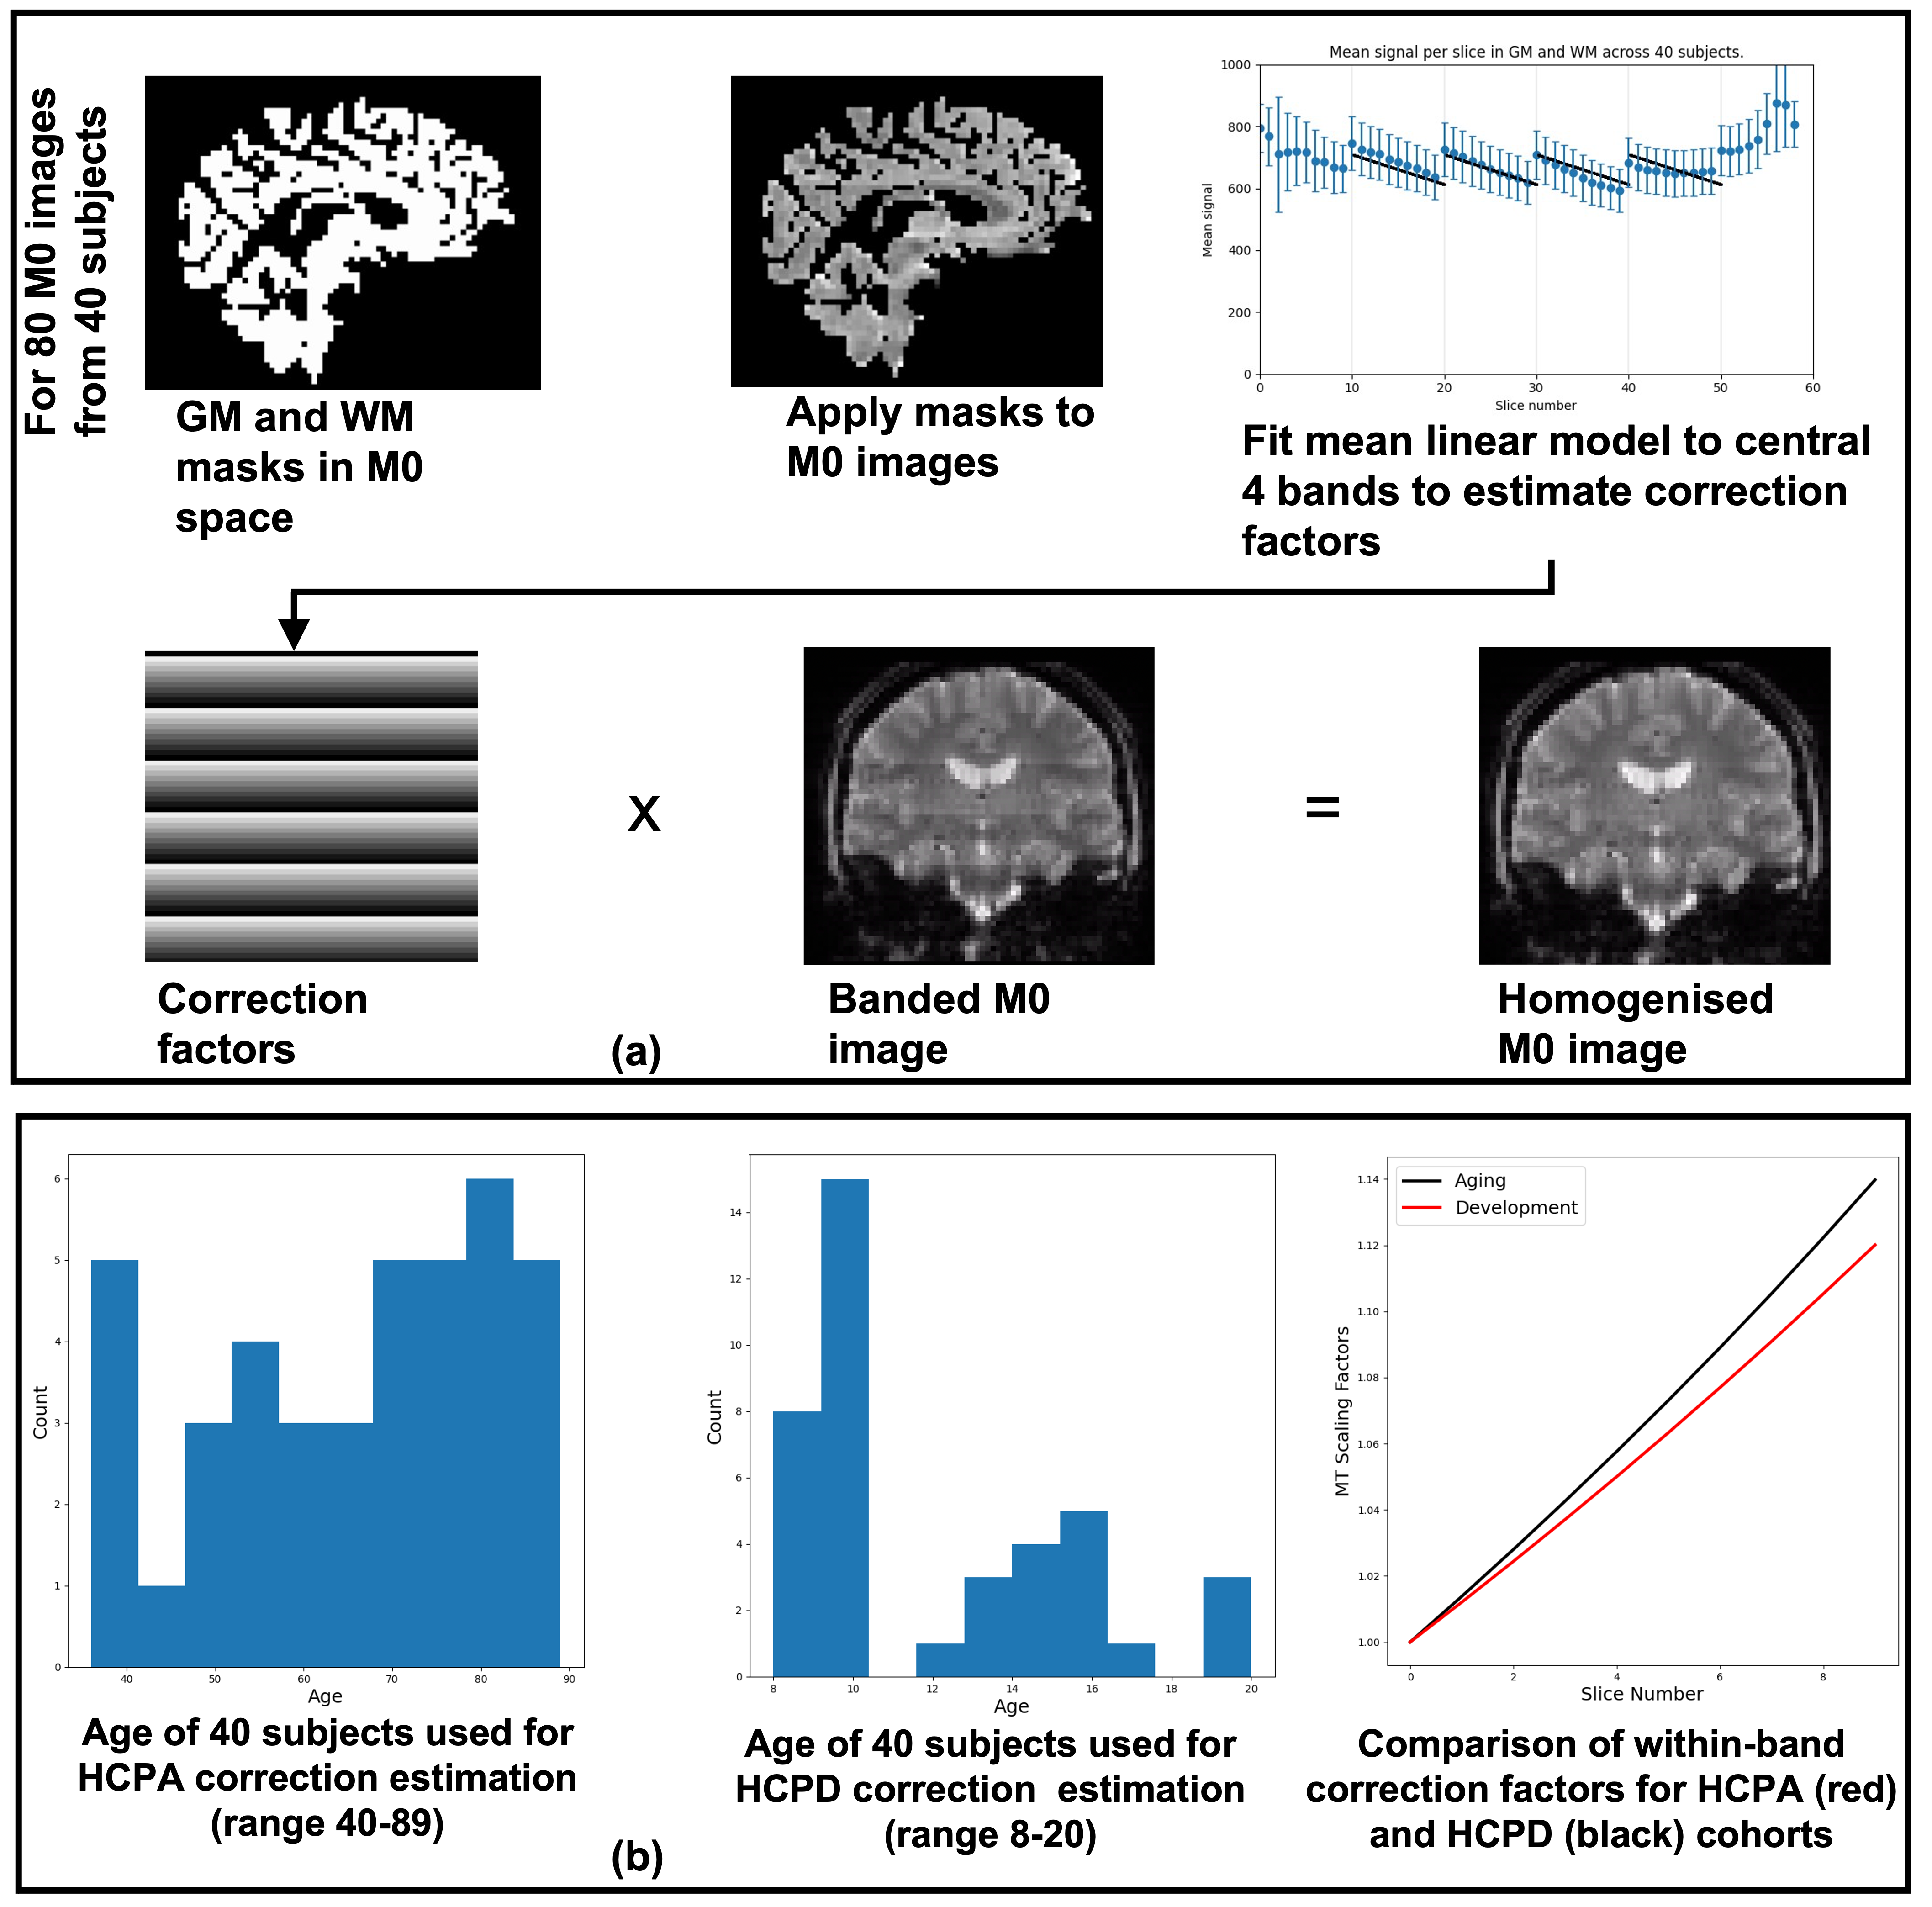
ASL data from the HCP Lifespan studies [3] was acquired in approx. 5 mins of scanning on 3T Siemens Prisma scanners at 6 locations. The ASL data were as follows: multiple post labelling delay (PLD) pseudo-continuous ASL (pcASL) data with a labelling duration of 1.5s, PLDs: 0.2, 0.7, 1.2, 1.7 and 2.2s, each PLD repeated 6, 6, 6, 10, and 15 times, respectively. A simultaneous multi-slice acquisition (SMS) with a multiband factor of 6 was used to achieve 2.5mm isotropic resolution (2.27mm slice thickness plus 10% gap), with 60 slices total. Also acquired: T1 and T2-weighted images (pre-processed via the HCP minimal processing pipelines [4]), two 2.5mm isotropic PD-weighted M0 calibration images (TR>8s), and two phase-encoding-reversed spin-echo images matched to the ASL data for susceptibility distortion correction.The label and control images (Fig. 1) were corrected for a linear intensity variation (banding) within each 10-slice band (Figures 1 & 2a), which is thought to be caused by magnetization transfer (MT) effects. To reduce the impact of this banding on motion estimation, correction factors were derived from a linear fit to the effect averaged over the M0 images from a group of 40 HCP subjects (Figure 2b). Data were also corrected for a slice-wise SMS-related saturation-recovery intensity variation (not shown here) by fitting the saturation recovery curve.
Motion parameters were iteratively estimated thrice, the first two sets of motion estimates were used to improve saturation recovery fitting, and the third was used to align the de-banded ASL data to the target image alignment space for analysis. The phase encoding-reversed spin-echo images were used to correct for non-uniform receive-coil sensitivity [5] and for susceptibility distortion correction using TOPUP [6]. In line with the philosophy of existing HCP processing pipelines, perfusion analysis was performed on ASL data after alignment with the pre-processed T1w image, while maintaining the original 2.5mm isotropic ASL voxel grid. Label-control subtraction was performed using the GLM-based method of [7] to account for variability in the original slice number of a specific point in the brain throughout the time series and, consequently, variability in the correction factor applied to tissue at that point in the brain in each volume.
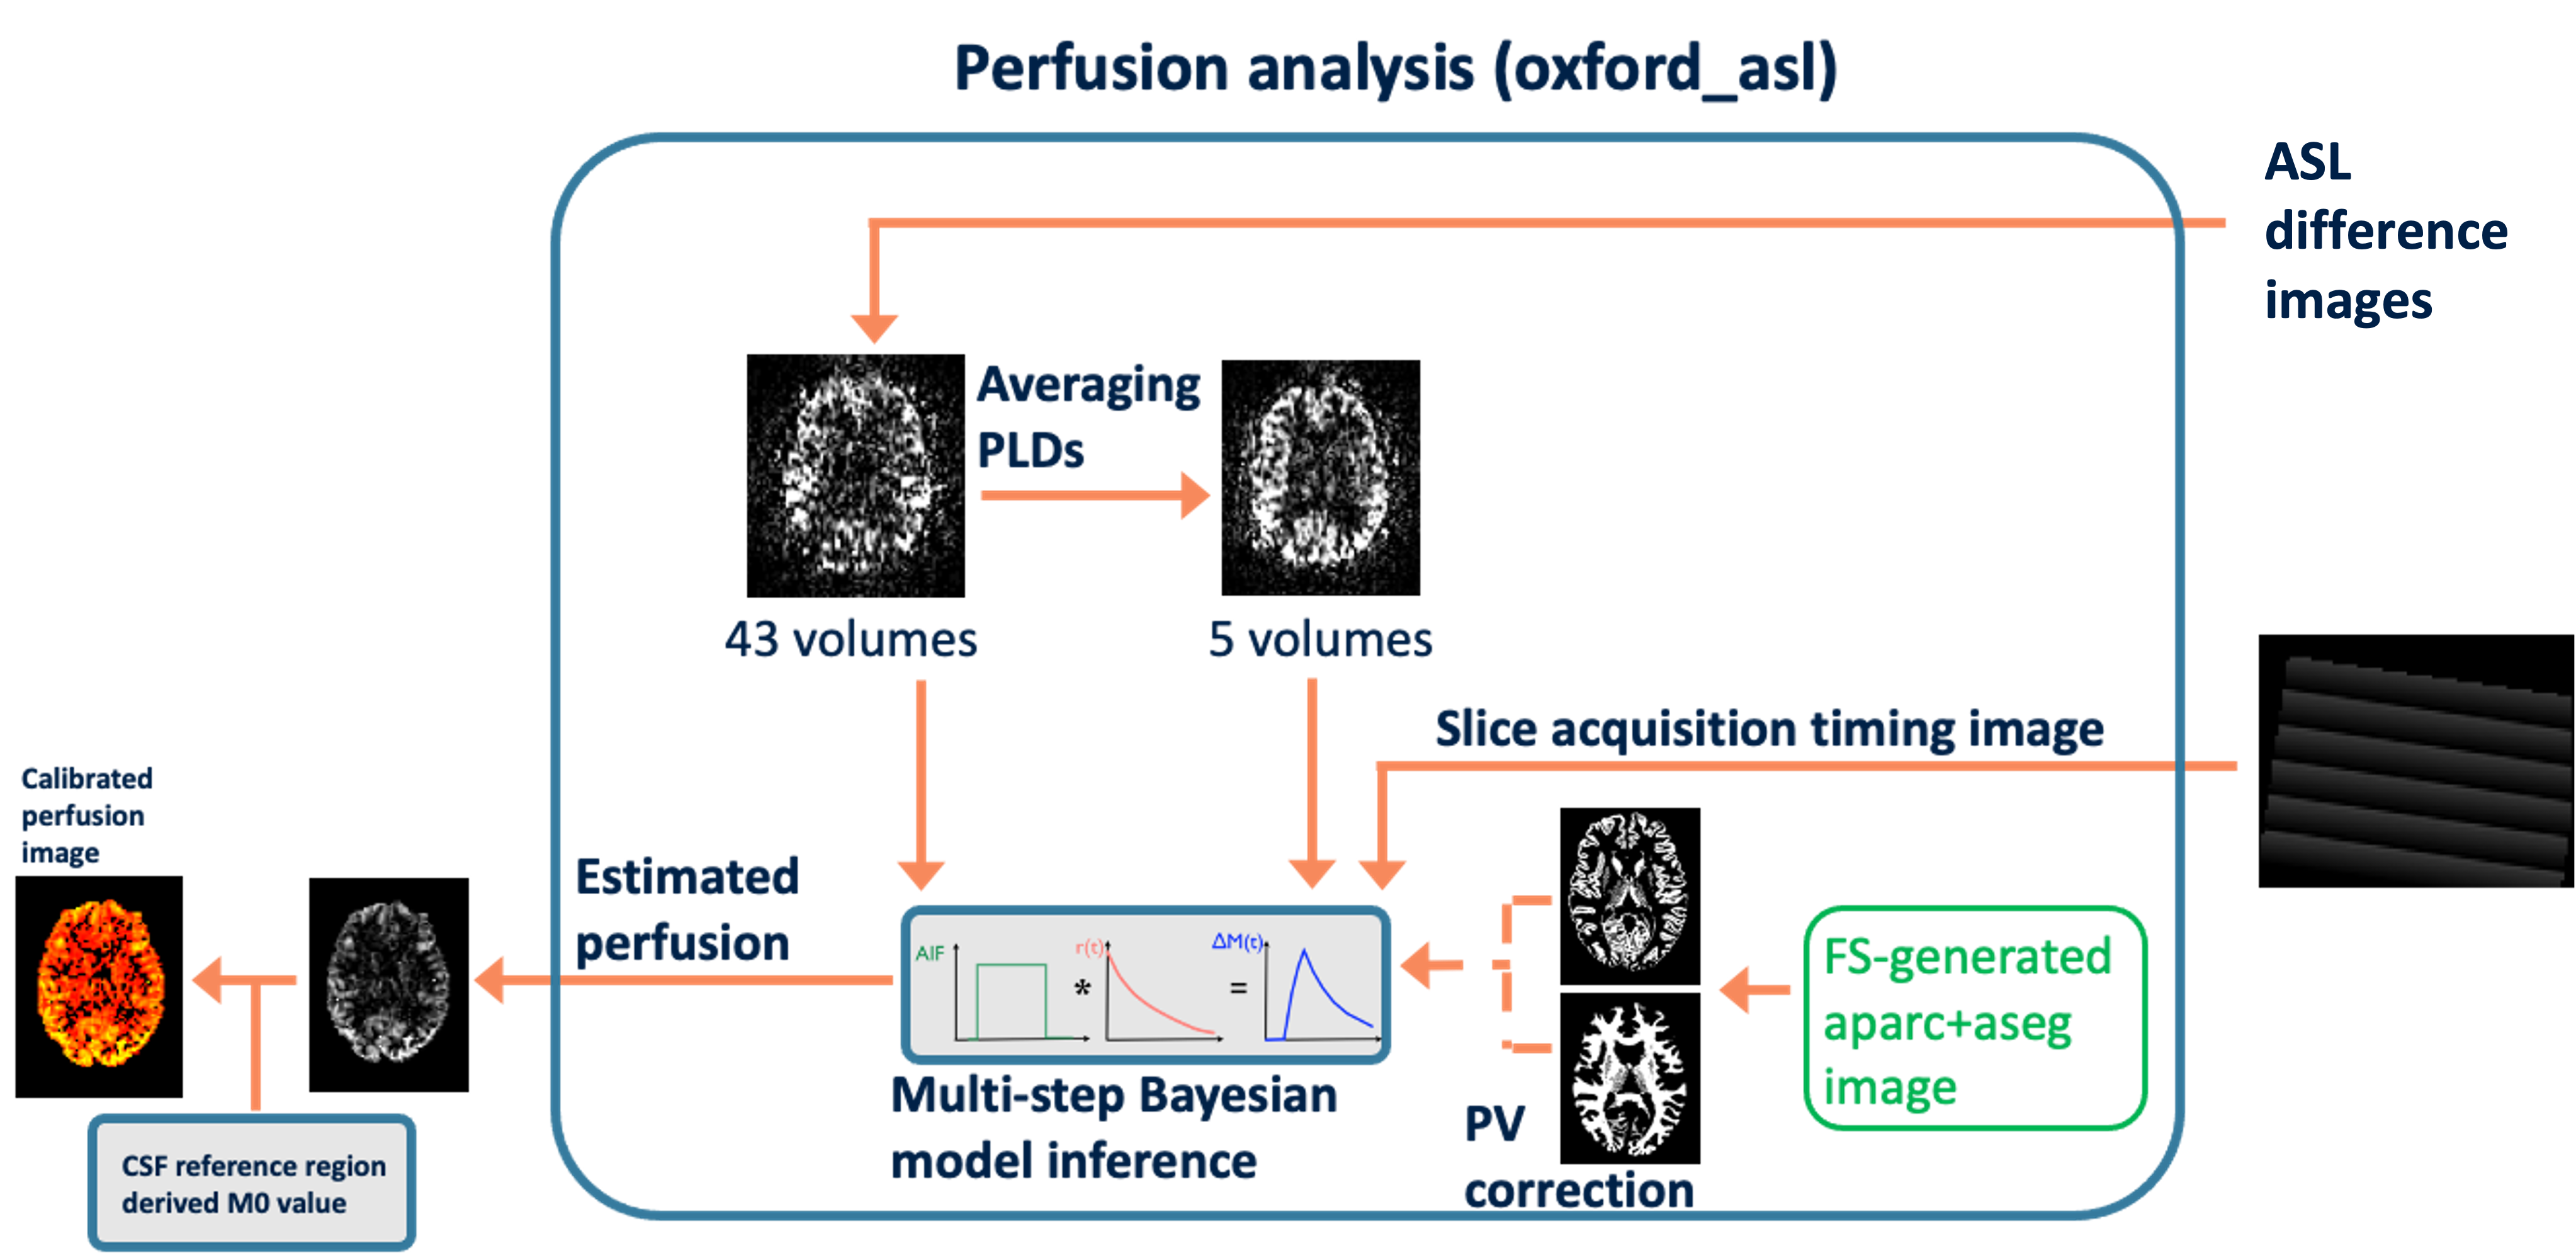
Perfusion analysis was performed using ‘oxford_asl’ from the BASIL toolbox [8] in FSL (Figure 3), with partial volume correction (PVEc) using partial volume estimates derived using Toblerone [9] on the FreeSurfer-derived cortical surface and FreeSurfer segmentations for subcortical structures [4]. Adjustment of PLDs was performed to account for slice acquisition time. The perfusion and arterial arrival time results were projected onto the individual's native cortical surface and resampled to a group template surface derived using ‘MSMAll’ [10] registration.
Results
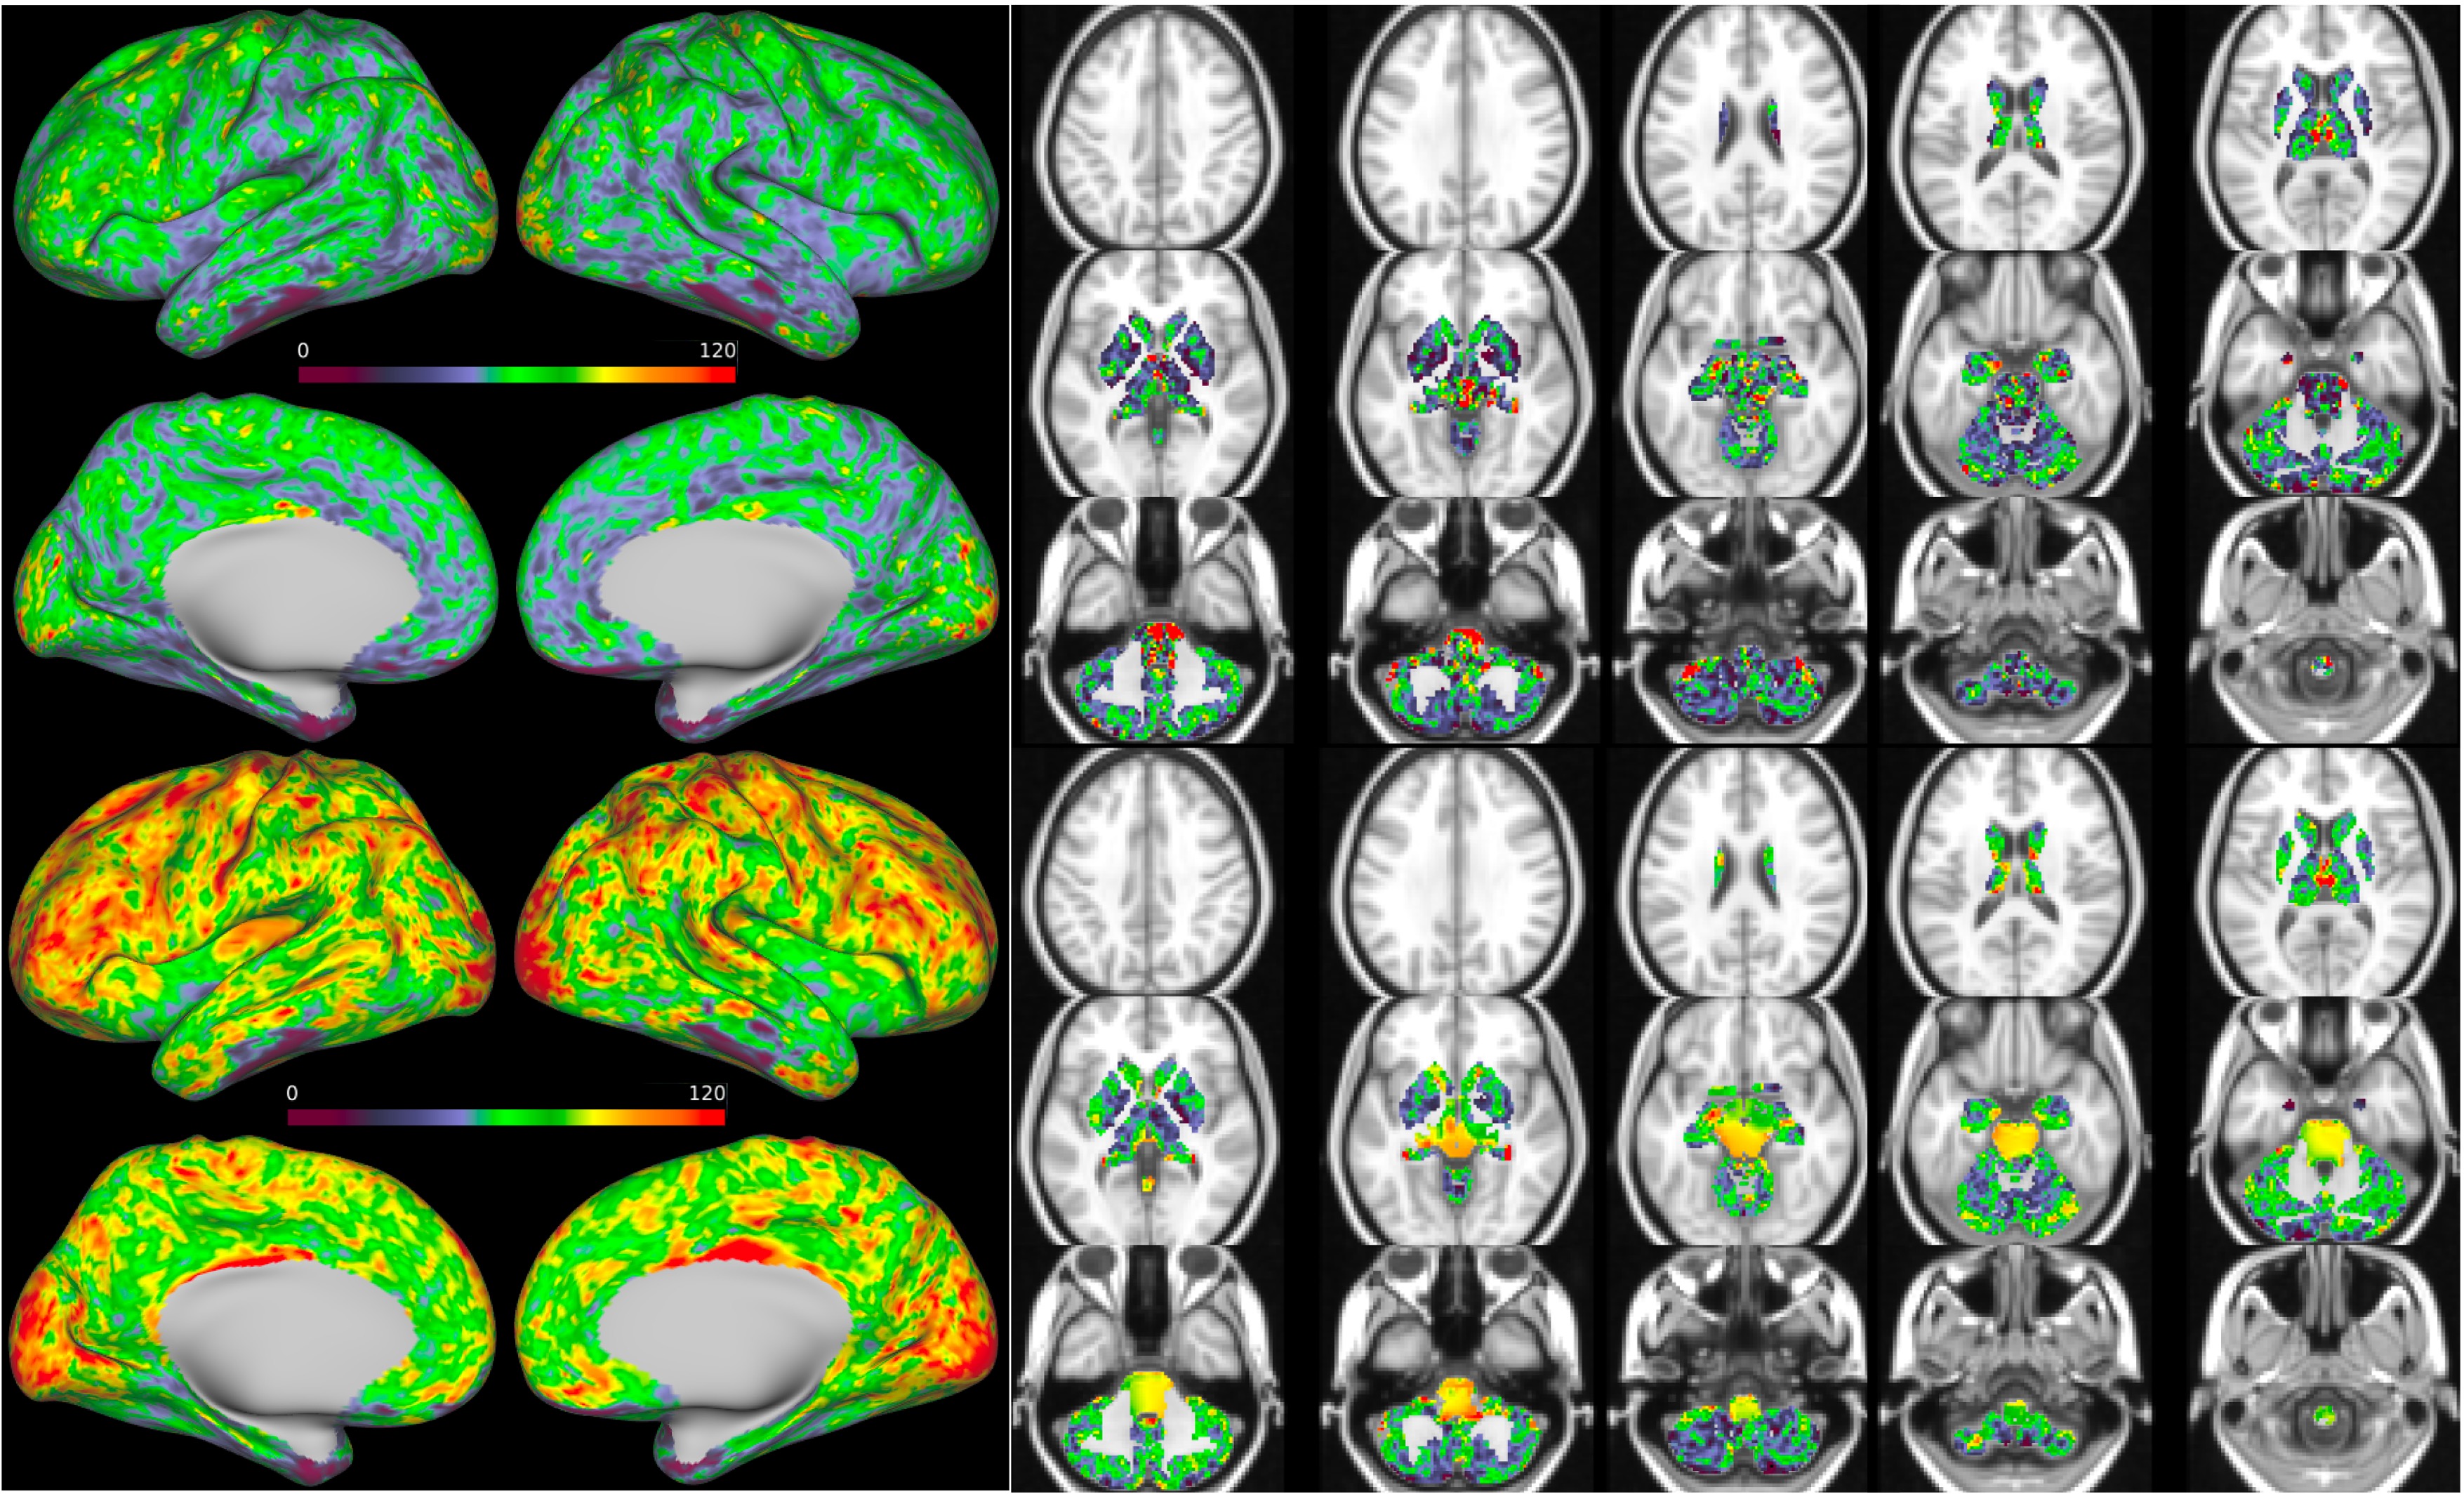
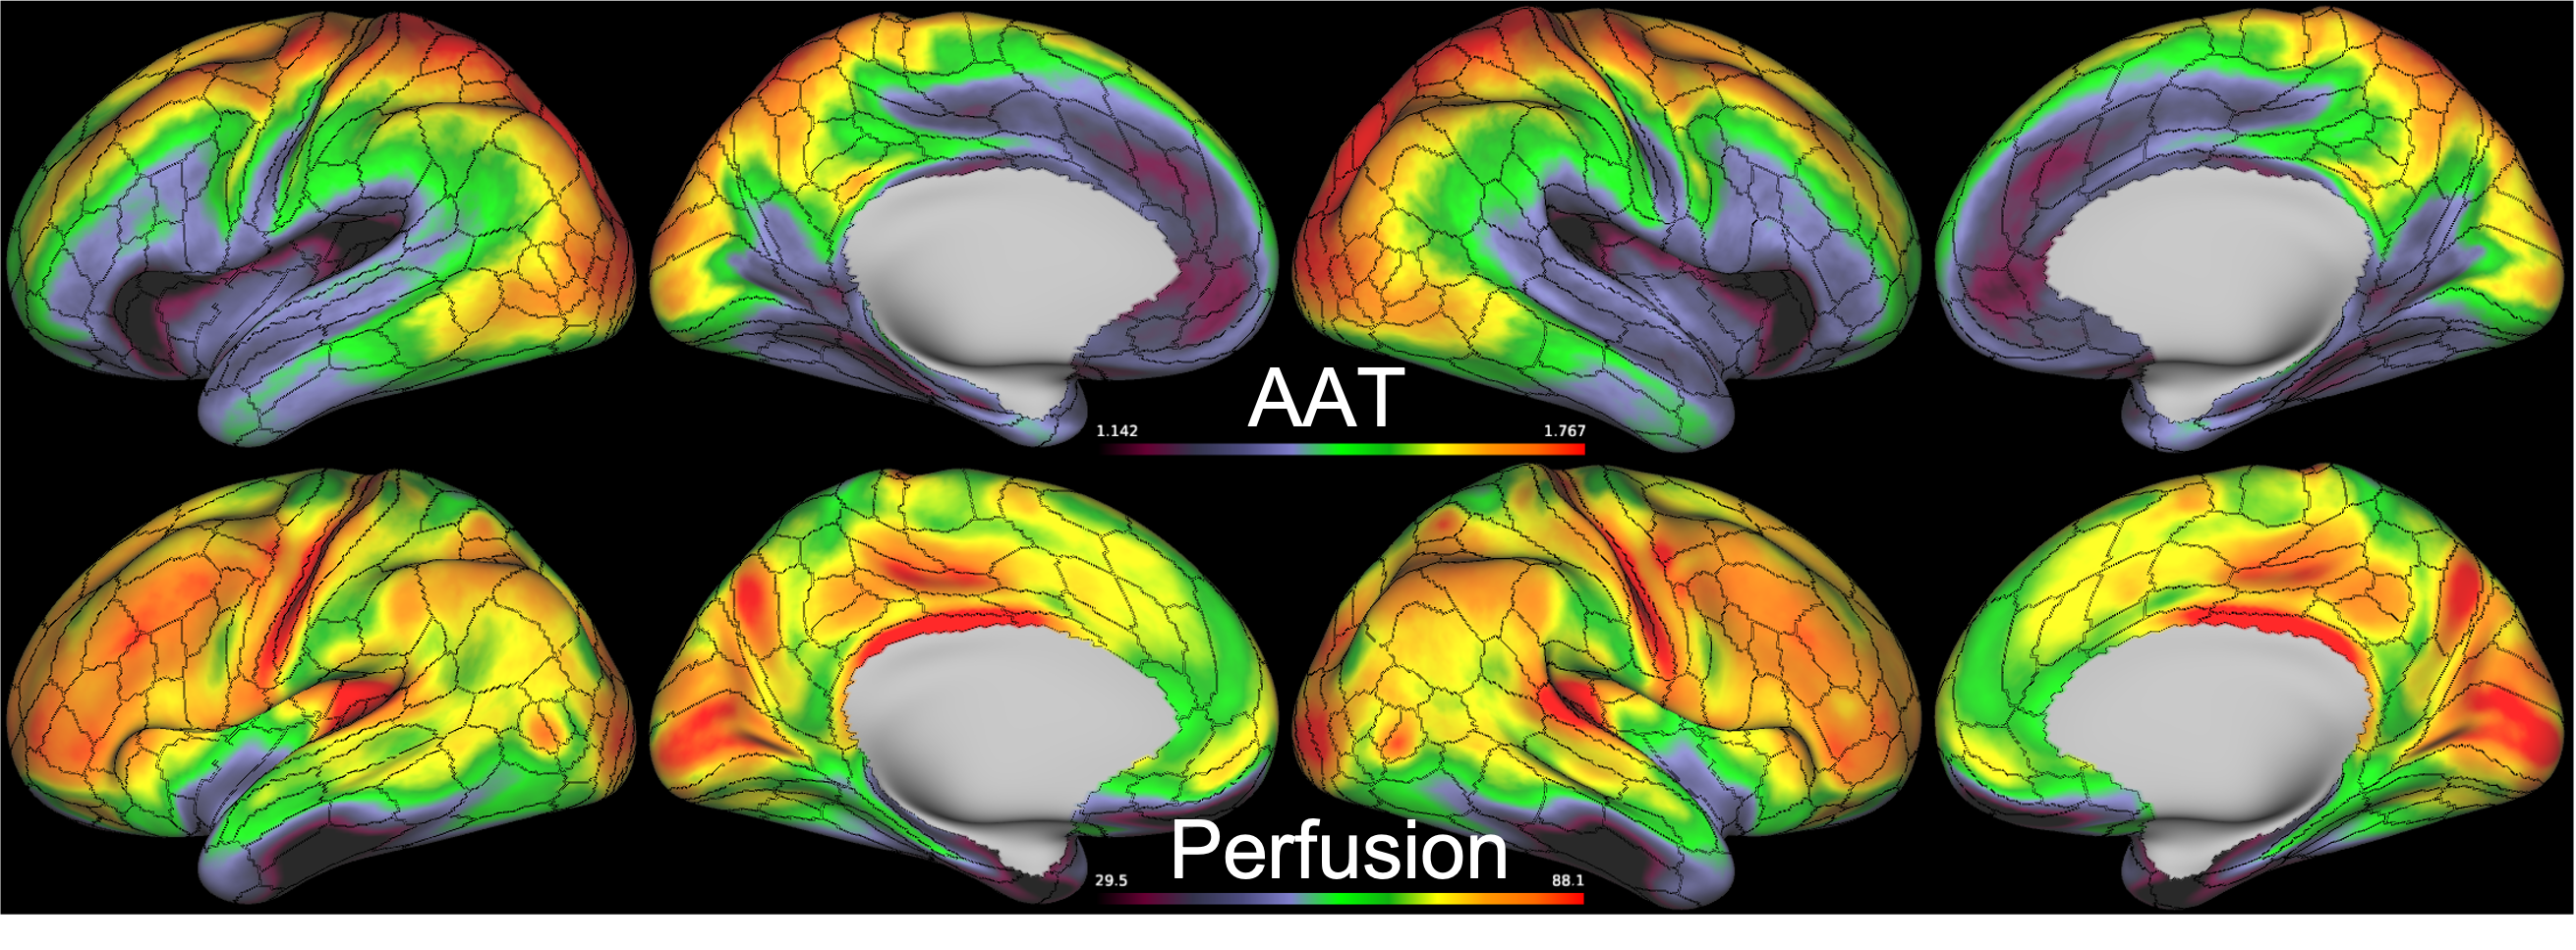
Figure 4 shows perfusion results from one HCP Aging participant. These include CIFTI representations of both non-PVEc and PVEc measures of perfusion (in ml/100g/min). The pipeline also generates associated arterial arrival time measures (in seconds) and voxelwise arterial cerebral blood volume (in % of voxel) estimates (not shown here).The ASL minimal processing pipeline has now been run on ASL data from both HCP Aging and HCP Development participants. Figure 5 shows initial mean arterial arrival time (AAT) and perfusion results from 1259 HCP Aging sessions with the HCP’s multi-modal cortical parcellation boundaries overlaid [5].
Discussion
This work has presented the minimal processing pipeline for ASL data from the HCP Lifespan Aging and Development projects. A specialized pre-processing approach was developed to homogenize slice-wise intensity variations in the static tissue images (Fig1&2) arising from the SMS acquisition, to enable effective motion correction. Correction for the intensity variation shown in Figure 2, was based on inverting the effect seen in the data from a group of 40 individuals from each of the Aging and Development cohorts. The magnitude of the intensity variation differed slightly between the two populations, potentially because of differences in grey matter and white matter volumes. A personalized correction technique to remove the need for a representative population would be desirable and would allow the pipeline to translate to new datasets with ease. Perfusion results from a population of Aging individuals suggest perfusion relationships with cortical areas (Figure 5), with particularly high perfusion to early sensory areas (visual, somatosensory, and auditory), area POS2 and retrosplenial cortex, and many association areas. Mean arrival time correlates with vascular territories, being highest in core vascular territories and lower in watershed regions.Conclusions
The pre-processed data from the HCP ASL minimal processing pipeline [10] will soon be released to the global neuroimaging and neuroscience communities in the next Lifespan HCP data release.Acknowledgements
JT and MAC have received support from the Engineering and Physical Sciences Research Council UK (EP/P012361/1). FKM and MC are supported by the Beacon of Excellence in Precision Imaging, University of Nottingham. YS is supported by the Royal Academy of Engineering under the Research Fellowship scheme (RF/201920/19/236) and core funding from the Wellcome Trust (203139/Z/16/Z). MPH is supported by grants: U01MH109589 and U01AG052564. MFG receives support from grants: R24MH108315 and R24MH122820References
[1] Bookheimer S. Y., et al. “The Lifespan Human Connectome Project in Aging: An overview.” Neuroimage. 2019 Jan 15; 185:335-348.
[2] Somerville L. H., et al. “The Lifespan Human Connectome Project in Development: A large-scale study of brain connectivity development in 5-21 year olds”. Neuroimage. 2018 Dec; 183:456-468.
[3] Harms, M. P., et al. "Extending the Human Connectome Project across ages: Imaging protocols for the Lifespan Development and Aging projects." Neuroimage 183 (2018): 972-984.
[4] Glasser, M. F., et al. "The minimal preprocessing pipelines for the Human Connectome Project." Neuroimage 80 (2013): 105-124.
[5] Glasser, M. F. et al. “A multi-modal parcellation of human cerebral cortex.” Nature vol. 536,7615: 171-178, 2016
[6] J.L.R. Andersson, et al., “How to correct susceptibility distortions in spin-echo echo-planar images: application to diffusion tensor imaging.” NeuroImage, 20(2):870-888, 2003.
[7] Suzuki, Yuriko, et al. "A framework for motion correction of background suppressed arterial spin labeling perfusion images acquired with simultaneous multi‐slice EPI." Magnetic resonance in medicine 81.3 (2019): 1553-1565.
[8] Chappell, M. A., et al., “Variational Bayesian inference for a non-linear forward model.” IEEE Transactions on Signal Processing 57(1):223-236, 2009.
[9] Kirk, Thomas F., et al. "Toblerone: surface-based partial volume estimation." IEEE transactions on medical imaging 39.5 (2019): 1501-1510.
[10] Robinson EC, et al., “Multimodal surface matching with higher-order smoothness constraints.” Neuroimage. 2018 Feb 15;167:453-465.
[11] https://github.com/physimals/hcp-asl
Figures