0904
Multi-delay ASL perfusion imaging: impact of modeling dispersion and interaction with denoising strategies1Department of Bioengineering, ISR-Lisboa/LARSyS and Department of Bioengineering, Instituto Superior Técnico – Universidade de Lisboa, Lisbon, Portugal, 2Institute of Biomedical Engineering, Department of Engineering Science, University of Oxford, Oxford, United Kingdom, 3Sir Peter Mansfield Imaging Centre, School of Medicine, University of Nottingham, Nothingam, United Kingdom, 4Neurology Department, Hospital Egas Moniz, Centro Hospitalar de Lisboa Ocidental; CEDOC - Nova Medical School, New University of Lisbon, Lisbon, Portugal, 5Imaging Department, Hospital da Luz, Lisbon, Portugal
Synopsis
Arterial spin labeling (ASL) acquisitions at multiple post-labeling delays allow for appropriate kinetic models to be fitted to the data, potentially providing more accurate perfusion quantification. We investigated the influence of denoising strategies based on repetition averaging and ICA, together with the choice of an extended kinetic model with or without dispersion, on multi-delay ASL measurements from a group of small vessel disease patients and their age-matched controls. While ICA denoising generally improved model fitting, repetition averaging interacted with modeling dispersion and subject group, significantly impacting the estimation of perfusion and macrovascular contributions, mostly in arterial locations and with pathology.
Introduction
Arterial spin labeling (ASL) has great clinical potential for noninvasive perfusion imaging, and single post-labeling delay acquisitions can be used to quickly obtain cerebral blood flow (CBF) images under assumptions regarding the arterial blood supply1. Sampling at multiple delays allows for a kinetic model to be fitted to the ASL signal, potentially providing more accurate CBF estimates together with the arterial transit time (ATT)2. An appropriate kinetic model must be selected and the data should have sufficient SNR to allow good model fitting. Extended kinetic models accounting for macrovascular contributions should be used for data acquired without macroflow suppression, additionally providing estimates of the arterial cerebral blood volume (aCVB)3. Although the standard kinetic model assumes no dispersion of the labelled bolus, the combined effects of the flow profile in the feeding arteries and the different arrival times from different paths have been shown to significantly impact ASL signals4. Regarding denoising, a common approach consists in averaging multiple repetitions of control-label difference images to improve SNR. Recently, independent component analysis (ICA) has been proposed to separate the ASL signal of interest from structured noise sources5. Here, we investigate the influence of these denoising strategies together with modeling dispersion in multi-delay ASL.Methods
Multi-delay pulsed ASL data were acquired from 17 small vessel disease patients (SVD, 50±9yrs) and 12 age-matched controls (CTRL, 52±8yrs) on a 3T Siemens scanner using PICORE-Q2TIPS6 with 2D-multi-slice GE-EPI (TR/TE=2500/11ms; 11 TI2=400-2400ms, step=200ms, 8 repetitions). Data analysis was performed using FSL (fsl.fmrib.ox.ac.uk) and MATLAB (2020a, http://mathworks.com). Motion correction was performed and control-label difference image time series were computed. These were subjected to ICA and noise-related Independent Components (ICs) were identified. Three ICA denoising strategies were employed: i) no ICA; ii) conservative ICA (ICAc): removal of ICs related to motion, susceptibility and multiband artifacts; and aggressive ICA (ICAa): removal of all ICs not consistent with the expected ASL signal. Two repetition averaging options were then considered: i) averaging the 8 repetitions for each TI2 (11-volumes); and ii) no averaging (8x11=88-volumes). Two extended kinetic models were considered: with dispersion (disp) and without dispersion (no disp)4. For each denoising strategy and model, the model was fitted to the data using BASIL7 and CBF, ATT and aCBV maps were obtained using voxelwise calibration8. Maps of parameter estimation variance and model free energy (FE) were also obtained. The mean values of the parameters were computed across gray matter (GM) and arterial (aCBV) ROIs. For each ROI, 3-way repeated measures ANOVA was used to assess the effects of within-subjects factors ICA, Averaging and Dispersion, and between-subjects factor Group. For significant interactions, post-hoc pairwise t-tests were performed. Voxelwise comparisons between CBF, ATT and aCBV maps were performed by permutation testing.Results
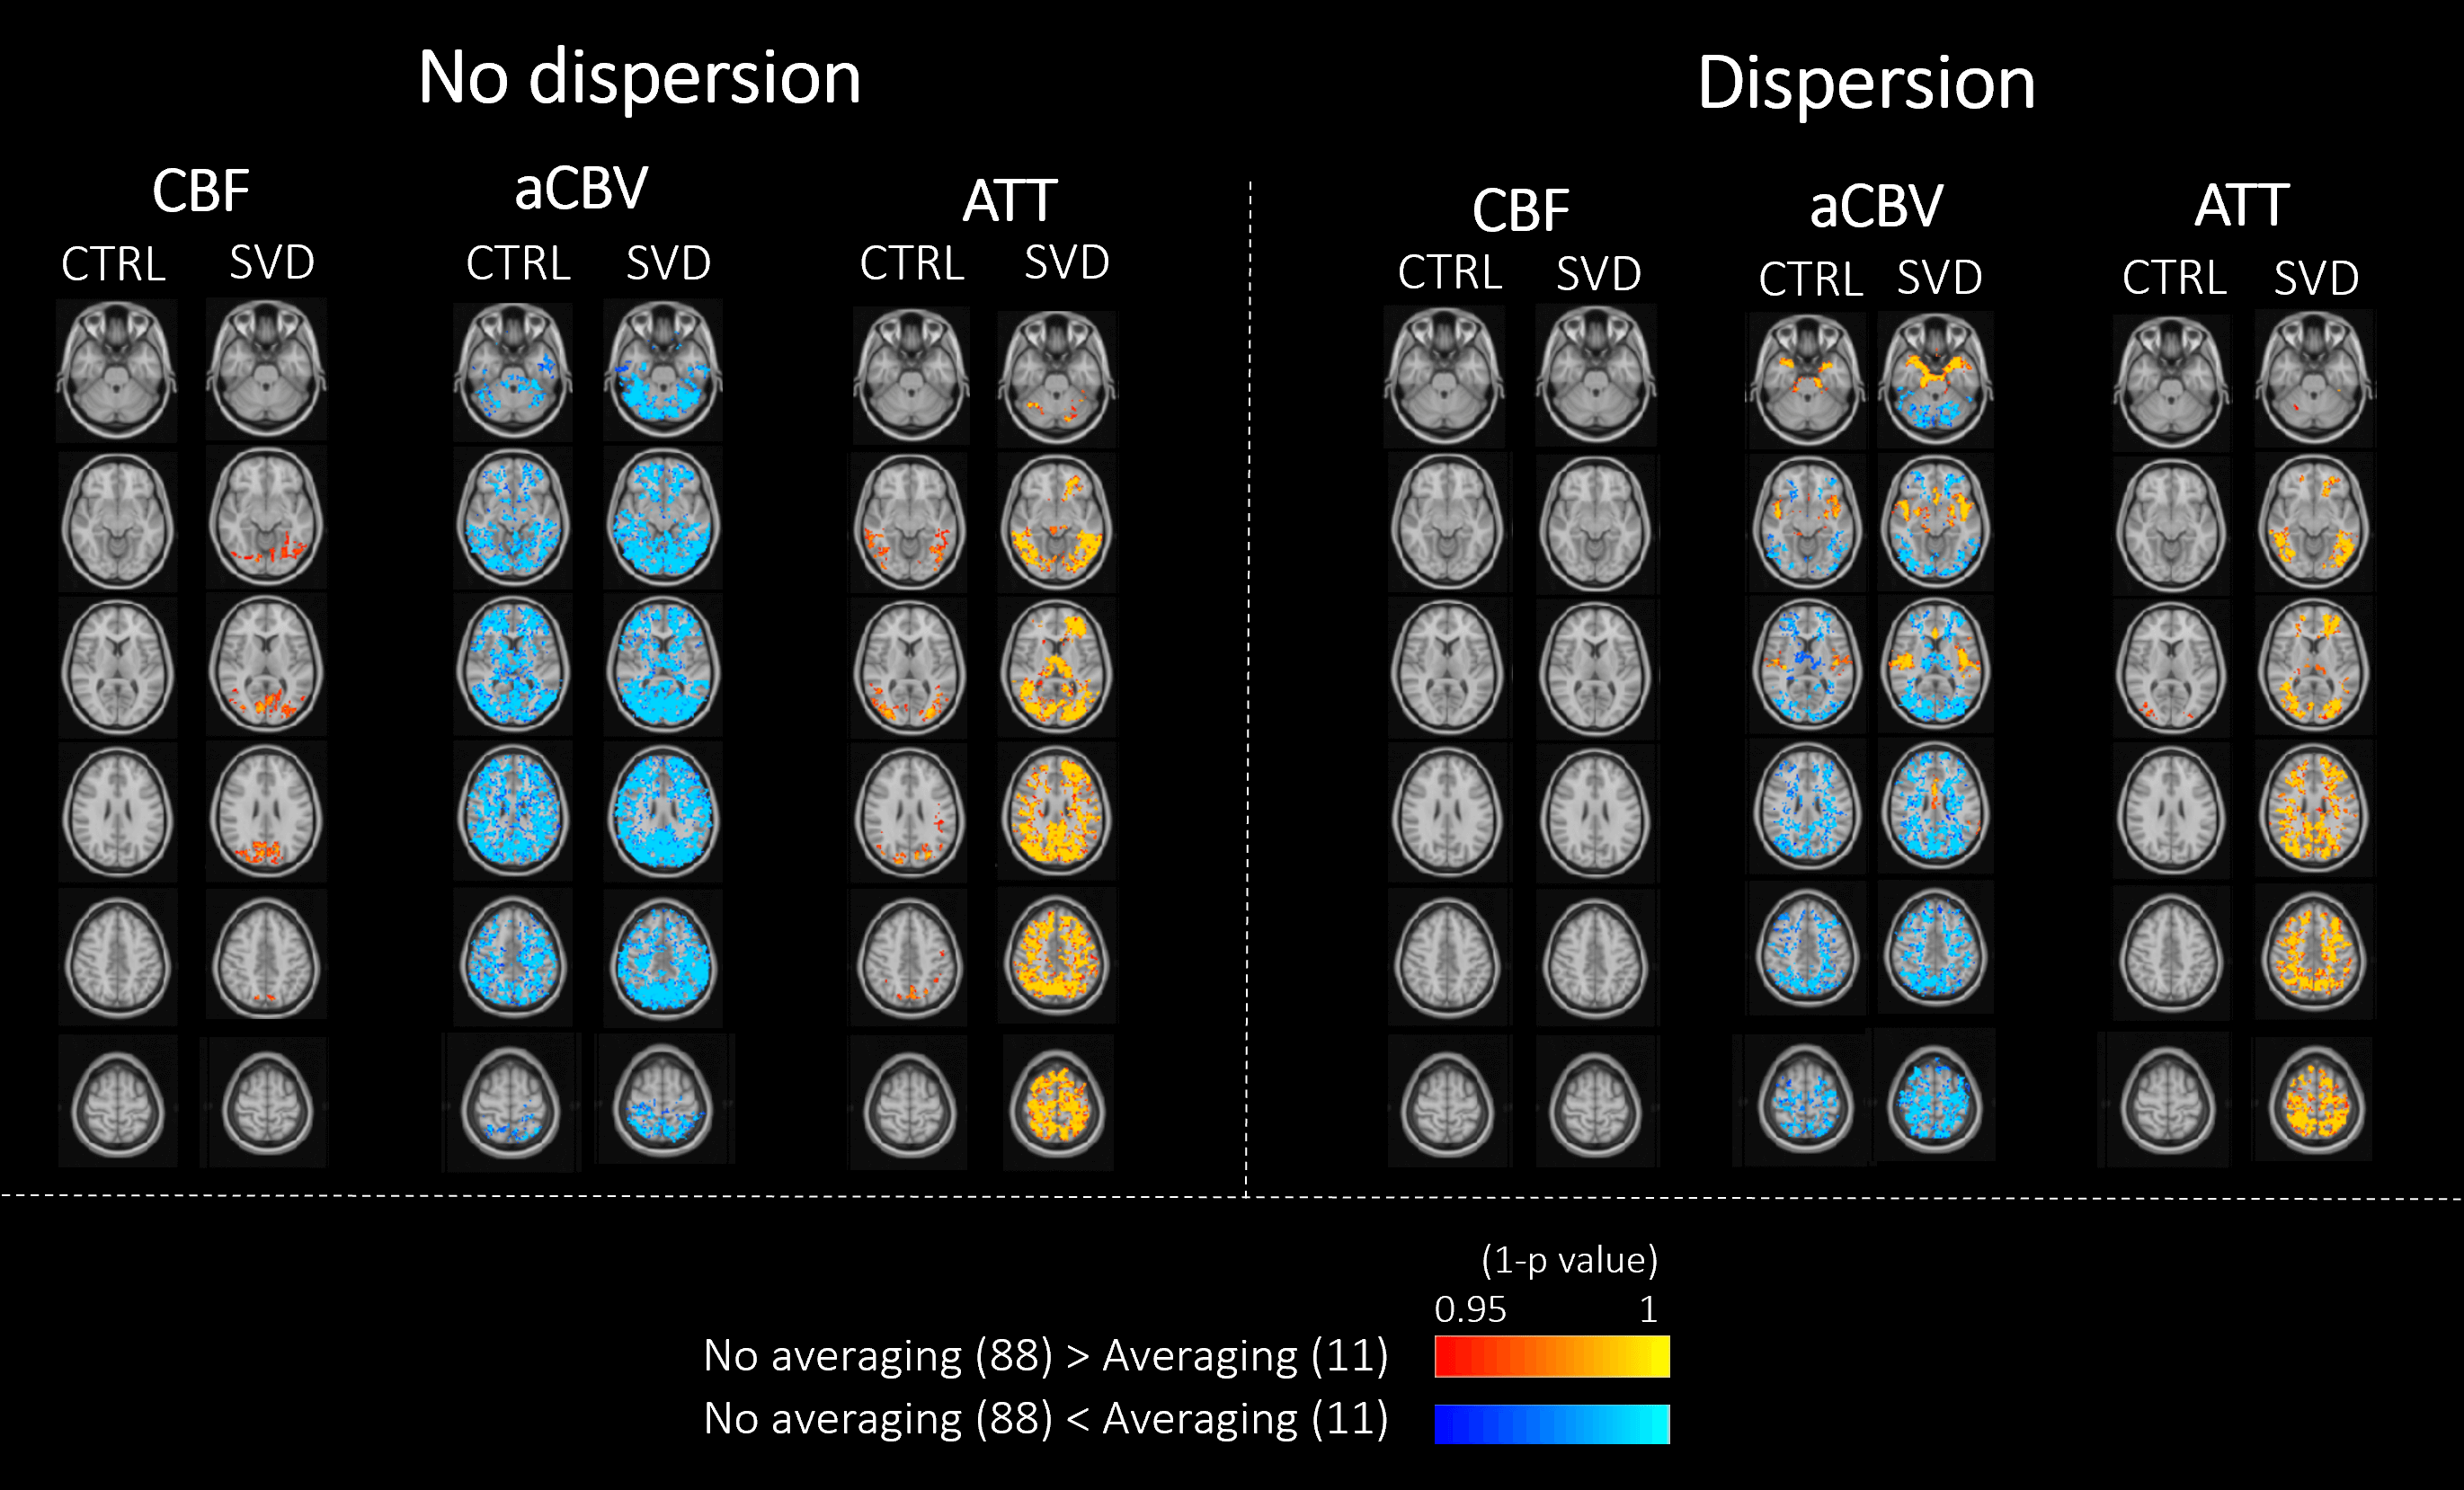
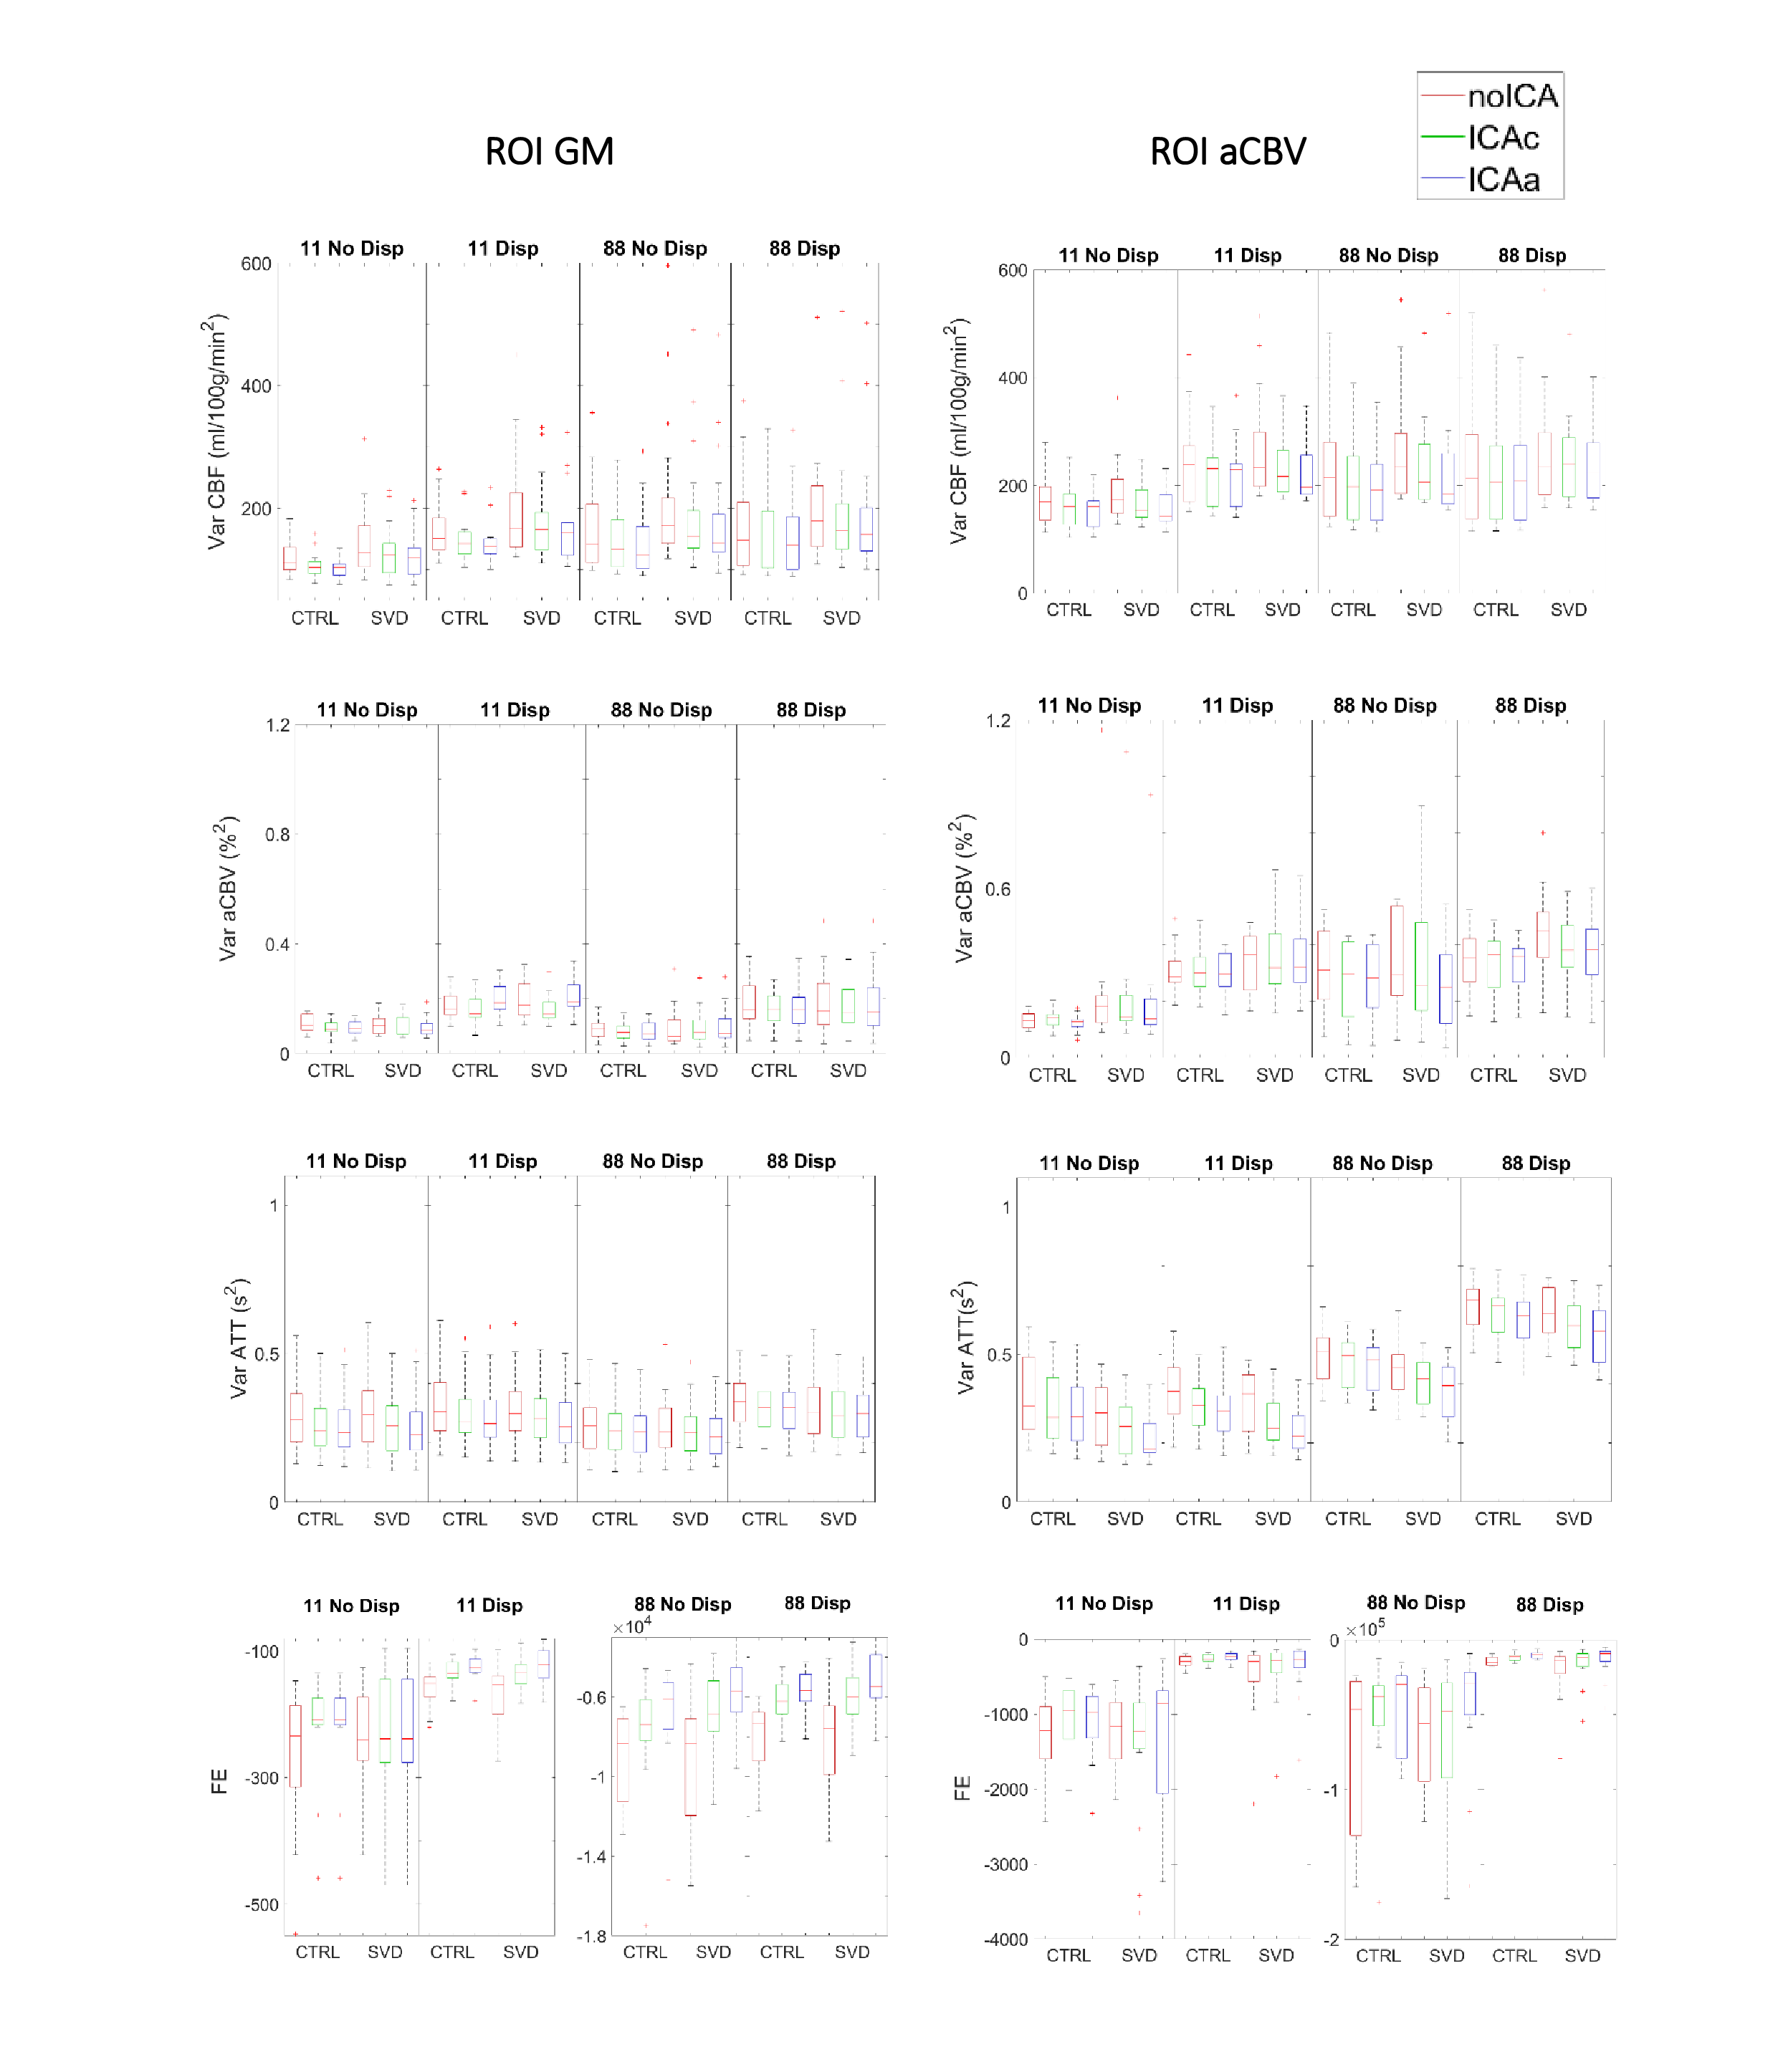
The ROI analysis of the parameter estimates is presented in Fig.1. We found statistically significant effects of Averaging and Dispersion, as well as interactions between them, on CBF and aCBV in the arterial ROI, which were also present for aCBV across GM. In the arterial region, modeling dispersion decreased CBF, but only without averaging; this may be explained by the fact that averaging yielded lower aCBV estimates in this region, probably indicating that it compromised relevant information at the early time points for the estimation of macrovascular contributions. Paradoxically, averaging yielded higher aCBV across GM regardless of modeling dispersion, again indicating that aCBV could not be correctly estimated in this case. Significant interactions were also found between these factors and Group in the arterial ROI: CBF was greater in patients than controls but only when averaging. We present voxelwise analyses of Dispersion and Averaging effects separated by factor/group (no ICA) to further investigate their spatial pattern, in Figures 2-3. Modeling dispersion yielded greater aCBV in regions consistent with arterial locations, but only when not averaging (Fig.2). In fact, averaging produced spuriously higher aCBV throughout the brain, while not averaging kept higher aCBV specifically in the expected arterial regions when modeling dispersion (Fig.3). The ROI analysis of the parameter estimate variances and model FE is presented in Fig.4. We found significant reductions in variance with ICA denoising, indicating more precise parameter estimates. Consistently, FE increased with ICA denoising, evidencing a better model fit. This was also found when not averaging and for models including dispersion, in the aCBV ROI.Discussion
We found that repetition averaging interacted with modeling dispersion and significantly impacted the estimation of perfusion (CBF) and macrovascular (aCBV) contributions, mostly in arterial locations. Moreover, keeping the repetitions without averaging increased the model’s free energy, as did ICA denoising and dispersion modeling. These results indicate that including all control-label repetitions rather than averaging provides better noise estimation and hence better model fitting, with special impact on earlier (noisier) time points and hence the estimation of arterial (macrovascular) contributions. Interestingly, averaging and dispersion also interacted with the group, such that apparently greater CBF was found in arterial regions of patients but only when averaging and not accounting for dispersion. These findings highlight the importance of modeling dispersion with appropriate noise estimation in pathology.Acknowledgements
We acknowledge the Portuguese Foundation for Science and Technology (FCT) for financial support through Grants PTDC/BBB-IMG/2137/2012 and UIDB/50009/2020.References
1. D. C. Alsop et al., “Recommended Implementation of ASL Perfusion MRI for Clinical Applications,” Magn. Reson. Med., vol. 73, no. 1, pp. 102–116, 2015
2. P. M. Figueiredo, S. Clare, and P. Jezzard, “Quantitative perfusion measurements using pulsed arterial spin labeling: Effects of large region-of-interest analysis,” J. Magn. Reson. Imaging, vol. 21, no. 6, pp. 676–682, 2005.
3. M. A. Chappell, B. J. MacIntosh, M. J. Donahue, M. Günther, P. Jezzard, and M. W. Woolrich, “Separation of macrovascular signal in multi-inversion time arterial spin labelling MRI,” Magn. Reson. Med., vol. 63, no. 5, pp. 1357–1365, 2010.
4. M. A. Chappell, M. W. Woolrich, S. Kazan, P. Jezzard, S. J. Payne, and B. J. MacIntosh, “Modeling dispersion in arterial spin labeling: Validation using dynamic angiographic measurements,” Magn. Reson. Med., vol. 69, no. 2, pp. 563–570, 2013
5. D. Carone et al., “ICA-based denoising for ASL perfusion imaging,” Neuroimage, vol. 200, no. April, pp. 363–372, 2019.
6. W. M. Luh, E. C. Wong, P. A. Bandettini, and J. S. Hyde, “QUIPSS II with thin-slice TI1 periodic saturation: A method for improving accuracy of quantitative perfusion imaging using pulsed arterial spin labeling,” Magn. Reson. Med., vol. 41, no. 6, pp. 1246–1254, 1999.
7. M. A. Chappell, A. R. Groves, B. Whitcher, and M. W. Woolrich, “Variational Bayesian inference for a nonlinear forward model,” IEEE Trans. Signal Process., vol. 57, no. 1, pp. 223–236, 2009.
8. J. Pinto et al., “Calibration of arterial spin labeling data—potential pitfalls in post-processing,” Magn. Reson. Med., vol. 83, no. 4, pp. 1222–1234, 2020.
Figures