0902
Automated 4D flow-based blood vortex detection for estimation of mean pulmonary arterial pressure1Department of Radiology, Medical University of Graz, Graz, Austria, 2Institute of Medical Engineering, Graz University of Technology, Graz, Austria, 3Department of Internal Medicine, Medical University of Graz, Graz, Austria, 4Ludwig Boltzmann Institute for Lung Vascular Research Graz, Graz, Austria, 5Institute of Computer Graphics and Vision, Graz University of Technology, Graz, Austria, 6Research and Development, Siemens Healthcare Diagnostics GmbH, Graz, Austria
Synopsis
Pulmonary hypertension is characterized by elevated mean pulmonary arterial pressure. Visual vortex analysis revealed a strong relation between elevated mean pulmonary arterial pressure and the duration of vortical blood flow along the pulmonary artery, however, automated pulmonary hypertension-related vortex detection methods are lacking. We propose a method for automated detection and tracking of the pulmonary hypertension-related vortex from 4D flow data and aim to compare it with visual analysis and to validate automatically estimated mean pulmonary arterial pressure against invasively measured results. The automated method agreed very well with visual vortex detection and accurately estimated elevated mean pulmonary arterial pressure.
Introduction
Pulmonary hypertension (PH) is a life-threatening condition that is diagnosed invasively by measurement of mean pulmonary arterial pressure (mPAP) using right heart catheterization (RHC). There is a piecewise linear model relating mPAP and the duration of vortical blood flow along the main pulmonary artery1 as visualized by time-resolved three-directional cardiovascular magnetic resonance phase-contrast imaging (4D flow). While this model allows for accurate and precise estimation of mPAP and therefore non-invasive diagnosis of PH1, studies applying it performed PH-related vortex detection only visually.2,3 We propose an automated method for detection and tracking of the PH-related vortex from 4D flow data and aim to compare it with visual vortex detection and to validate automatically estimated mPAP against RHC-derived results.Methods
32 subjects with known or suspected PH and regular heart rhythm (male/female 7/25; age 62±15 years) underwent RHC and 4D flow imaging at 3T (Magnetom Trio or Magnetom Skyra, Siemens Healthcare, Erlangen, Germany). A stack of slices covering the main pulmonary artery and the proximal parts of the side branches was acquired using a two-dimensional retrospectively-ECG-gated phase-contrast sequence with three-directional velocity encoding (temporal resolution 42-47 ms interpolated to 25-30 cardiac frames, repetition time 5.2-5.9 ms, echo time 3.1 ms, flip angle 12-15°, voxel size 1.8x2.5x4.0 mm3, velocity encoding 90 cm/s, two-fold averaging). Prototype software (4DFlow, Siemens Healthcare, Erlangen, Germany) was used for pre-processing of velocity fields (phase offset error correction, pulmonary artery segmentation) and visual PH-related vortex detection (Figure 1). Automated PH-related vortex detection and tracking was performed using in-house software implemented in Matlab (MathWorks Inc., Natick, MA) in three steps (Figure 2). First, streamlines were seeded on the divergence-free vector field4 in each voxel of the pulmonary artery in forward and backward directions and selected if they exhibited vortex-like characteristics. Second, streamline groups were detected in systolic frames to identify the PH-related vortex when it is fully developed (start vortex) using streamline position and angulation criteria. Third, the PH-related vortex was tracked forward and backward in the cine series by applying a streamline angulation-based iterative procedure in each frame, targeting continuous vortex volume evolution over time. PH-related vortex duration (tvortex) was calculated for visual and automated analysis as the number of frames with a vortex relative to all frames of the cardiac interval (in %). Vortex onset and dissolution times were determined from the first and last frame with a PH-related vortex. Elevated mPAP was estimated from tvortex according to the piecewise linear model by Reiter et al.1 Visually and automatically detected PH-related vortices in each frame were compared by kappa statistics; tvortex and onset and dissolution times were compared by the paired t-test in case of normality of differences, otherwise by the Wilcoxon test. The relationships between tvortex determined by visual and automated analysis as well as between automatically estimated mPAP and mPAP measured by RHC were assessed using Pearson correlation and Bland-Altman analysis. P<0.05 was considered as significant.Results
PH was diagnosed by RHC in 19 subjects. Visual analysis identified PH-related vortices in all PH subjects and none of the non-PH subjects; the proposed automated method detected PH-related vortices in all PH subjects and one non-PH subject. Figure 3 shows an example of PH-related vortex evolution from one PH subject. Agreement between visually and automatically detected PH-related vortices in each frame was very good (kappa = 0.87 [0.83, 0.90], Table 1). PH-related vortex duration determined by visual and automated analysis did not differ significantly (tvortex,vis = 25.7±27.1 %, tvortex,auto = 25.7±25.8 %, P=0.85) and correlated strongly (r = 0.98). Moreover, there was no significant bias in the respective vortex onset or dissolution times (biasonset = -1.9±4.9 %, P=0.11; biasdissol = -1.4±6.3 %, P=0.17). For all PH subjects, automatically estimated mPAP and mPAP measured by RHC did not differ significantly (mPAPauto = 43.0±12.3 mmHg, mPAPRHC = 42.7±14.6 mmHg, P=0.79; Figure 4) and correlated strongly (r = 0.94).Discussion
The proposed automated method successfully detected and tracked the PH-related vortex from 4D flow data. Swirling streamlines are a suitable flow topology-based criterion for PH-related vortex detection because they resemble the original definition of the PH-related vortex as groups of velocity vectors forming closed concentric tangent curves.5 Calculating streamlines in spatial forward and backward directions and only keeping the ones returning closer to the respective seeding points increases robustness of the method against noise in the measured velocity field. The streamline position and angulation as well as vortex volume criteria in PH-related vortex detection and tracking ensure that no other vortices in the pulmonary artery, e.g. purely valvular vortices, are mistaken for a PH-related vortex. While automated PH-related vortex detection agreed very well with visual analysis, the automated method has the advantages that it objectifies the PH-related vortex phenomenon and does not require knowledge and experience in the interpretation of the complex flow patterns in the pulmonary artery. Furthermore, the automated method allowed bias-free estimation of elevated mPAP with a standard deviation lower than the ones reported by other non-invasive mPAP estimation studies.6,7Conclusion
Automated PH-related vortex detection and tracking from 4D flow data is feasible and demonstrated very good agreement with visual analysis and accurate estimation of elevated mPAP.Acknowledgements
We thankfully acknowledge the support of the OeNB Anniversary Fund (Grant No. 17934) and the “University SAL Labs” initiative of Silicon Austria Labs (SAL).References
1. Reiter G, Reiter U, Kovacs G, Olschewski H, Fuchsjäger M. Blood flow vortices along the main pulmonary artery measured with MR imaging for diagnosis of pulmonary hypertension. Radiology. 2015;275(1):71–79.
2. Ramos JG, Fyrdahl A, Wieslander B, et al. Cardiovascular magnetic resonance 4D flow analysis has a higher diagnostic yield than Doppler echocardiography for detecting increased pulmonary artery pressure. BMC Med Imaging. 2020;20(1):1-9.
3. Reiter U, Kovacs G, Reiter C, et al. MR 4D flow-based mean pulmonary arterial pressure tracking in pulmonary hypertension. Eur Radiol. 2021;31(4):1883–1893.
4. Bhatia H, Norgard G, Pascucci V, et al. The Helmholtz-Hodge decomposition - a survey. IEEE Transactions on Visualization and Computer Graphics. 2013;19(8):1386-1404.
5. Reiter G, Reiter U, Kovacs G, et al. Magnetic resonance–derived 3-dimensional blood flow patterns in the main pulmonary artery as a marker of pulmonary hypertension and a measure of elevated mean pulmonary arterial pressure. Circ Cardiovasc Imaging. 2008;1(1):23–30.
6. Naeije R, Torbicki A. More on the noninvasive diagnosis of pulmonary hypertension: Doppler echocardiography revisited. Eur Respir J. 1995;8(9):1445–1449.
7. Johns CS, Kiely DG, Rajaram S, et al. Diagnosis of pulmonary hypertension with cardiac MRI: derivation and validation of regression models. Radiology. 2019;290(1):61–68.
Figures
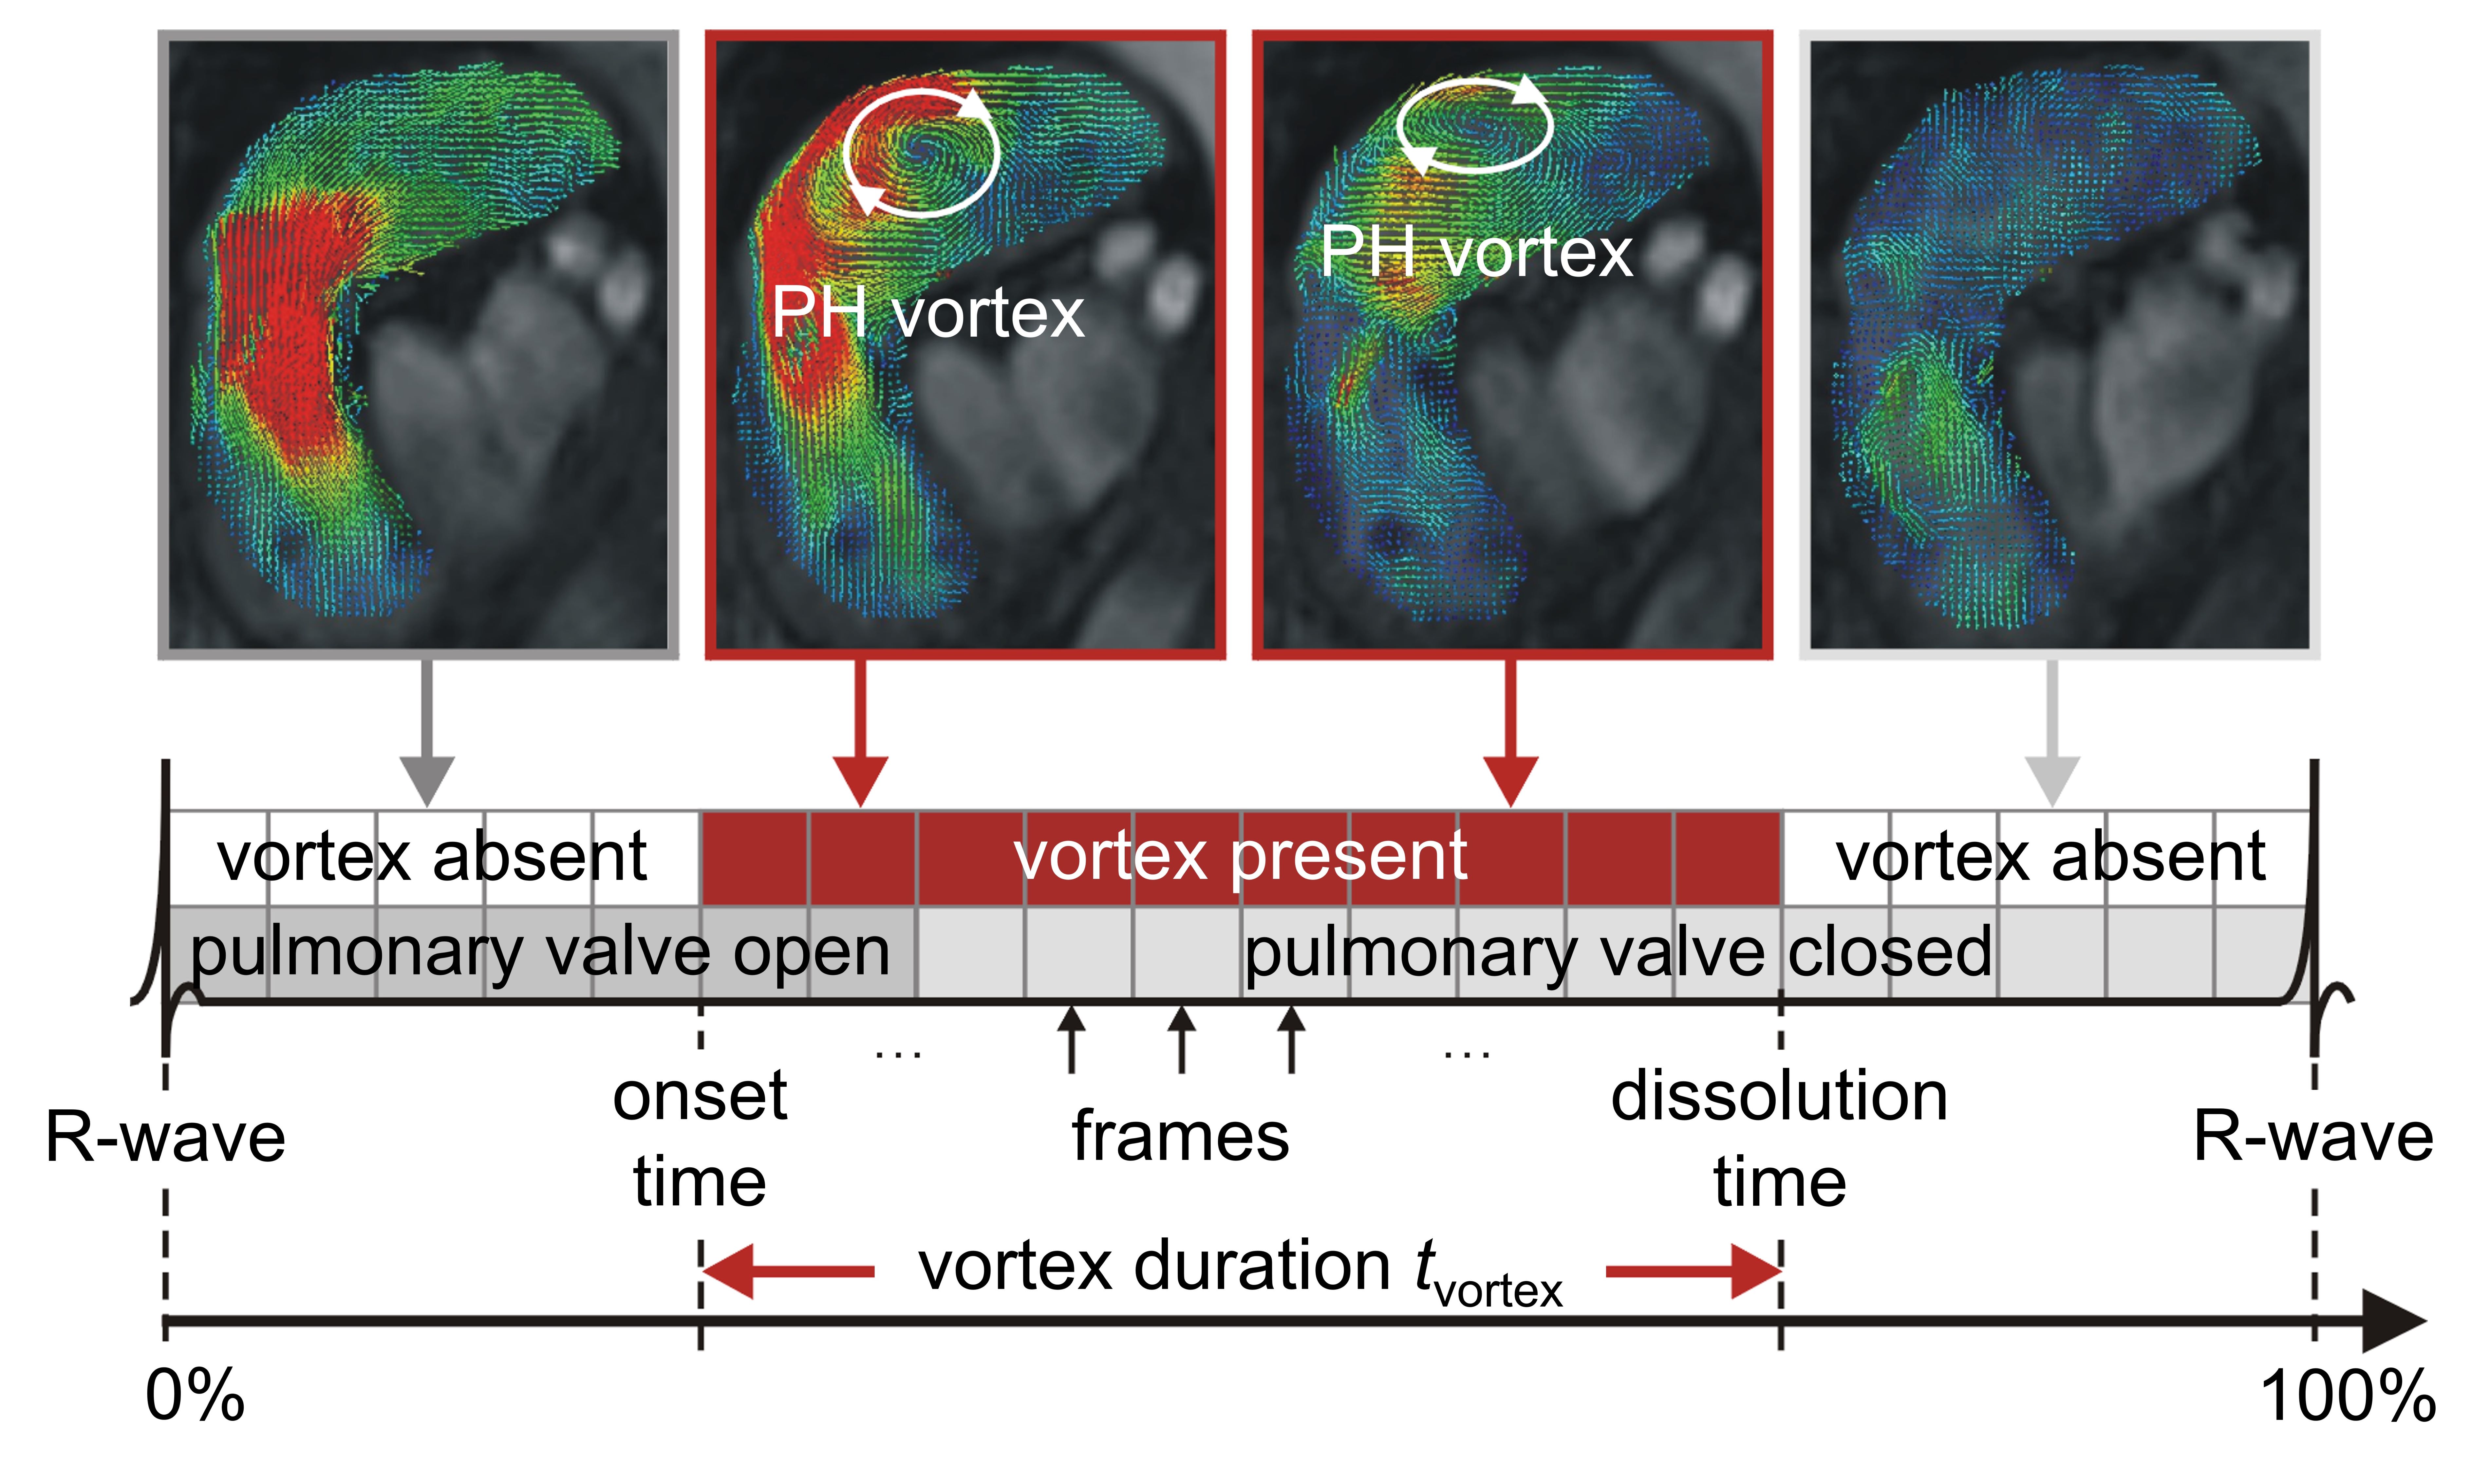
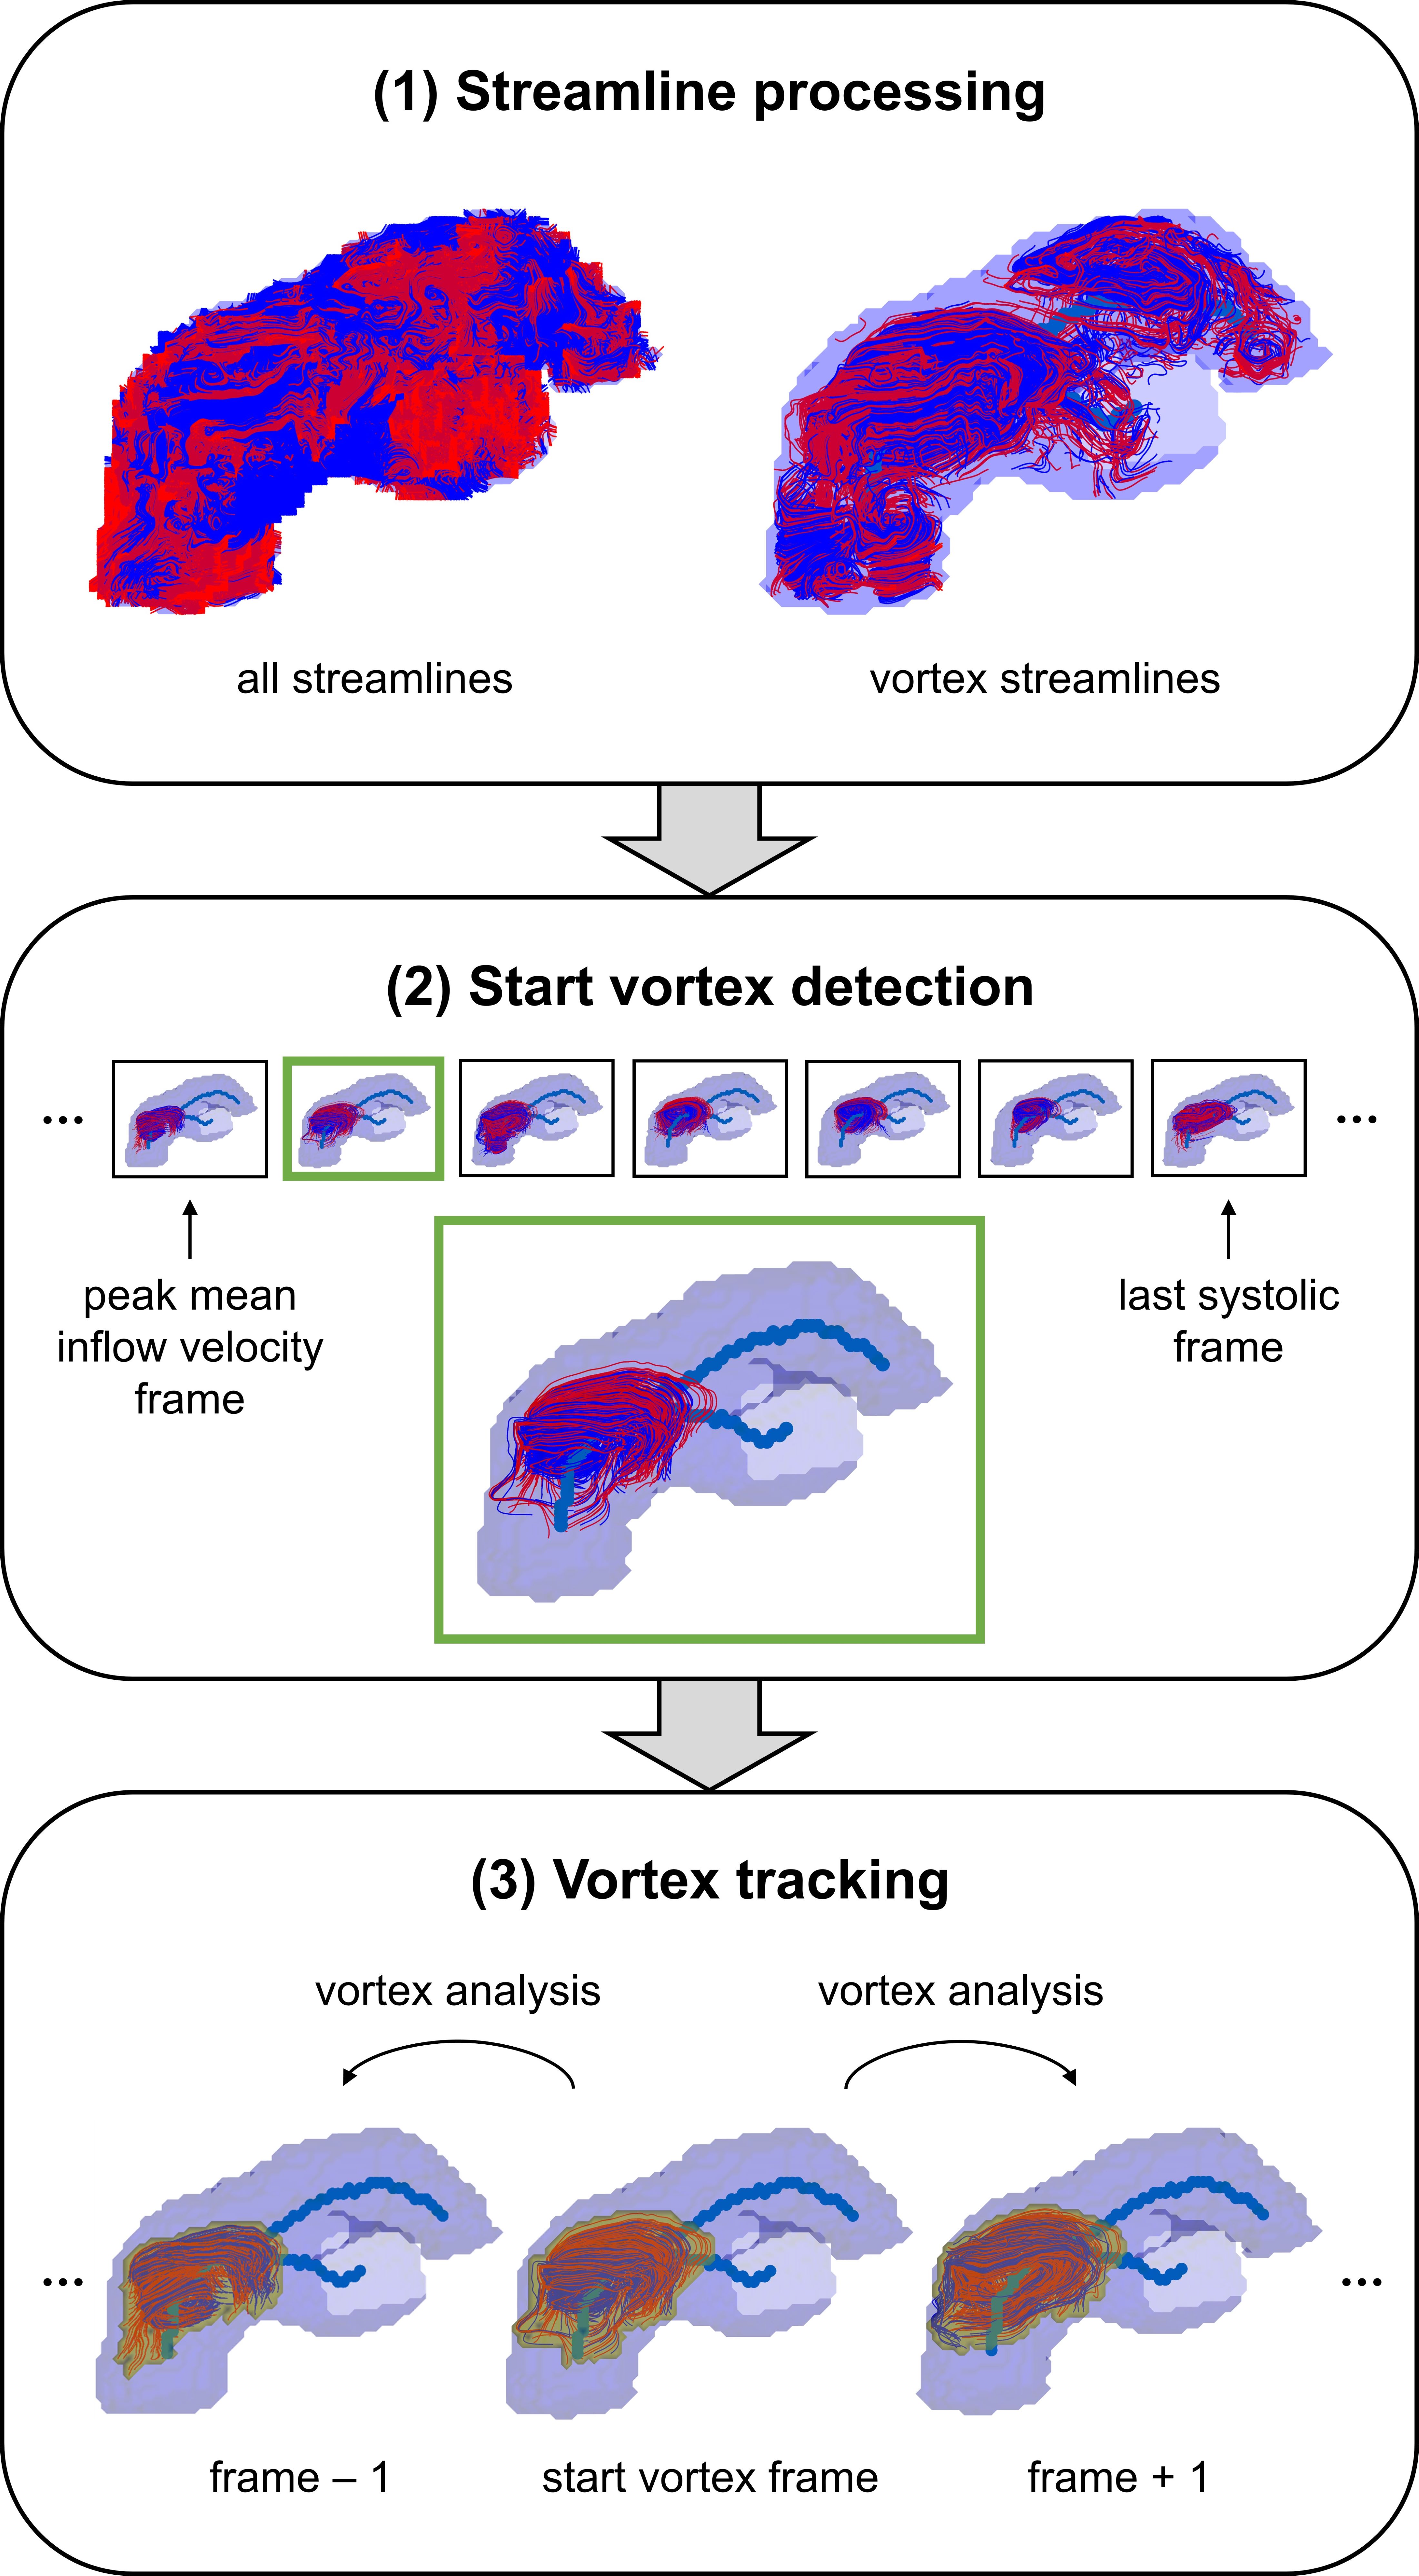
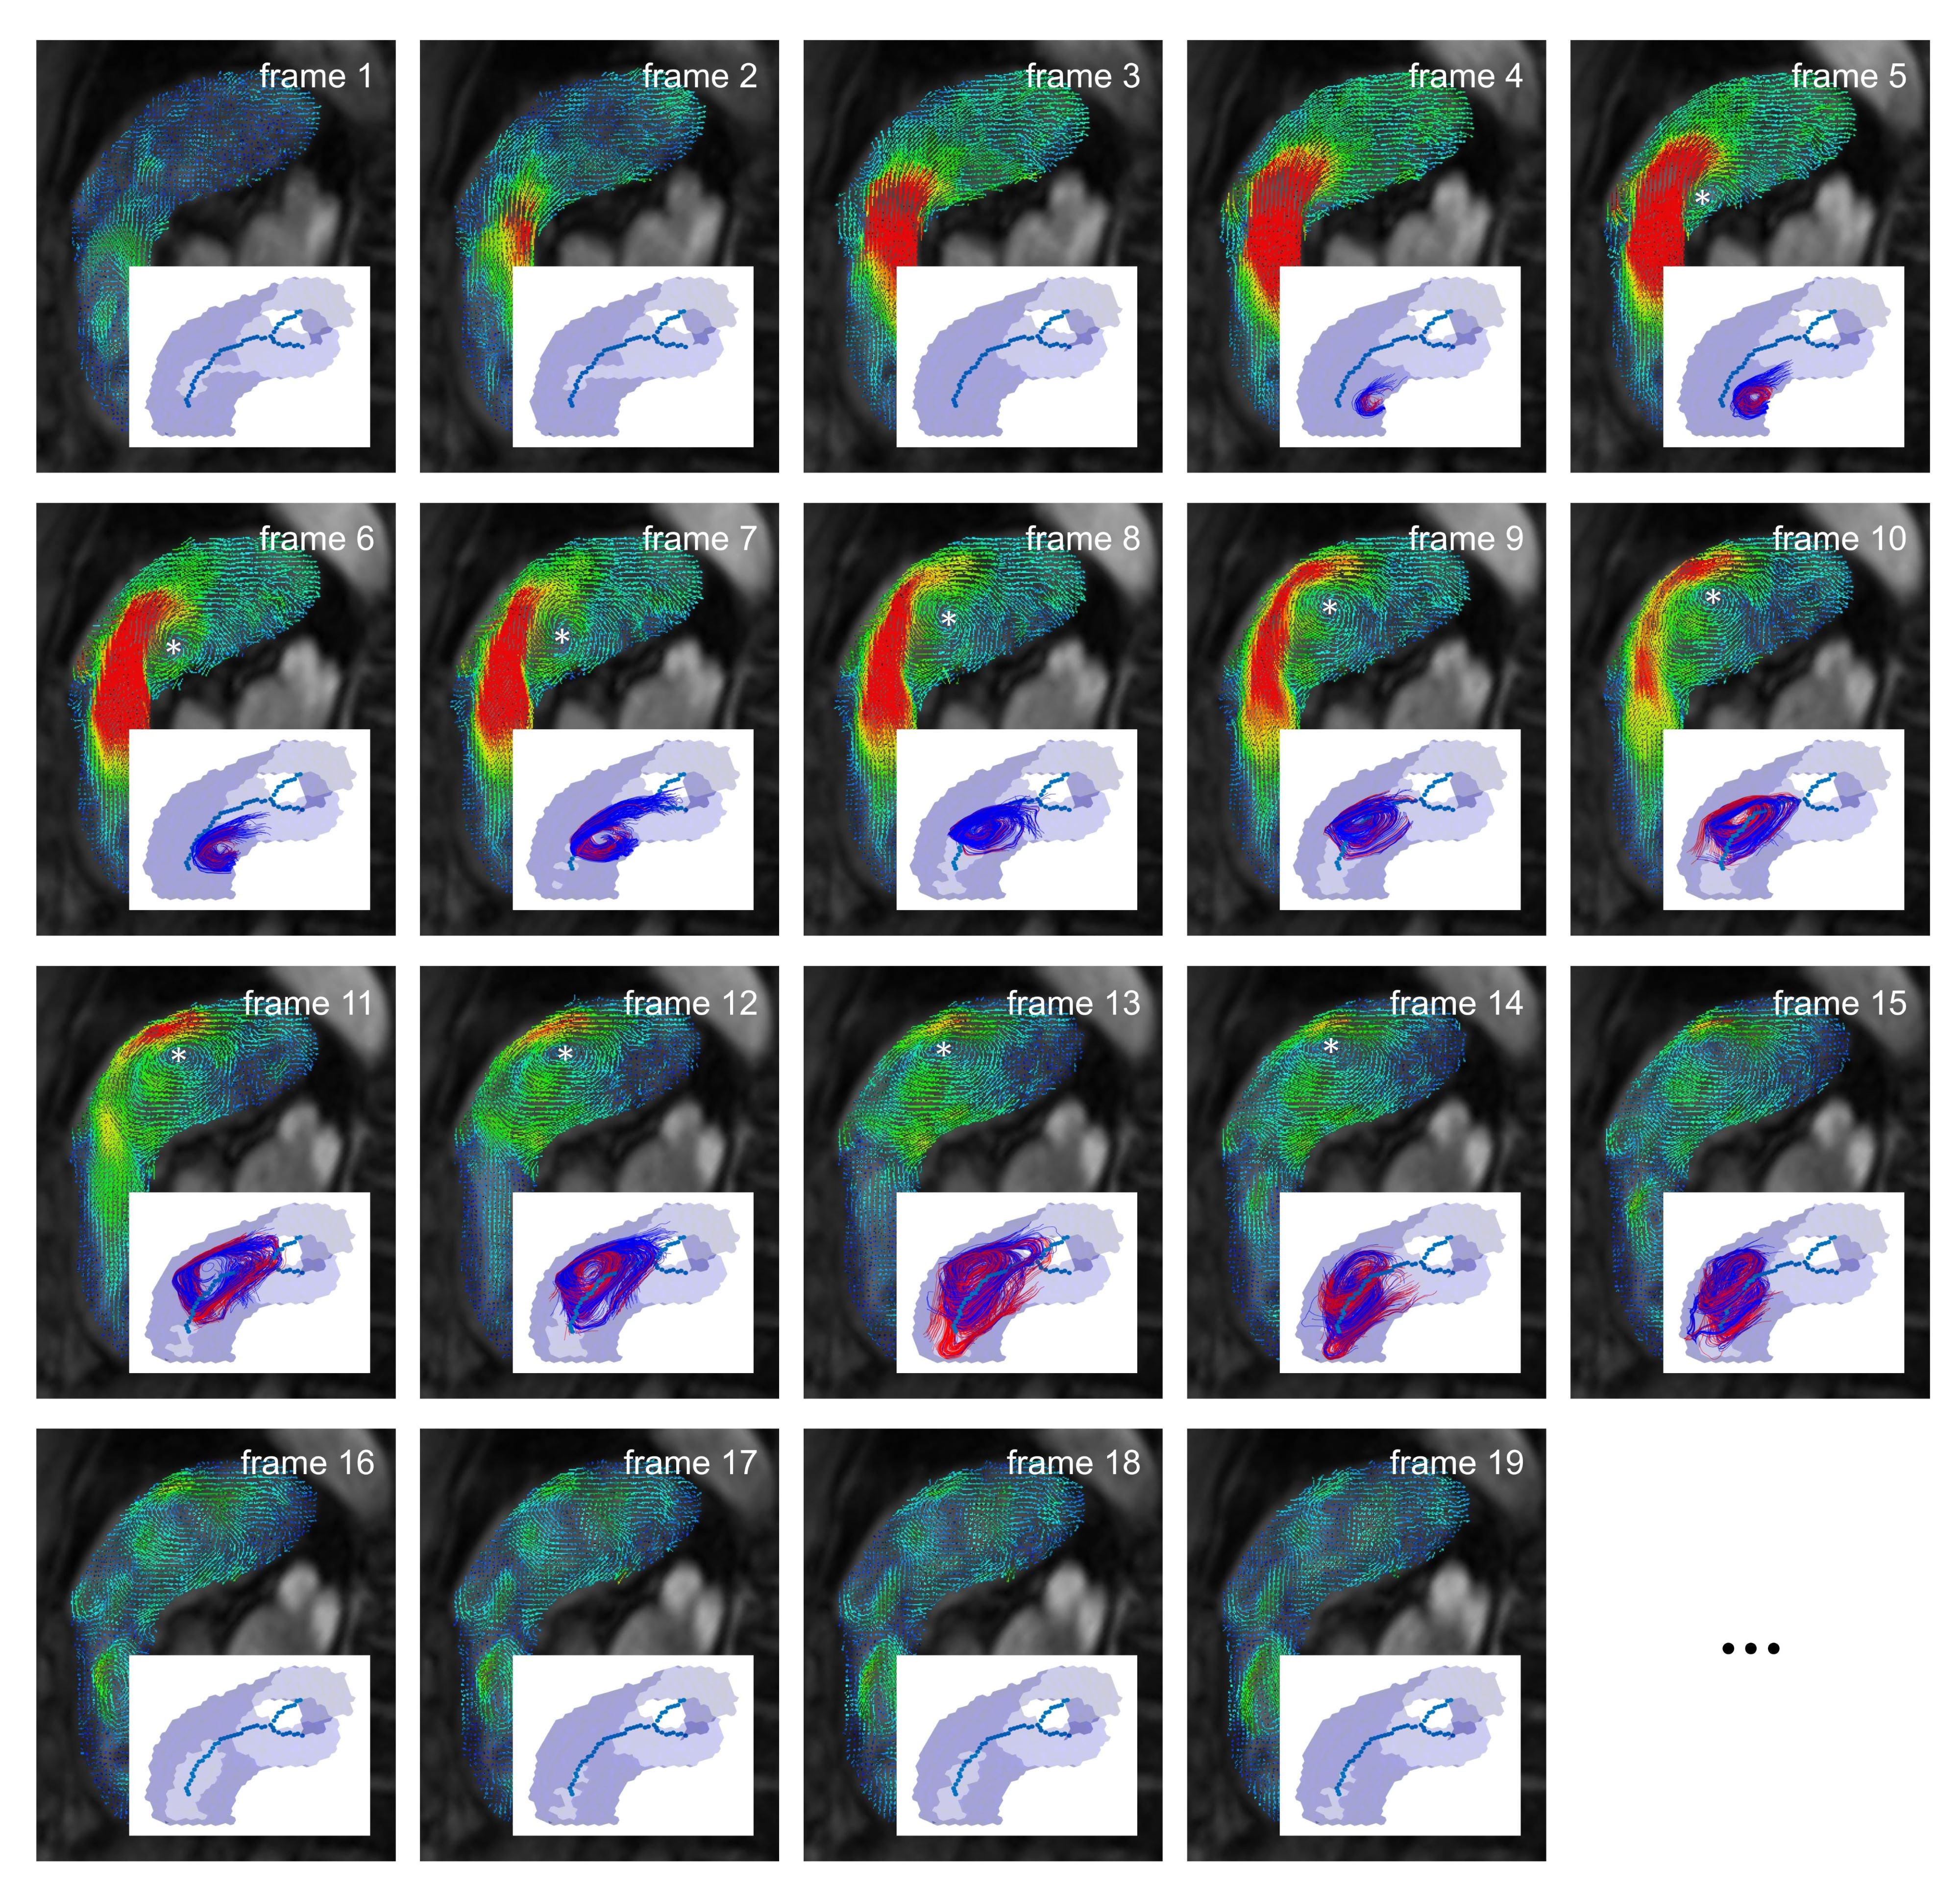
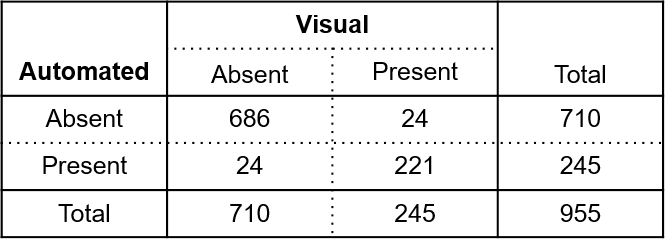
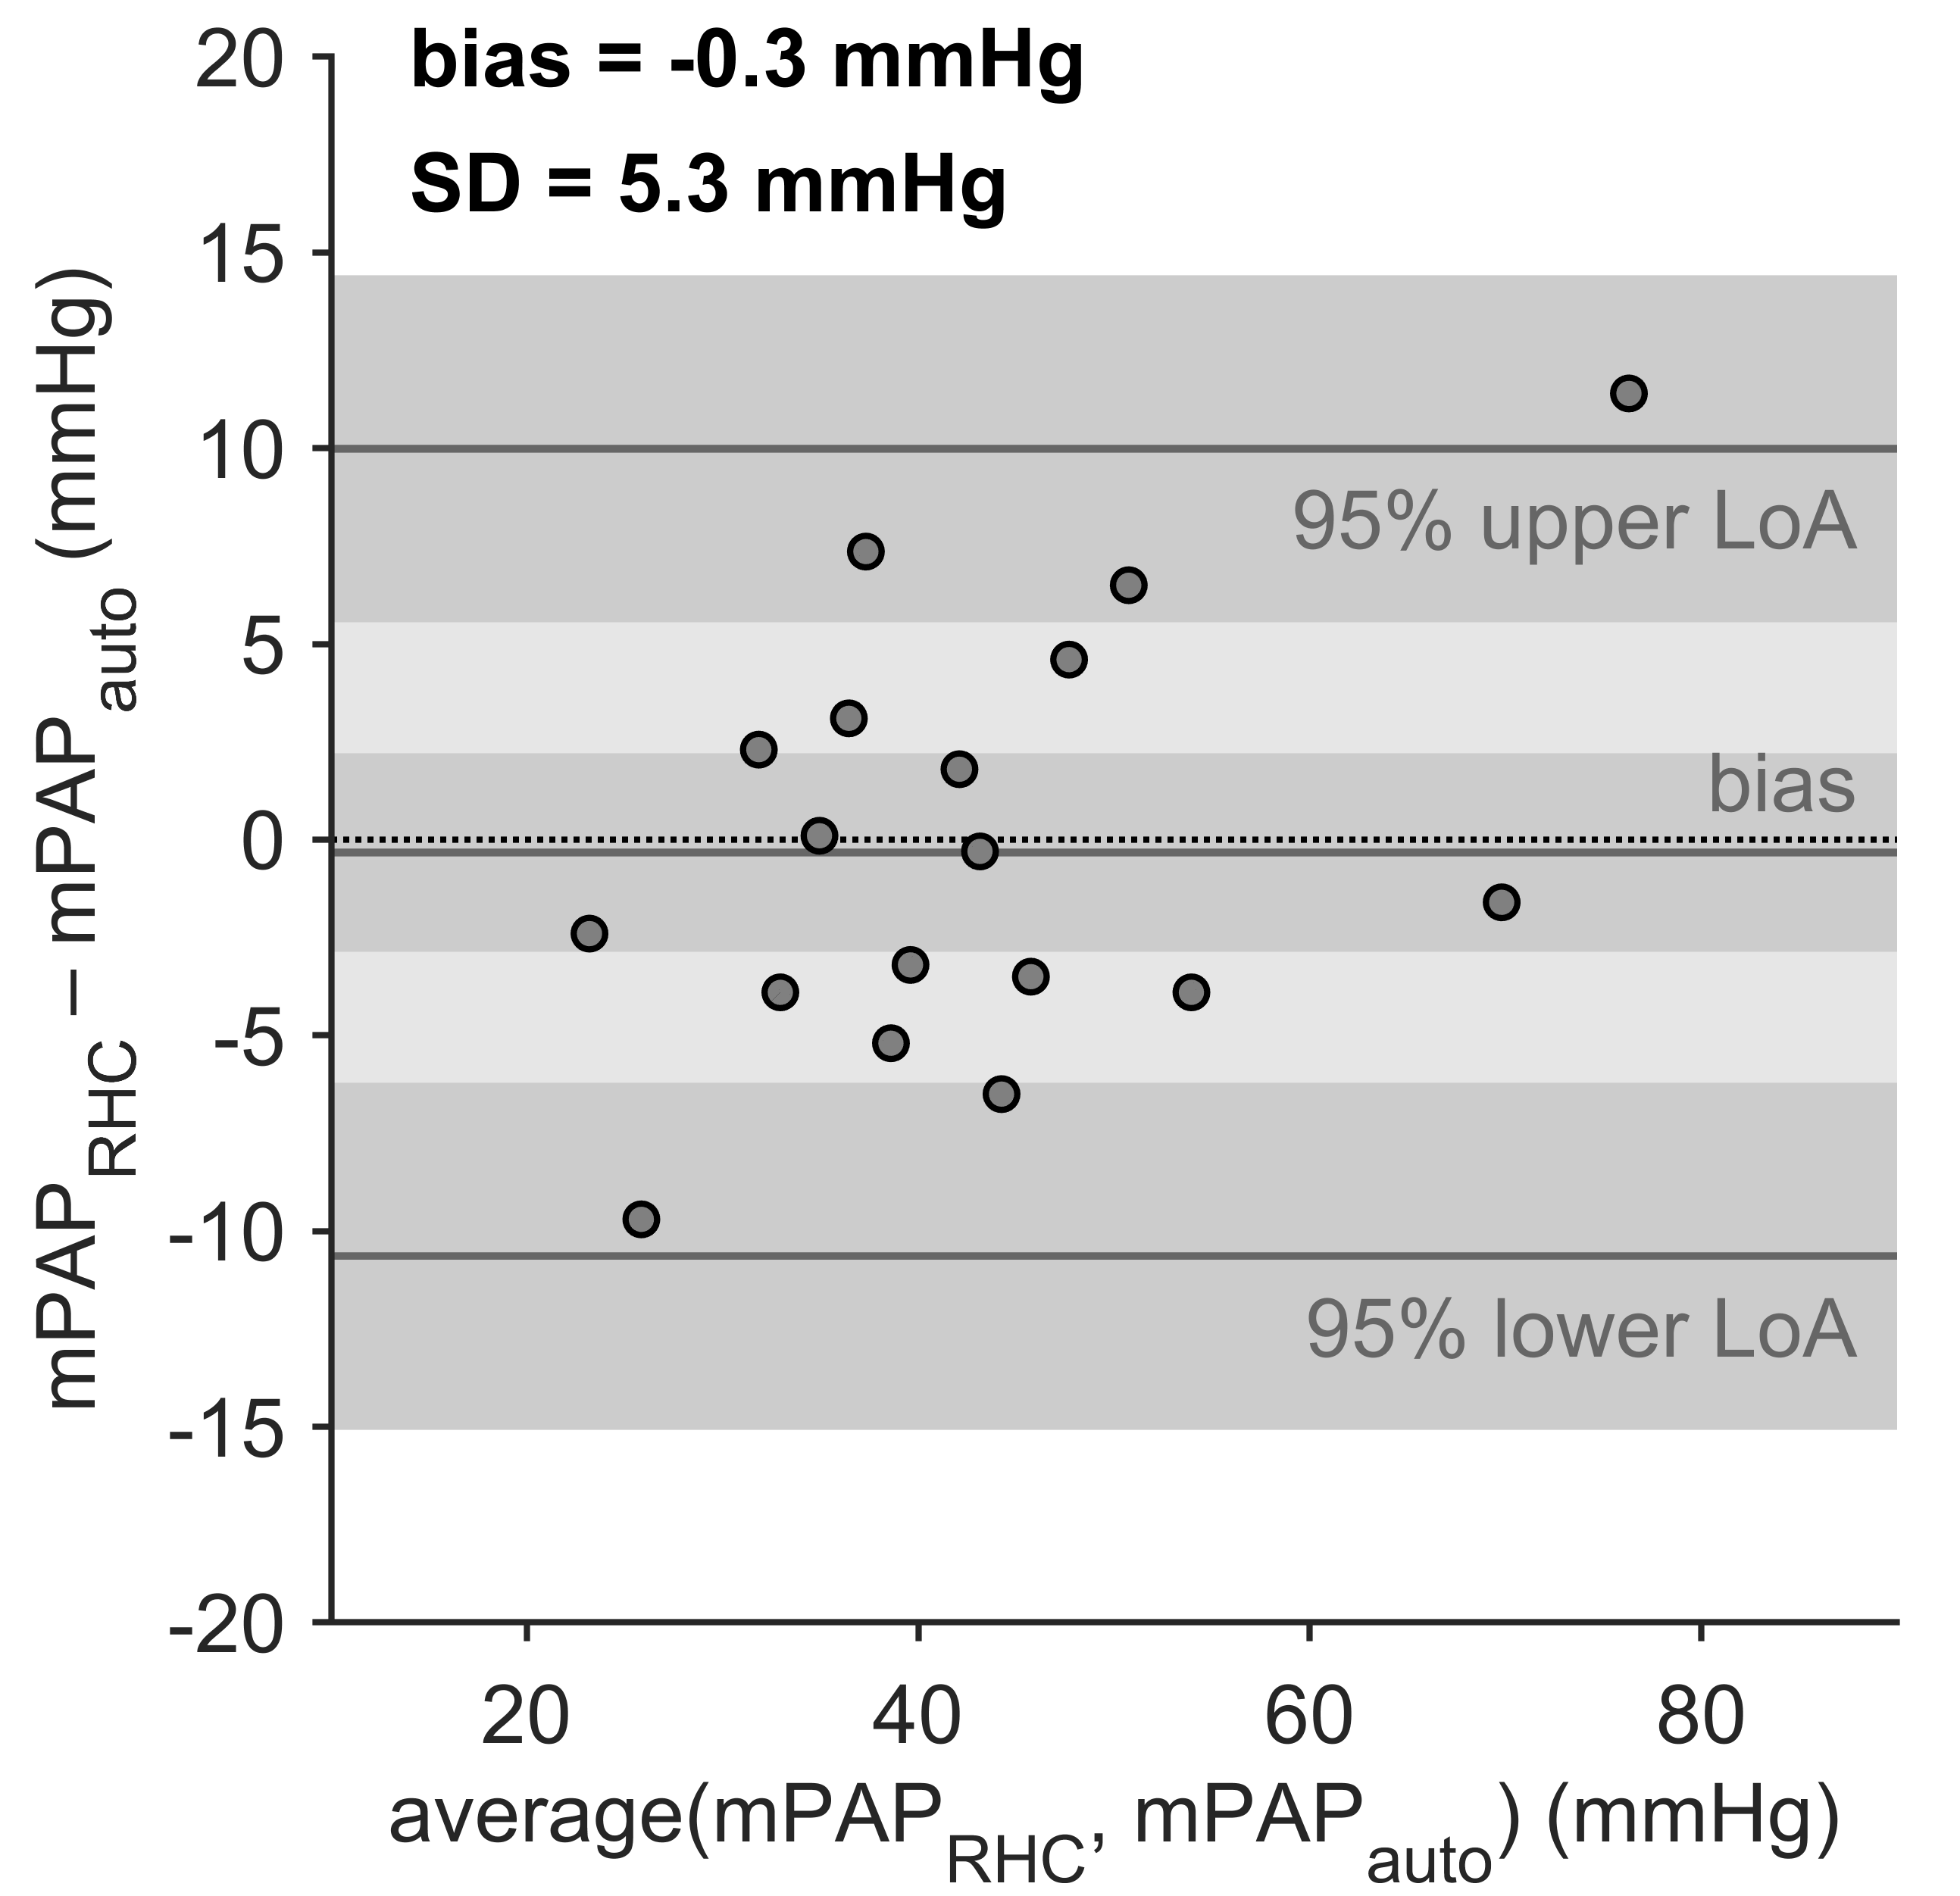
Figure 4: Bland–Altman plot for comparison of mPAP estimated by automated analysis (mPAPauto) and mPAP measured by RHC (mPAPRHC). The dark gray bars indicate the 95% confidence limits of the bias and the limits of agreement. SD, standard deviation of differences; LoA, limit of agreement.