0899
Effect of wall elasticity on flow MRI in 3D printed models
Isil Unal1, Duygu Dengiz2, Eva Peschke1, Echard Quandt2, Mona Salehi Ravesh1, Mariya Pravdivtseva1, Jan-Bernd Hövener1, and Olav Jansen1
1Section Biomedical Imaging, Molecular Imaging North Competence Center (MOIN CC), Department for Radiology and Neuroradiology, University Medical Center Schleswig-Holstein, Kiel, Germany, 2Institute for Materials Science, Faculty of Engineering, University of Kiel, Kiel, Germany
1Section Biomedical Imaging, Molecular Imaging North Competence Center (MOIN CC), Department for Radiology and Neuroradiology, University Medical Center Schleswig-Holstein, Kiel, Germany, 2Institute for Materials Science, Faculty of Engineering, University of Kiel, Kiel, Germany
Synopsis
2D phase-contrast (PC) MRI or 4D flow MRI allows to quantify the blood flow in vivo. However, the accuracy of these methods is influenced by many parameters. To optimize and validate these methods, patient-derived vascular models are key. Here, 3D printing is revolutionizing the manufacturing process, but realistic wall properties are essential for meaningful results. In this study, commercial elastic printing materials were used to fabricate vascular models. A tensile test was applied to all samples. Then the effect of wall elasticity on flow was investigated with 2D PC and 4D flow MRI. Wall motion was quantified using CINE MRI.
Introduction
The alteration of blood flow has important role in intracranial diseases, e.g. aneurysms. Acurate imaging of blood flow can improve diagnostics and planning of therapies. MRI allow to measure flow quantatively, non-invasively and in vivo, e.g. by 2D Phase Contrast (PC) or 4D Flow MRI. Therefore, further optimization of flow MRI is needed, ideally using a realistic model setup that can be analyzed in depth and used repetitively. Here, 3D printing emerges as a game changing technique allowing to produce individual, patient derived models [1]. Vessels, however, exhbit complex mechanical properties, which are not easily reproduced by printing. Most printing materials are rigid, and while some flexible are available, none were yet investigated with respect to mimiking the properties of vessel for MRI. Thus, our goals were a) to determine the elasticity properties of 3D printed materials, b) to evaluate the effect of different materials on flow MRI of printed vessels, and c) to measure the wall motion of printed vessels.Materials and Methods
3D printing: A stereolithography (SLA) 3D printer with ‘rigid’ (Urethane dimethacrylate, 78D shore), ‘flexible’ (Urethane Dimethacrylate, 80A shore), and ‘elastic’ (Isobornyl acrylate, 50A shore) resins were used (Form 3, Formlabs, USA) to produce; 1) Samples for tensile test (25x5x1 mm³, printing angles: 0°, 45°, and 90°). Models were printed layer-by-layer with SLA by the layer thickness (0.05 and 0.1 µm). Thus, the orientation of the model can impact the elastic properties of the material (Figure 1a,b). To investigate this effect, we printed samples in different orientations. Three samples were printed for ‘flexible’ and ‘elastic’ material and printing angle (18 in total); 2) Straight tubes (6 mm inner diameter, 3 mm wall thickness for rigid, 1 mm for elastic material) (Figure 1e). Tensile Test: For all samples, tests were performed in machine (Zwick Roell Z05, Fürstenfeld) at 24 °C. The samples were pulled until rupture (Figure 1c,d). Stress-strain diagram was obtained and fitted with a linear function y=ax +b, where a is the elastic modulus [2]. Experimental flow setup: ‘Rigid’ and ‘elastic’ tubes were printed and placed in boxes filled with agarose gel (4% and 0.5% by weight) and connected to a flow loop filled with 40/60 glycerol/water to mimic the blood viscosity (pulsatile flow with of 250 ml/min average, PD-1100, BDC Laboratories, USA). MRI measurements:MRI was performed on a 3 T clinical whole-body system, equipped with a 32 channel head coil (Ingenia CX, 5.6.1, Philips Healthcare) and the following sequences were applied three times: 1) 2D PC (TE/TR: 7.8/4.6 msec; FOV:180×180 mm2; voxel size: 0.75 mm; flip angle: 8°) 2) 4D Flow MRI: 3D velocity encoded, T1-weighted, spoiled fast gradient echo sequence with Cartesian sampling (TE/TR: 5/8.5 msec; FOV: 100×110×40 mm3; voxel size: 1 mm2; flip angle: 10°, maximum velocity-encoding (Venc) 50 cm/s), 3) CINE MRI (TE/TR: 5.9/3.0 msec; FOV: 300×300 mm2; voxel size: 0.5x0.5 mm2; flip angle: 45° 20 cardiac phases)). Middle section of tubes was used to measure the flow (GT Flow, 3.2.13, GyroTools, Switzerland) and the motion of the tube walls with ImageJ [4], (Fig. 2).Results
Tensile test: The elastic module for ‘flexible’ material was in a range of 0.4 – 0.76 MPa and ‘elastic’ material, it was slightly higher, ranging from 0.5 – 0.74 MP (Fig. 3). Still, the elastic module of both materials is close to one that was reported for the real artery - 0.75 ± 0.29 MPa [3]. Flow in tubes of different materials: The mean velocity change in the middle of the rigid and elastic tubes was measured using 2D PC MRI and 4D flow MRI (Fig. 4). For all materials, a fast increase and slow decrease was found due to the pulsatile flow. The maximum value of mean velocity in systole in the rigid tube was 26,54 % higher than the flexible tube. 4D flow and 2D PC MRI showed very similar results for rigid and elastic tubes. Wall motion in elastic tube: After processing the CINE MRI data change of cross-sectional area was obtained and draw as a diagram as area change in one cardiac pulse (Fig.5). The area in the elastic tube was found to change under pulsatile flow (Fig. 5). The area change exhibited a similar profile as the velocity.Discussion
Tensile test results showed us printing orientation effects the elastic modulus of printed parts and if appropriate printing material and layer orientation are used, similar elastic properties can be obtained to the real human artery to have realistic flow results from MRI measurements. Furthermore, similarity of results obtained by 2D PC and 4D flow MRI show the reliability of these techniques. Although CINE MRI is a method using in cardiac real-time imaging in big vessels and tissues, results showed this method is also suitable for vessel wall motion imaging and quantification with high resolutions.Conclusions
3D printing is promising for vessel models because it is possible to use commercially available materials to produce models in similar mechanical properties to real vessels. In this way, it is possible to describe differences of the flow parameters between rigid and elastic models and image the vessel wall motion in real-time.Acknowledgements
We are grateful for the financial and intellectual support by the Research Training Group “Materials4Brain” (GRK2154; P2b, P2a) and Molecular Imaging North Competence Center (MOIN CC).References
- Pravdivtseva, M.S. et al. 3D-printed, patient-specific intracranial aneurysm models: From clinical datatoflow experiments with endovascular devices. Med. Phys. 48 (4) (2021).
- Fahrenholz, H. The 2012 version of ISO 527 Plastics : Determination of tensile properties Zwick/Roell. (2018).
- Oktar, S. O. et al. Blood-flow volume quantification in internal carotid and vertebral arteries: Comparison of 3 different ultrasound techniques with phase-contrast MR imaging. Am. J. Neuroradiol. 27, 363–369 (2006).
- Rasband, W.S., ImageJ, U. S. National Institutes of Health, Bethesda, Maryland, USA, https://imagej.nih.gov/ij/, 1997-2018.
Figures
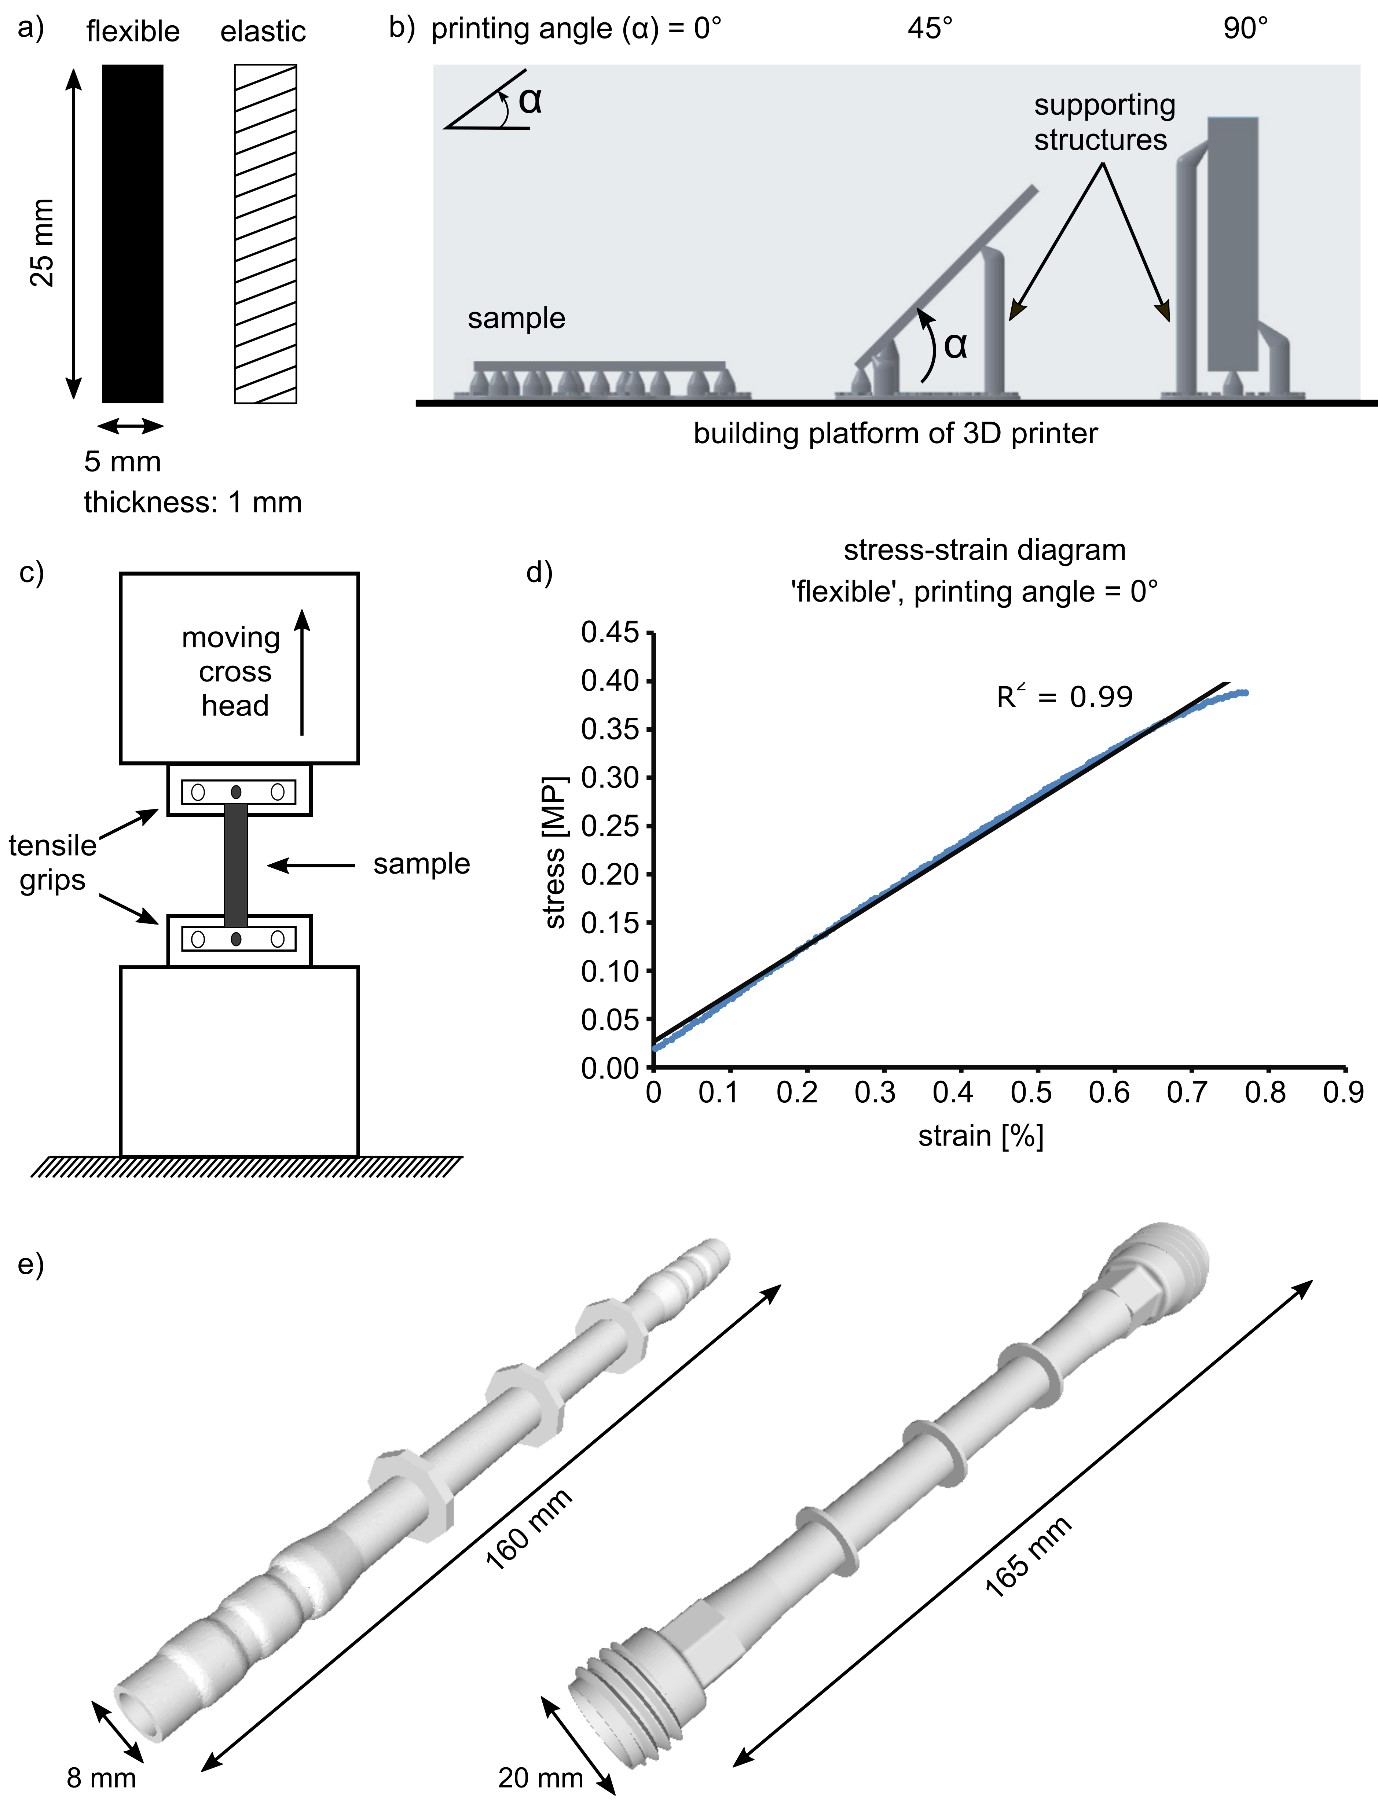
Figure 1: Schematic view of rectangular samples printed with ‘flexible’ material (a) and schematic view of printing configuration (b). The samples were printed three times from each material with α = 0°, 45°, 90° with respect to the printing platform. Sketch of tensile test machine (c), where the samples were placed between a fixed and moving head. Volume rendering of models used for MRI experiments (e), left – ‘elastic’ tube and right – ‘rigid’ tube. Each tube equipped with MRI-visible markers.
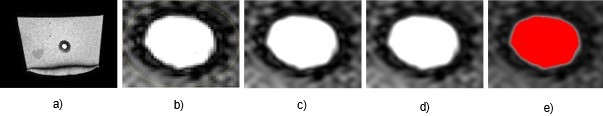
Figure 2: Quantifing the wall motion on CINE-MR. The full MRI (a) was cropped (b), pixel size adjustment (c) and smoothed (d) before the voxles in the lumen were counted using an intensity threshold (e, red).
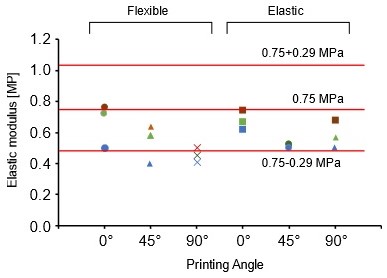
Figure 3: Elastic modulus measured for 18 pieces of rectangular samples with 0°, 45° and 90° printing orientation were represented with the different shapes on the diagram. Red lines shows the elastic modulus of real cerebral artery which is changing between 0.75± 0.29 MPa.
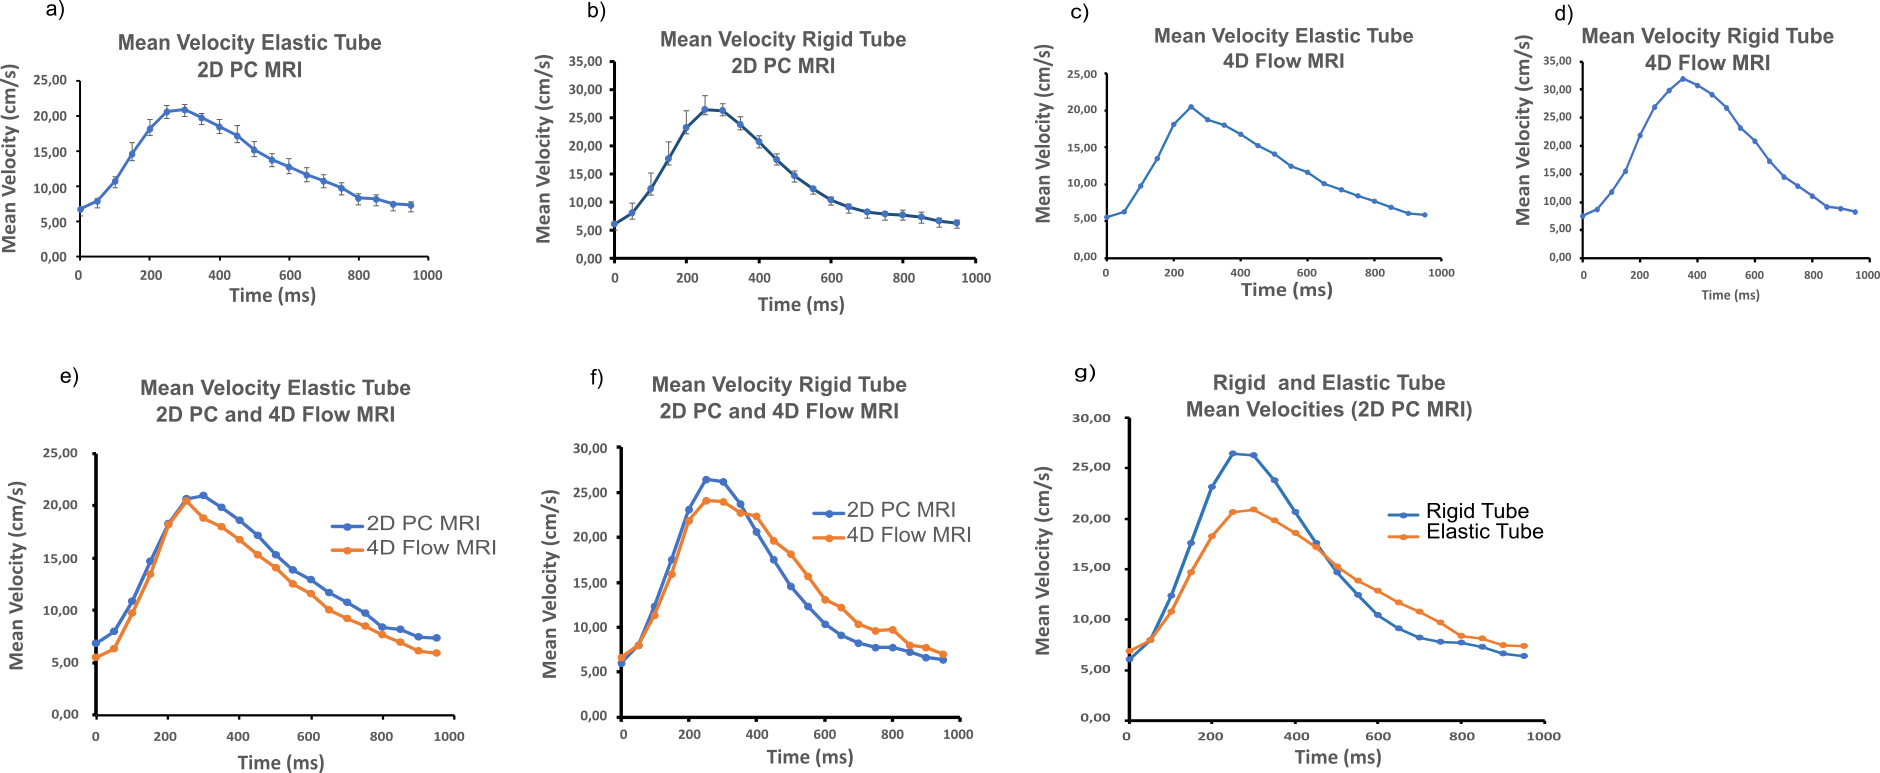
Figure 4: Mean flow velocities measured in the middle of rigid and elastic straight tubes using 2D PC and 4D flow MRI. Velocities in tubes show obvious differences as a result of 2D PC and 4D Flow MRI measurements. (a,b,c,d). In the comparison of the 2D PC and 4D flow MRI results for individual tubes, results shows similar velocity profiles (e,f). According to the comparison of the velocity results of 2D PC MRI, it can be seen in rigid tube, maximum mean velocity is 26.54% higher than elastic tube (g).
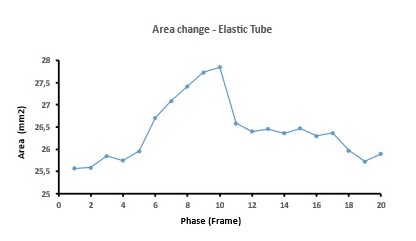
Figure 5: Change in cross-sectional area in the middle of elastic tube measured with CINE MRI using VCG triggering with 60 beat per minute which is the same frequency of cardiac pump as function of time while supplied with pulsatile flow. In this diagram, x axis shows the phases which is the data acquisition period in one cardiac cycle and y axis shows flow area which was calculated (voxel size) x (voxel amount).
DOI: https://doi.org/10.58530/2022/0899