0893
Spinal Cord Lesions and Brain Grey Matter Atrophy Predict 5-Year Disease Worsening in Multiple Sclerosis: A Multicentre Study
Paola Valsasina1, Maria A. Rocca1,2,3, Alessandro Meani1, Loredana Storelli1, Claudio Gobbi4,5, Chiara Zecca4,5, Frederik Barkhof6,7, Menno M Schoonheim8, Eva Strijbis7, Hugo Vrenken6,7, Antonio Gallo9, Alvino Bisecco9, Olga Ciccarelli10, Marios Yiannakas10, Alex Rovira11, Jaume Sastre-Garriga12, Jacqueline Palace13, Lucy Matthews13, Achim Gass14, Philipp Eisele14, Carsten Lukas15, Barbara Bellenberg15, Monica Margoni1, Paolo Preziosa1,2, and Massimo Filippi1,2,3,16,17
1Neuroimaging Research Unit, Division of Neuroscience, IRCCS San Raffaele Scientific Institute, Milan, Italy, 2Neurology Unit, IRCCS San Raffaele Scientific Institute, Milan, Italy, 3Vita-Salute San Raffaele University, Milan, Italy, 4Neurology Clinic, MS Center/ Headache Center, Neurocenter of Southern Switzerland, Lugano, Switzerland, 5Faculty of Biomedical Sciences, Università della Svizzera Italiana, Lugano, Switzerland, 6Radiology and Nuclear Medicine, MS Center Amsterdam, Amsterdam UMC, location Vumc, Amsterdam, Netherlands, 7Department of Neurology, MS Center Amsterdam, Amsterdam UMC, location Vumc, Amsterdam, Netherlands, 8Department of Anatomy and Neurosciences, MS Center Amsterdam, Amsterdam UMC, location Vumc, Amsterdam, Netherlands, 9Department of Advanced Medical and Surgical Sciences, and 3T MRI-Center, University of Campania “Luigi Vanvitelli”, Naples, Italy, 10NMR Research Unit, Queen Square MS Centre, Department of Neuroinflammation, UCL Institute of Neurology, London, United Kingdom, 11Section of Neuroradiology, Department of Radiology, Hospital Universitari Vall d'Hebron, Barcelona, Spain, 12Department of Neurology/Neuroimmunology, Multiple Sclerosis Centre of Catalonia, Hospital Universitari Vall d'Hebron, Barcelona, Spain, 13Nuffield Department of Clinical Neurosciences, University of Oxford, Oxford, United Kingdom, 14Department of Neurology, Universitätsmedizin Mannheim, University of Heidelberg, Mannheim, Germany, 15Institute of Neuroradiology, St. Josef Hospital, Ruhr-University Bochum, Bochum, Germany, 16Neurorehabilitation Unit, IRCCS San Raffaele Scientific Institute, Milan, Italy, 17Neurophysiology Service, IRCCS San Raffaele Scientific Institute, Milan, Italy
1Neuroimaging Research Unit, Division of Neuroscience, IRCCS San Raffaele Scientific Institute, Milan, Italy, 2Neurology Unit, IRCCS San Raffaele Scientific Institute, Milan, Italy, 3Vita-Salute San Raffaele University, Milan, Italy, 4Neurology Clinic, MS Center/ Headache Center, Neurocenter of Southern Switzerland, Lugano, Switzerland, 5Faculty of Biomedical Sciences, Università della Svizzera Italiana, Lugano, Switzerland, 6Radiology and Nuclear Medicine, MS Center Amsterdam, Amsterdam UMC, location Vumc, Amsterdam, Netherlands, 7Department of Neurology, MS Center Amsterdam, Amsterdam UMC, location Vumc, Amsterdam, Netherlands, 8Department of Anatomy and Neurosciences, MS Center Amsterdam, Amsterdam UMC, location Vumc, Amsterdam, Netherlands, 9Department of Advanced Medical and Surgical Sciences, and 3T MRI-Center, University of Campania “Luigi Vanvitelli”, Naples, Italy, 10NMR Research Unit, Queen Square MS Centre, Department of Neuroinflammation, UCL Institute of Neurology, London, United Kingdom, 11Section of Neuroradiology, Department of Radiology, Hospital Universitari Vall d'Hebron, Barcelona, Spain, 12Department of Neurology/Neuroimmunology, Multiple Sclerosis Centre of Catalonia, Hospital Universitari Vall d'Hebron, Barcelona, Spain, 13Nuffield Department of Clinical Neurosciences, University of Oxford, Oxford, United Kingdom, 14Department of Neurology, Universitätsmedizin Mannheim, University of Heidelberg, Mannheim, Germany, 15Institute of Neuroradiology, St. Josef Hospital, Ruhr-University Bochum, Bochum, Germany, 16Neurorehabilitation Unit, IRCCS San Raffaele Scientific Institute, Milan, Italy, 17Neurophysiology Service, IRCCS San Raffaele Scientific Institute, Milan, Italy
Synopsis
Aim of this study was to evaluate the independent role of brain and cervical cord damage in predicting 5-year clinical disability worsening in a multicentre cohort of multiple sclerosis patients. Results showed that cortical atrophy and spinal cord damage, together with baseline disability and progressive disease phenotype, independently predicted 5-year disability worsening (C-index=0.81). Older age, higher clinical disability and cord lesion number independently predicted conversion to a progressive disease phenotype (C-index=0.91). Focal spinal cord lesions and cortical atrophy had also a role in predicting clinically-relevant disability milestones at 5 years.
Introduction
Multiple sclerosis (MS) is a chronic, inflammatory and neurodegenerative disease of the central nervous system, characterized by non-uniform clinical manifestations and a variable disease progression [1]. In MS, the combined role of brain and spinal cord MRI damage in predicting medium-term disease evolution still needs to be fully elucidated. Against this background, aim of this study was to evaluate the independent role of brain and cervical cord damage in predicting 5-year clinical disability worsening in a multicentre cohort of MS patients, recruited from 9 European sites.Methods
Baseline 3.0 T brain and cervical cord T2- and 3D T1-weighted MRI sequences were acquired in 367 MS patients (326 relapse-onset, 41 progressive-onset) and 179 healthy controls [2]. Expanded Disability Status Scale (EDSS) score was obtained at baseline and after a median follow-up of 5.1 years (interquartile range=4.5-5.5). Clinical worsening was defined as an EDSS score increase ≥1.5 when baseline EDSS was=0.0; an EDSS score increase ≥1.0 when baseline EDSS≤5.5; and an EDSS score increase ≥0.5 when baseline EDSS was ≥6.0 [3]. Generalized linear mixed models with L1-penalized variable selection identified the 5-year predictors of EDSS worsening, secondary progressive (SP) MS conversion in relapsing-remitting (RR) MS, and reaching EDSS=3.0, 4.0 and 6.0 milestones.Results
At follow-up, 120/367 (33%) MS patients worsened clinically and 36/256 (14%) RRMS patients evolved to SPMS. MS patients reaching EDSS=3.0 at 5 year were 20 (out of 152, 13%), while MS patients reaching EDSS=4.0 at 5 years were 30 (out of 209, 14%), and patients reaching EDSS=6.0 at 5 years were 37 (out of 288, 13%). Significant predictors of clinical worsening at univariate analysis are shown in Figure 1. At multivariate analysis, predictors of clinical worsening were progressive- vs relapse-onset MS (standardized beta [b]=0.97), baseline EDSS score (b=0.41), higher cord lesion number (b=0.41), lower normalized cortical volume (b=-0.15) and cord cross-sectional area (CSA) (b=-0.28) (C-index=0.81). Significant predictors of SPMS conversion at univariate analysis are shown in Figure 2. At multivariate analysis, older age (b=0.86), higher EDSS score (b=1.40) and cord lesion number (b=0.87) independently predicted SPMS conversion (C-index=0.91). Significant univariate predictors of reaching clinically-relevant EDSS milestones are shown in Figure 3. At multivariate analysis, predictors of reaching EDSS=3.0 (C-index=0.88) were higher baseline EDSS score (b=1.49) and cord lesion number (b=1.02), and lower normalized cortical volume (b=-0.56). Baseline age (b=0.30), higher EDSS score (b=2.03), higher cord lesion number (b=0.66), and lower cord CSA (b=-0.41) predicted EDSS=4.0 (C-index=0.92). Finally, higher baseline EDSS score (b=1.87) and higher cord lesion number (b=0.54) predicted EDSS=6.0 (C-index=0.91).Discussion
Cortical atrophy and spinal cord damage independently predicted 5-year disability worsening in MS. Focal spinal cord lesions had a role in predicting both evolution to a progressive phenotype and disability milestones. In addition, cord atrophy was one of the determinants of locomotor disability.Conclusions
In MS patients, cortical atrophy and spinal cord lesions and cord atrophy independently predicted 5-year disability worsening, reaching of EDSS milestones and SPMS conversion. The combined assessment of brain and spinal cord damage may better identify MS patients who will have disease progression after 5 years.Acknowledgements
No acknowledgement found.References
[1] Filippi M, Bar-Or A, Piehl F, Preziosa P, Solari A, Vukusic S, Rocca MA. Multiple sclerosis. Nat Rev Dis Primers 2018; 4(1):43. [2] Rocca MA, Valsasina P, Meani A, Gobbi C, Zecca C, Rovira À, Montalban X, Kearney H, Ciccarelli O, Matthews L, Palace J, Gallo A, Bisecco A, Gass A, Eisele P, Lukas C, Bellenberg B, Barkhof F, Vrenken H, Preziosa P, Comi G, Filippi M; MAGNIMS Study Group. Clinically relevant cranio-caudal patterns of cervical cord atrophy evolution in MS. Neurology. 2019;93(20):e1852-e1866. [3] Rocca MA, Valsasina P, Meani A, Pagani E, Cordani C, Cervellin C, Filippi M. Network Damage Predicts Clinical Worsening in Multiple Sclerosis: A 6.4-Year Study. Neurol Neuroimmunol Neuroinflamm. 2021;21;8(4):e1006.Figures
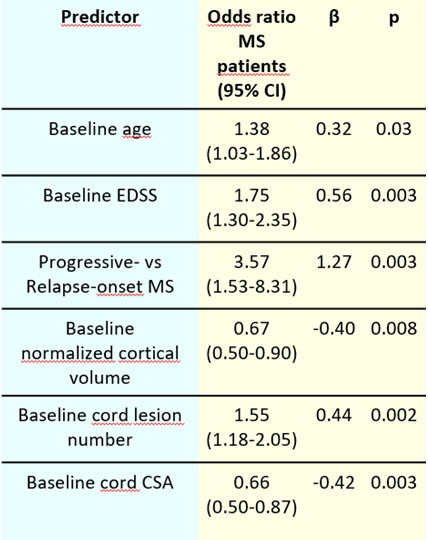
Figure 1. Significant
predictors of clinical worsening at the univariate analysis, assessed using
treatment-adjusted generalized linear mixed models accounting for site effect.
Abbreviations: EDSS=Expanded Disability Status Scale score; CSA=cross-sectional
area.
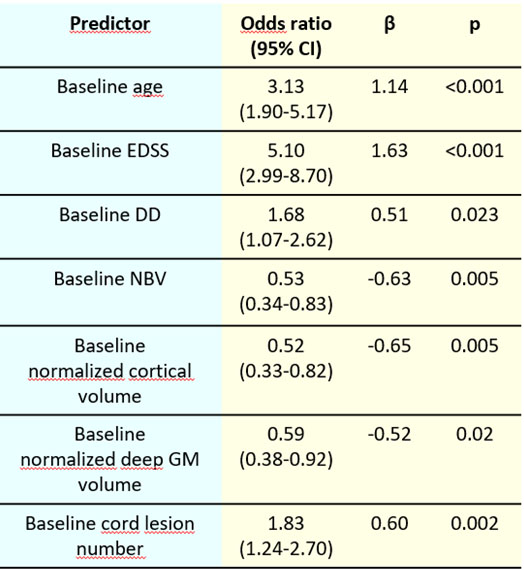
Figure 2. Significant
predictors of conversion to secondary progressive multiple sclerosis (MS) in
relapsing-remitting MS at the univariate analysis, assessed using
treatment-adjusted generalized linear mixed models accounting for site effect.
Abbreviations: EDSS=Expanded Disability Status Scale score; DD=disease
duration; NBV=normalized brain volume; GM=grey matter.
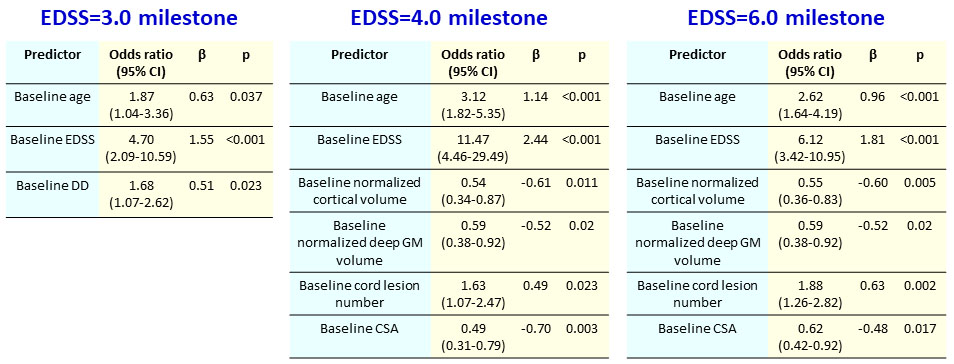
Figure 3. Significant
predictors of reaching an Expanded Disability Status Scale (EDSS) score=3.0, 4.0
and 6.0 at the univariate analysis, assessed using treatment-adjusted
generalized linear mixed models accounting for site effect. Abbreviations:
EDSS=Expanded Disability Status Scale score; DD=disease duration; GM=grey
matter; CSA=cross-sectional area.
DOI: https://doi.org/10.58530/2022/0893