0892
Differences in myelin measures between slowly evolving and non-slowly evolving lesions1University of British Columbia, Vancouver, BC, Canada, 2NeuroRX Research, Montreal, QC, Canada, 3McGill University, Montreal, QC, Canada, 4F Hoffmann-La Roche Ltd, Basel, Switzerland, 5Genentech Inc, San Francisco, CA, United States
Synopsis
Multiple sclerosis (MS) slowly evolving lesions (SELs) are defined on MRI as contiguous regions of pre-existing lesions with constant and concentric local expansion on conventional T1-weighted and T2-weighted images. Myelin-related changes using myelin water fraction (MWF) and magnetization transfer ratio (MTR) in SELs and non-SELs were measured over 192 weeks in patients with relapsing MS. SELs showed reduced myelin measures at baseline compared to non-SELs. Furthermore, over the 4 years, only SELs, and not non-SELs, showed a significant mean decrease in MWF and increase in T1. Both results are indicative of progressive demyelination in this subgroup of chronic lesions.
Introduction
Multiple sclerosis (MS) slowly evolving lesions (SELs) are defined on MRI as contiguous regions of pre-existing lesions with constant and concentric local expansion on conventional T1-weighted and T2-weighted images1. SELs are thought to represent areas of chronic inflammation, presumed to lead to ongoing axonal damage and demyelination2,3. Quantitative MRI measures including myelin water fraction (MWF) and magnetization transfer ratio (MTR) can be used to quantify changes affecting myelin in SELs. Increases in T1 relaxation times are found with both increases in water content and demyelination.Objective
To monitor myelin-related changes over 192 weeks using MWF and MTR in SELs and non-SELs (detected over the first 96 weeks) in people with relapsing multiple sclerosis (RMS).Methods
Fifty participants with RMS randomised to interferon β-1a and ocrelizumab for 96 weeks and then switched to or remained on ocrelizumab for 96 weeks (31 females; mean baseline age: 37.4±9.4 years; median baseline EDSS: 2.0 (range 0-4.5); total baseline T2 lesion volume: 9.07±14.25 cm3) participating in a substudy of OPERA II (NCT01412333) were included.Scans were acquired on a Philips 3T Achieva scanner (Best, The Netherlands) at baseline, Week 24, Week 48, Week 96, Week 144 and Week 192. Sequences included: T1-weighted (TR = 28 ms, TE = 4 ms, α = 27°, voxel size = 1×1×3 mm3, FOV = 250×188×180 mm3, 60 slices), T2-weighted (TR = 6100 ms, TE = 80 ms, voxel size = 1×1×3 mm3, FOV = 250×188×180 mm3, 60 slices, ETL = 8), FLAIR (TR = 9000 ms, TE = 80 ms, TI = 2500 ms, voxel size = 1×1×3 mm3, FOV = 250×188×180 mm3, 60 slices, ETL = 12), mcDESPOT4 (SPGR: TR = 6.5 ms; TE = 3.6 ms; α = [2, 3, 4, 6, 9, 13, 18]°, bSSFP: TR = 5.8 ms; TE = 2.9 ms; α = [7, 11, 15, 19, 24, 30, 47]° acquired with phase‐cycling patterns of 0° and 180°, IR-SPGR: TR = 6.5 ms; TE = 3.2 ms; α = 5°; TI = 450 ms; voxel size = 1.7×1.7×1.7 mm3 and FOV = 220×160×220 mm3) and MTR (TR = 85 ms, TE=3.7 ms, voxel size = 1×1x2.5 mm3, FOV = 230×192×100 mm3, 40 slices, flip angle = 18°, with and without a saturation pulse: off-resonance RF pulse centered 1.1 kHz below the water frequency, sinc-gaussian envelope duration = 15 ms, bandwidth = 190 Hz, amplitude = 2.3x10⁻⁶ T). Only a subset of participants had the MTR scan.
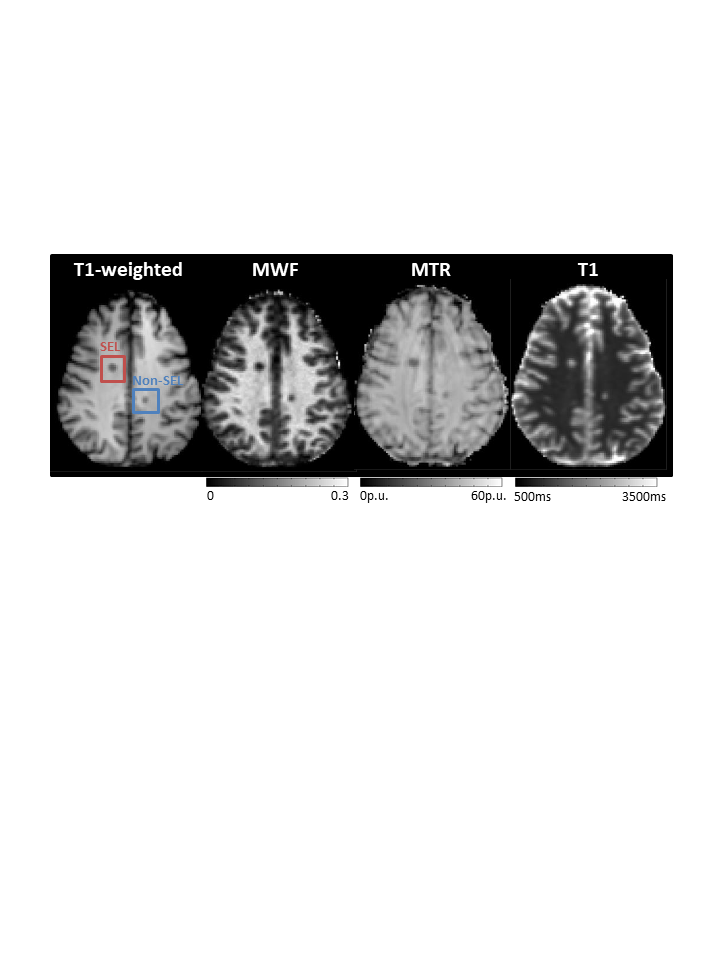
From mcDESPOT, MWF and T1 maps were derived4. SELs were derived from conventional T1-weighted and T2-weighted images using all timepoints from baseline to Week 961. Non-SELs were defined as all pre-existing T2 lesions not identified as SELs. Mean mcDESPOT myelin water fraction (MWF), magnetisation transfer ratio (MTR) and T1 relaxation time were extracted in SELs and non-SELs at each timepoint (Figure 1) up to Week 192. A Wilcoxon signed-rank test was used to compare baseline Non-SEL and SEL measures in the cohort with SELs. MR data was fit to mixed effects models to account for repeated measures over time on each subject and to handle incomplete data from missing time points. The visit week and lesion type (Non-SEL or SEL) were kept as fixed effects while the subject was set as a random effect to account for individual variability. An interaction effect between week and lesion type was included and the Tukey method used to adjust for post-hoc multiple comparisons. Differences in treatment were not included in this preliminary analysis.
Results
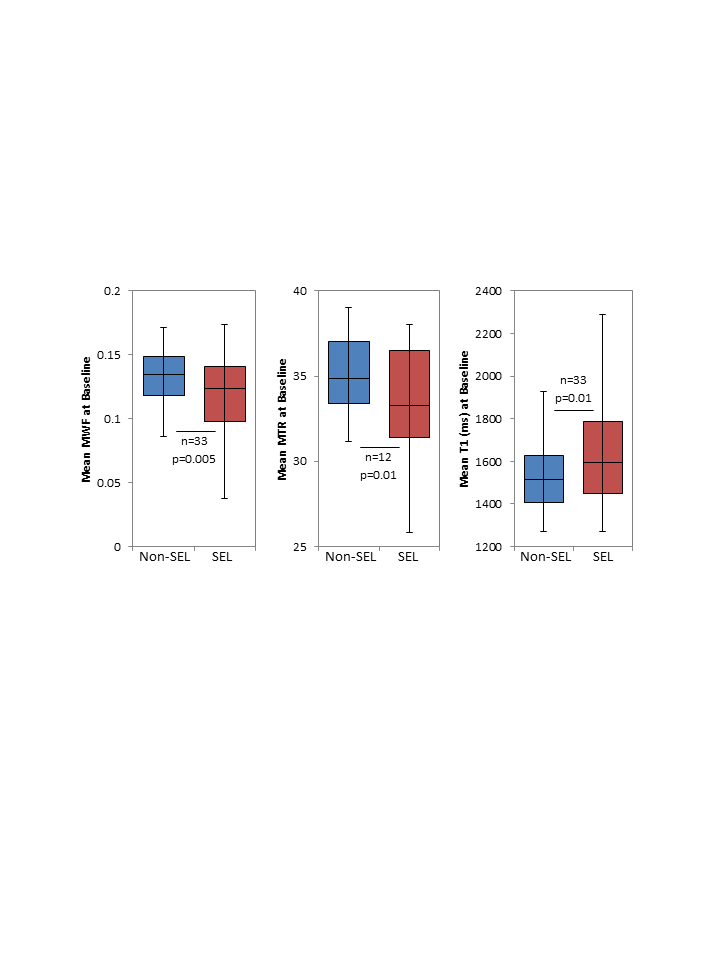
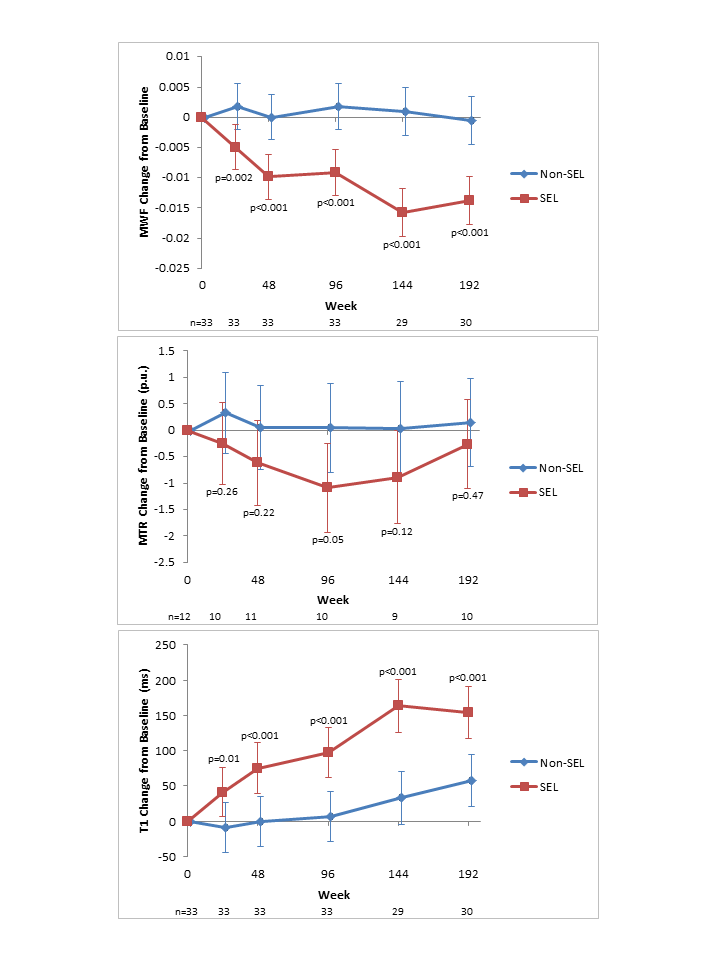
SELs were found in 33/50 patients (mean number of SELs per patient: 2.7±3.6), comprising 2.9±3.7% of the total T2 lesion volume. At baseline, SELs were characterised by lower myelin (MWF and MTR) and higher water content (T1) measures than non-SELs (Figure 2). Over time, compared with non-SELs, SELs showed a greater decrease in MWF and MTR, and a larger increase in T1 (Figure 3). Non-SELs did not show a significant change in MWF or MTR or T1 over time (Figure 4). MWF in SELs decreased over the first 48 weeks (p=0.03 from baseline) but then remained constant at this lower value. MTR in SELs showed no significant change over time. T1 in SELs decreased over the first 96 weeks (p=0.02 from baseline) and then showed insignificant increases for the following 96 weeks (p=0.4 from week 96) (Figure 4).Discussion
SELs showed reduced myelin measures at baseline and subsequent time points compared to non-SELs. Furthermore, over the course of 4 years, only SELs and not non-SELs showed a mean decrease in MWF and an increase in T1. Both results are indicative of progressive demyelination in this subset of chronic lesions.Conclusion
Slowly evolving lesions detected over 2 years showed lower myelin content and a higher degree of myelin loss than non-SELs over 4 years.Acknowledgements
We would like to thank the MS volunteers and the staff at the UBC MRI Research Centre and UBC MS Clinic. This study was sponsored by F. Hoffmann-La Roche Ltd. I Vavasour has nothing to disclose. C Elliott is an employee of NeuroRx Research. D Arnold has received consulting fees from Alkermes, Biogen, Celgene, Genentech/Roche, Frequency Therapeutics, Immmunotec, Immune Tolerance Network, MedDay, Merck-Serono, Novartis, Pfizer, and Sanofi-Aventis. He has carried out contracted research for Novartis and Biogen. L Gaetano, D Clayton, S Magon, U Bonati and W Wei are employees and shareholders of F. Hoffmann-La Roche Ltd. A Traboulsee has received research support from Sanofi Genzyme and Roche; has received consulting fees from Sanofi Genzyme, Roche, Teva Neuroscience, Novartis, Biogen and EMD Serono; and has received honoraria for his involvement in speaker bureau activities for Sanofi Genzyme and Roche. S Kolind has received research support from Biogen, Roche and Sanofi Genzyme and consulting fees from Novartis and Roche.References
1. Elliott C, et al. Brain 2019;142:2787–2799.
2. Dal-Bianco A, Grabner G, Kronnerwetter C, et al. Slow expansion of multiple sclerosis iron rim lesions: Pathology and 7 T magnetic resonance imaging. Acta Neuropathol 2017; 133: 25–42.
3. Frischer JM, Bramow S, Dal-Bianco A, et al. The relation between inflammation and neurodegeneration in multiple sclerosis brains. Brain 2009; 132: 1175–1189.
4. Deoni SCL, et al. Magn Reson Med 2008;60:1372–1387.
Figures