0891
Multi-Component T2 Characterization of Lesions in Pediatric Onset Multiple Sclerosis1Radiology, Boston Children's Hospital, Boston, MA, United States, 2Harvard Medical School, Boston, MA, United States, 3Neurology, Boston Children's Hospital, Boston, MA, United States
Synopsis
This study evaluated myelin water fraction (MWF) estimates in chronic MS lesions against contralateral normal appearing white matter (NAWM) of pediatric onset MS patients (POMS). Accelerated 2D multi-slice CPMG acquisitions provided near full brain coverage. Two methods were used to estimate the myelin fractions, as well as intra-/extra- axonal (IE) associated water and CSF water. Significant differences were found between the group measures. Further comparison of NAWM in POMS showed significant differences with whole-white matter in a control group. Our results support that a multi-component T2 analysis can provide quantitative insights into lesional and non-lesional disease burden in POMS.
Introduction
Clinical assessment of chronic disease burden in multiple sclerosis (MS) patients involves evaluation of lesions on FLAIR based acquisitions via the MacDonald criteria1. This assessment does not take into account the magnitude of myelin loss or remaining axonal tissue within lesions or subtle involvement of areas of normal appearing white matter (NAWM) on FLAIR. Pediatric onset multiple sclerosis (POMS) is characterized by relapses that occur two to three times more frequently than in adults with early multiple sclerosis2. There is a need for more sensitive measures of disease progression. Multi-component T2 relaxometry3 is a promising tool for a quantitative assessment of myelin content/integrity in POMS patients based on the measure of MWF changes in the tissue. Routine whole brain estimation of MWF maps is challenging due to the time constraints posed by single slice CPMG sequences, which correlate well with histology4. Substantially accelerated scanning is feasible with 2D multi-slice CPMG sequences, albeit with decreased signal to noise ratios, which may prove difficult for voxelwise NNLS based estimation methods. The purpose of this study was to (1) evaluate differences in MWF between chronic MS lesions detected on FLAIR sequences and contralateral NAWM in POMS subjects and (2) evaluate differences in MWF between NAWM of affected subjects and age- and gender- matched controls.Materials and Methods
We performed an IRB approved and HIPAA compliant study. 10 POMS patients that met 2017 Macdonald criteria for relapsing and remitting MS (RRMS) were prospectively recruited. One patient was removed from the study due to excessive motion. The control group included 9 healthy volunteers.The data were acquired on a 3D Siemens Skyra scanner with the following sequences: a) T1-weighted MPRAGE (220x220 matrix, 176 slices, 1x1x1 mm3 resolution, 2.27ms TE, 1100ms T1, 2000ms TR) b) 3D T2-weighted (256x256 matrix, 160 slices, 0.99 mm thickness, 3200ms TR, 441m TE) c) 3D T2W FLAIR (256x256 matrix, 160 slices, 0.9mm thickness, 5000ms TR, 393ms TE, 1800ms TI) d) 2D multi-echo CPMG sequence5 with 32 echoes with an echo spacing of 10ms, 1x1x4mm resolution acquired in 9 minutes with ⅝ PF and in-plane GRAPPA with an acceleration factor of 2. TR was set as 2000ms and 4 concatenations were used to limit magnetization transfer effects.
Two distinct parameter estimation methods were used 1) NNLS based estimation of the T2 distribution in the presence of stimulated echoes using a 40 component model6 (Method 1) . MWF estimation in Method 1 is given for the cutoff value of 51ms on the 40 component T2 distribution plot. 2) Multi-compartment probability distribution model of T2 values. This model uses a mixture of three Gamma distributions for which the mixture fraction parameters are estimated directly based on a variable projection optimization technique7, and which correspond to myelin water, intra-/extra- axonal water and CSF water respectively (Method 2).
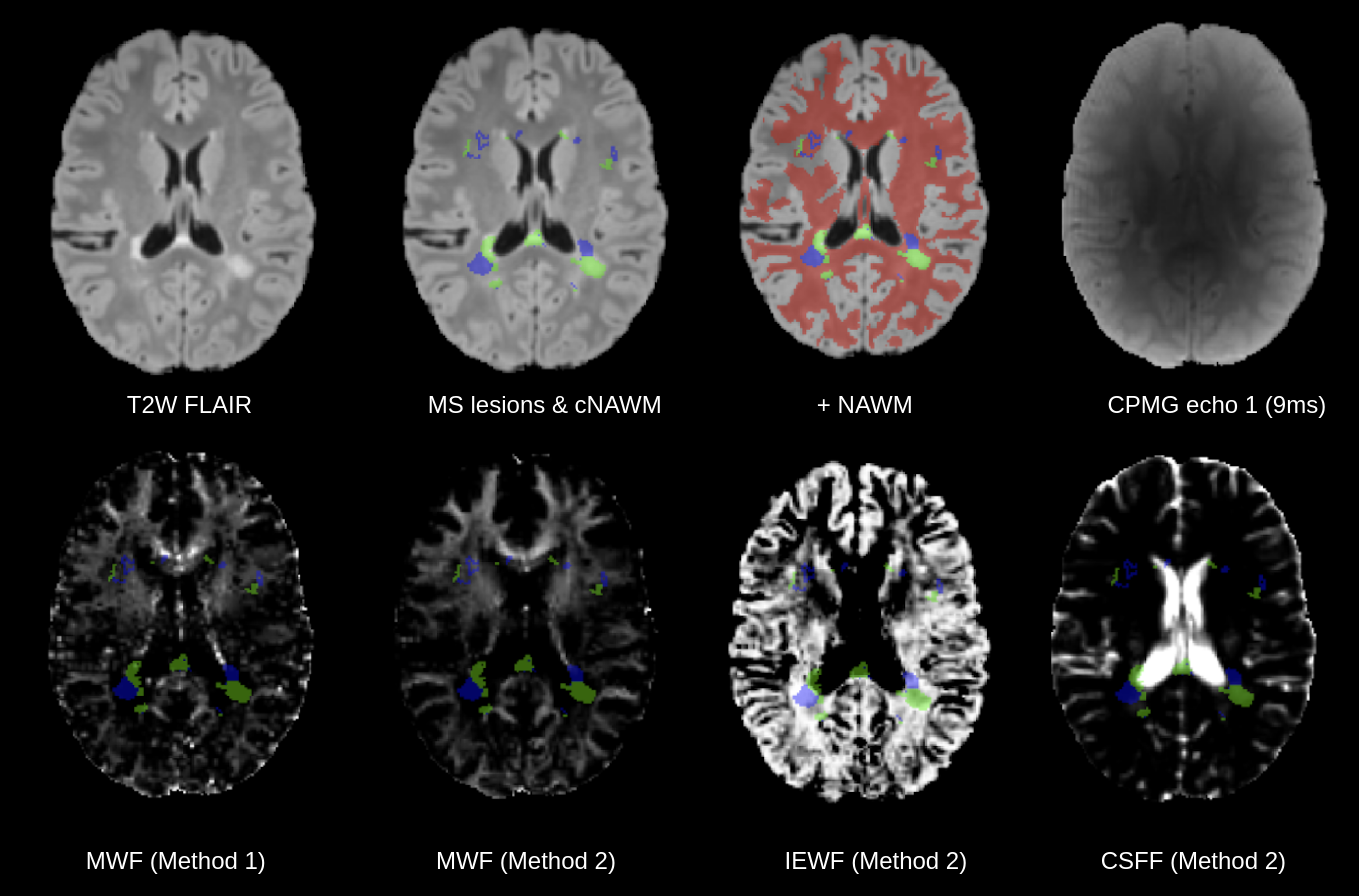
T2 hyperintense WM lesions were segmented by a trained physician on a T2-weighted FLAIR acquisition and reviewed by an experienced board certified neuroradiologist. Contralateral NAWM of each lesion was computed using a linear transform that mirrors the lesions in the anatomical space (Figure 1). Additionally, a whole brain tissue segmentation was obtained using the STAPLE algorithm8 by combining T1W and T2W images. CPMG data was registered and resampled to the T1W image. Statistical comparisons were performed using Mann-Whitney U test. Neuroanatomical data of control subjects was reviewed by a neuroradiologist to ensure normality; a whole-white matter mask was utilized.
Results
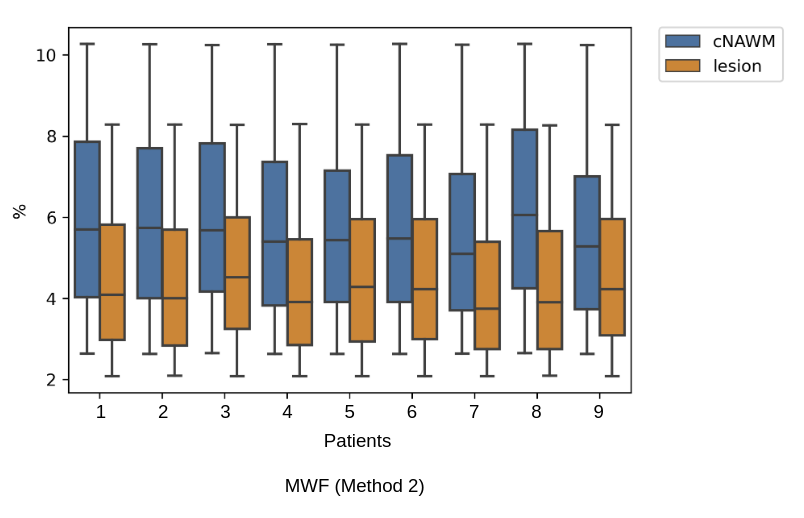
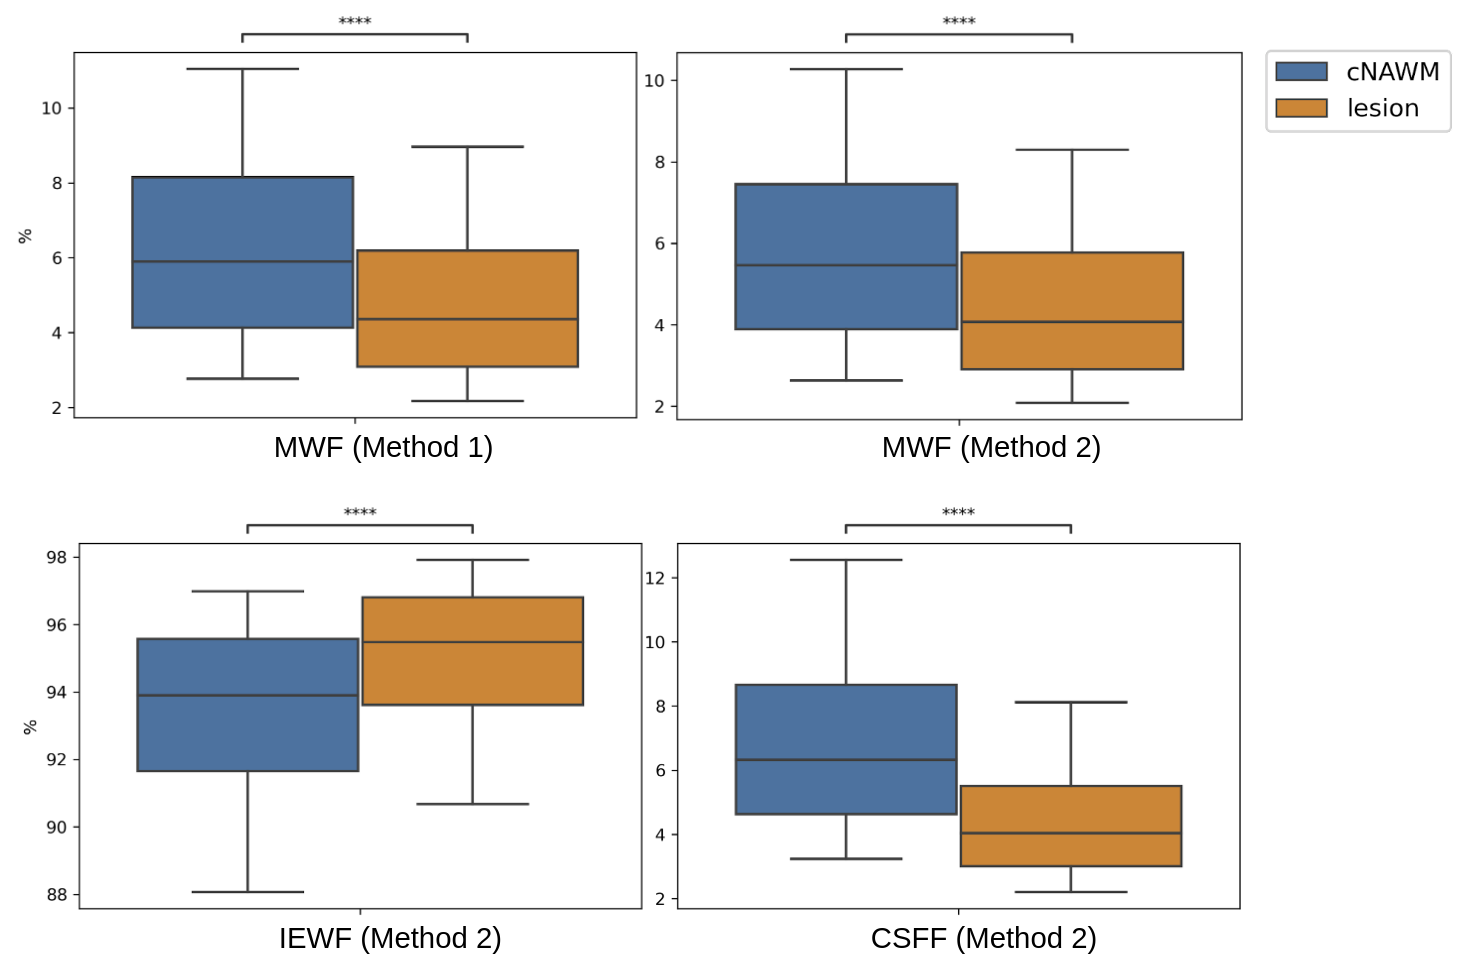
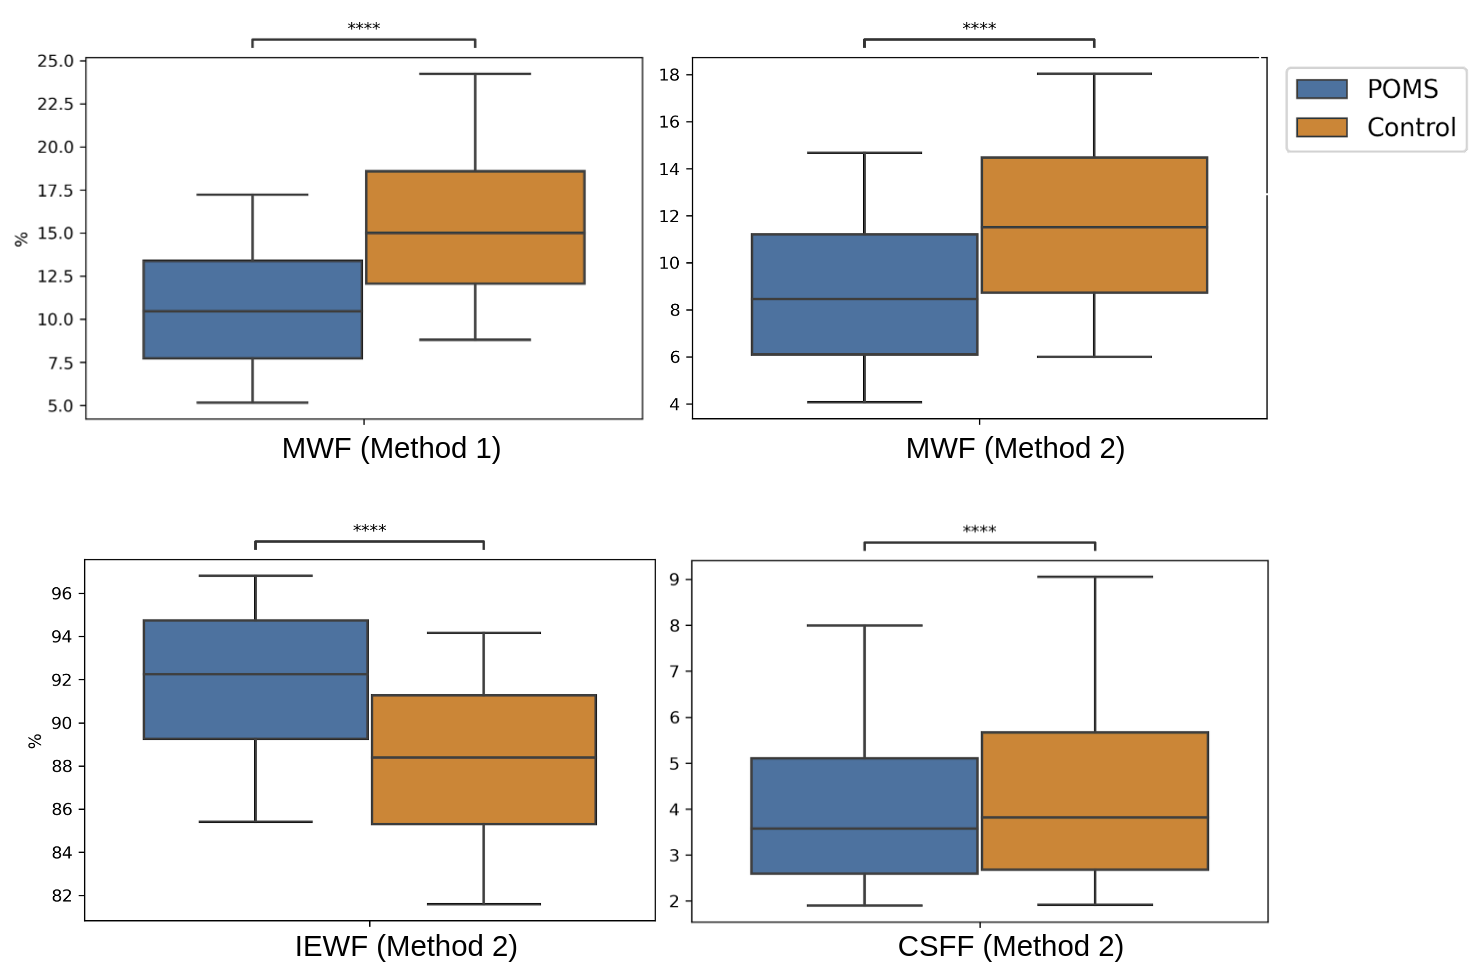
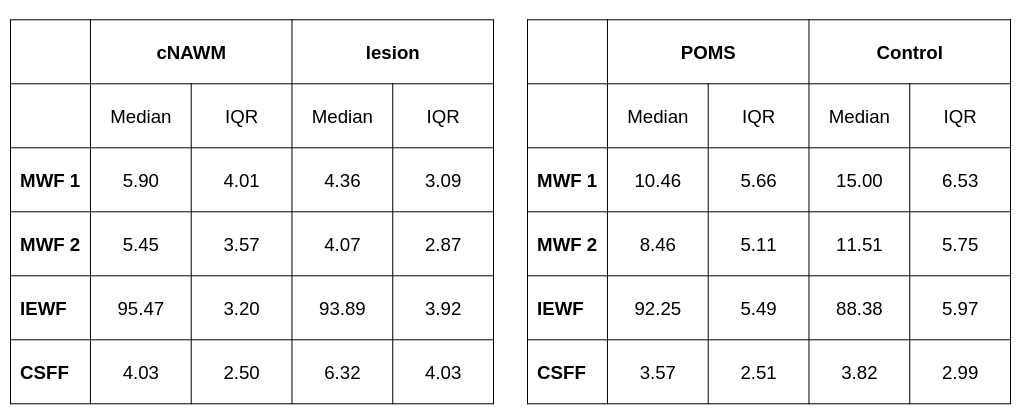
Myelin, IE and CSF fraction maps estimated with Method 2 are shown on the overlap of segmentations of MS lesions and contralateral NAWM in POMS patients (Figure 1), as well as MWF for Method 1. Lesion MWF values were lower than contralateral NAWM overall (Figure 3). The trend is consistent for each subject individually (Figure 2). We note that each method yielded different absolute values, however the significance was consistent. IE fractions were higher for MS lesions, and conversely, lesion CSF fractions were lower than contralateral NAWM. Median and IQR measures are given in Figure 5. An overall measure of the entire NAWM across all POMS patients is made against the whole-white matter of the patients in the control group (Figure 4).Discussion
Our analysis shows differences in multi-component T2 distribution measures of MWF between MS lesions and contralateral NAWM in POMS patients, and between NAWM of patients and WM of controls, for both competing methods. The values reported for Method 1, which is widely used as reference, are in accordance with previously published literature3,4. The decrease in water fraction for myelin may reflect the damage to myelin sheaths and complex interstitial relationships that ensue following injury. Similarly, this supports the evidence shown that the IE based water increases at the same time. Our results also provide evidence of a more widespread, low-grade, and subclinical (by FLAIR) myelin loss in POMS subjects relative to control subjects.MWF is a promising tool in the evaluation of disease burden in POMS; the ability to capture the heterogeneous imaging phenotype of chronic MS lesions and to detect subclinical changes in NAWM could improve our ability to monitor treatment response, disease progression, and to identify biological substrates of disability.
Acknowledgements
This work was partially supported by the National Institutes of Health (R01EB019483, R21DK123569, R21EB029627), National Multiple Sclerosis Society (PP‐1905‐34002), United States‐Israel Binational Science Foundation (BSF) (2019056), Society of Pediatric Radiology Multi‐center Research Grant 2019 and Boston Children’s Hospital Translational Research Program Pilot Grant 2018.
References
1. Thompson, A.J., Banwell, B.L., Barkhof, F., Carroll, W.M., Coetzee, T., Comi, G., Correale, J., Fazekas, F., Filippi, M., Freedman, M.S. and Fujihara, K., 2018. Diagnosis of multiple sclerosis: 2017 revisions of the McDonald criteria. The Lancet Neurology, 17(2), pp.162-173.
2. Gorman, M.P., Healy, B.C., Polgar-Turcsanyi, M. and Chitnis, T., 2009. Increased relapse rate in pediatric-onset compared with adult-onset multiple sclerosis. Archives of neurology, 66(1), pp.54-59.
3. Laule, C., Vavasour, I.M., Moore, G.R.W., Oger, J., Li, D.K., Paty, D.W. and MacKay, A.L., 2004. Water content and myelin water fraction in multiple sclerosis. Journal of neurology, 251(3), pp.284-293.
4. Laule, C., Leung, E., Li, D.K., Traboulsee, A.L., Paty, D.W., MacKay, A.L. and Moore, G.R., 2006. Myelin water imaging in multiple sclerosis: quantitative correlations with histopathology. Multiple Sclerosis Journal, 12(6), pp.747-753.
5. Akhondi‐Asl, A., Afacan, O., Balasubramanian, M., Mulkern, R.V. and Warfield, S.K., 2016. Fast myelin water fraction estimation using 2D multislice CPMG. Magnetic resonance in medicine, 76(4), pp.1301-1313
6. Prasloski, T., Mädler, B., Xiang, Q.S., MacKay, A. and Jones, C., 2012. Applications of stimulated echo correction to multicomponent T2 analysis. Magnetic resonance in medicine, 67(6), pp.1803-1814
7. Chatterjee, S., Commowick, O., Afacan, O., Warfield, S.K. and Barillot, C., 2018, April. Multi-compartment model of brain tissues from T2 relaxometry MRI using gamma distribution. In 2018 IEEE 15th International Symposium on Biomedical Imaging (ISBI 2018) (pp. 141-144). IEEE
8. Warfield, S.K., Zou, K.H. and Wells, W.M., 2004. Simultaneous truth and performance level estimation (STAPLE): an algorithm for the validation of image segmentation. IEEE transactions on medical imaging, 23(7), pp.903-921
Figures