0890
Comparing myelin-sensitive markers MWF, ihMTR, and MTsat in healthy and normal-appearing brain tissue and multiple sclerosis lesions
Ronja C. Berg1, Viola Pongratz2, Markus Lauerer2, Thomas Amthor3, Guillaume Gilbert4, Aurore Menegaux1, Claus Zimmer1, Christian Sorg1, Mariya Doneva3, Irene Vavasour5, Mark Mühlau2, and Christine Preibisch1
1Department of Neuroradiology, School of Medicine, Technical University of Munich, Munich, Germany, 2Department of Neurology, School of Medicine, Technical University of Munich, Munich, Germany, 3Philips Research Europe, Hamburg, Germany, 4MR Clinical Science, Philips Healthcare, Mississauga, ON, Canada, 5Department of Radiology, University of British Columbia, Vancouver, BC, Canada
1Department of Neuroradiology, School of Medicine, Technical University of Munich, Munich, Germany, 2Department of Neurology, School of Medicine, Technical University of Munich, Munich, Germany, 3Philips Research Europe, Hamburg, Germany, 4MR Clinical Science, Philips Healthcare, Mississauga, ON, Canada, 5Department of Radiology, University of British Columbia, Vancouver, BC, Canada
Synopsis
Measurement of myelin concentration could provide valuable information on the integrity of brain tissue. Several myelin-sensitive magnetic resonance imaging methods have been developed. Here, we compared myelin water fraction (MWF), inhomogeneous magnetization transfer ratio (ihMTR) and magnetization transfer saturation (MTsat) in healthy volunteers and patients with multiple sclerosis (MS). We found highest correlation between MWF and ihMTR but all three measures showed clearly reduced values in MS lesions compared to healthy or normal-appearing white matter. However, the measures varied in differentiating between various WM regions and between peri-lesional tissue and more distant normal-appearing WM.
Introduction
Myelin is an important constituent of the nervous system, insulating nerve fibers and enabling fast signal propagation. Measuring the distribution of myelin is thought to improve evaluation and monitoring of demyelinating diseases such as multiple sclerosis (MS)1. Over the last few years, various myelin-sensitive magnetic resonance imaging (MRI) measures have been developed and investigated2. The most established method is myelin water imaging (MWI), measuring the fraction of quickly decaying water signal (MWF) suggested to arise from water trapped between myelin sheaths3. Other methods exploit the magnetization transfer (MT) effect4. Two MT variants are MT saturation (MTsat), determining the signal decline induced by a single MT saturation pulse5, and inhomogeneous MT (ihMT) exploiting the dipolar order relaxation time associated with myelinated structures (ihMTR)6. Each of the contrasts has been found to correlate with myelin concentration1,6-9 and they have been compared in healthy volunteers10-12. Here, we performed such a comparison in pathology and evaluated the three measures in normal-appearing and lesion tissue of MS patients and healthy volunteers.Methods
Five healthy volunteers (aged 32±3y, 3f/2m) and five MS patients (aged 33±6y, 2f/3m; 4 relapsing-remitting MS, 1 clinically isolated syndrome; disease duration: 3-15y, mean=9.4y; expanded disability status scale: 0-1.5, mean=1.1) were scanned on a Philips 3T Ingenia Elition using a 32-channel head coil. All imaging and processing details are summarized in Fig.1. MWI was acquired using a 3D-GRASE sequence with 48 echoes and MWF was calculated with the Sparsity Promoting Iterative Joint Non-negative least squares (SPIJN) algorithm13 including phase data. For ihMT, 3D gradient-echo data with three echoes and ten sinc-gauss-shaped MT pulses were acquired and used for ihMTR calculation6. For MTsat, three 3D multi-echo gradient-echo data sets and a B1-map were acquired and evaluated by the hMRI-toolbox14-15. MWF, ihMTR, and MTsat maps were co-registered to the MPRAGE using 4th-degree spline interpolation.In MS patients, MPRAGE and FLAIR were used for lesion segmentation via the lesion growth algorithm16 from the lesion segmentation tool17 for SPM1218. Lesions were defined as regions with lesion probabilities >0.5 and the peri-lesional tissue (‘Peri-Lesion’) as a 3-voxel wide shell surrounding lesions within white matter (WM). Whole-brain gray matter (GM) and WM masks were segmented from MPRAGE data using SPM12’s segment module thresholded at tissue probability >0.5. Additionally, several WM tracts from the JHU DTI-based white-matter atlas19-20 were combined into five MW regions (corpus callosum, internal capsule, corona radiata, external capsule, and cingulum). All volumes-of-interest (VOIs) were co-registered to the subjects’ individual MPRAGE data using either SPM12’s co-register (whole-brain GM, WM, and lesion masks) or normalize module (JHU VOIs). Lesion-voxels were excluded from all other VOIs. All evaluations were performed in the subjects’ native spaces.
Results
MWF, ihMTR, and MTsat maps appeared visually similar with low values in GM and higher values in WM (Fig.2). Generally, all three parameter maps appeared darker in lesions, but some differences could be seen in the representation of individual lesions between different myelin-sensitive measures (Fig.2). Across WM, MWF values varied most strongly, while MTsat appeared most homogeneous, which is obvious in parameter maps (Fig.2) and VOI-average quantitative evaluations (Fig.3). Within MS lesions, average MTsat values were strongly reduced compared to WM and rather comparable to GM values. For MWF and ihMTR, differences between lesion and WM values were less prominent but clearly discernable (Fig.3). For some VOIs, reduced MWF and ihMTR could be spotted in normal-appearing tissues of MS patients compared to healthy volunteers (Fig.3A&B). The pooled standard deviation of myelin-sensitive measures within different VOIs (averaged across participants) was highest for MWF and lowest for MTsat, and often lower for normal-appearing than for healthy tissue (Fig.4). Highest correlation between VOI-average myelin marker values in WM was found between MWF and ihMTR, and lowest correlation between MWF and MTsat (Fig.5).Discussion
The overall image impression and the GM-WM contrast of the investigated myelin-sensitive measures was similar (Fig.2). Quantitative MWF and ihMT values in healthy tissue compared well with literature3,6-7,11, while absolute MTsat values depend on several imaging parameters21. In some WM VOIs, MWF and ihMTR values were slightly lower in MS patients than in healthy controls, which is in accordance with previous studies6,22-24. In line with literature, MWF22,25-26, ihMTR7,23-24, and MTsat27-29 were clearly reduced in lesion tissue compared to normal-appearing WM. The largest difference between lesion and peri-lesional tissue was observed for MTsat (Fig.3C), which has previously shown a high sensitivity to disease-related tissue damage27. The lowest correlation for healthy WM was found between MWF and MTsat (Fig.5B), confirming our previous results12. This finding is not surprising since MWF and MTsat rely on different contrast mechanisms. In this respect, comparisons with gold standard histology investigating sensitivity and specificity of different MRI contrasts to myelin2 are urgently needed to disentangle microstructural effects on MR signal and evaluate the validity of each myelin-sensitive measure. Additionally, future studies should investigate the appearance of various lesions types in different myelin-sensitive MRI contrasts.Conclusion
While each of the investigated myelin-sensitive measures could differentiate well between healthy (appearing) WM and MS lesions, their combined use could be promising for disentangling more subtle structural differences, e.g., between different WM structures (MWF) or between peri-lesional and more distant normal-appearing WM (MTsat).Acknowledgements
Ronja Berg was supported by a PhD grant from the Friedrich-Ebert-Stiftung.References
- Laule, C., Leung, E., Li, D. K., Traboulsee, A. L., Paty, D. W., MacKay, A. L., & Moore, G. R. (2006). Myelin water imaging in multiple sclerosis: quantitative correlations with histopathology. Multiple Sclerosis Journal, 12(6), 747-753.
- Mancini, M., Karakuzu, A., Cohen-Adad, J., Cercignani, M., Nichols, T. E., & Stikov, N. (2020). An interactive meta-analysis of MRI biomarkers of myelin. Elife, 9, e61523.
- MacKay, A., Laule, C., Vavasour, I., Bjarnason, T., Kolind, S., & Mädler, B. (2006). Insights into brain microstructure from the T2 distribution. Magnetic resonance imaging, 24(4), 515-525.
- Wolff, S. D., & Balaban, R. S. (1989). Magnetization transfer contrast (MTC) and tissue water proton relaxation in vivo. Magnetic resonance in medicine, 10(1), 135-144.
- Helms, G., & Piringer, A. (2005). Simultaneous measurement of saturation and relaxation in human brain by repetitive magnetization transfer pulses. NMR in Biomedicine: An International Journal Devoted to the Development and Application of Magnetic Resonance In vivo, 18(1), 44-50.
- Van Obberghen, E., Mchinda, S., Le Troter, A., Prevost, V. H., Viout, P., Guye, M., ... & Girard, O. (2018). Evaluation of the sensitivity of Inhomogeneous Magnetization Transfer (ihMT) MRI for multiple sclerosis. American Journal of Neuroradiology, 39(4), 634-641.
- MacKay, A. L., & Laule, C. (2016). Magnetic resonance of myelin water: an in vivo marker for myelin. Brain Plasticity, 2(1), 71-91.
- Callaghan, M. F., Freund, P., Draganski, B., Anderson, E., Cappelletti, M., Chowdhury, R., ... & Lutti, A. (2014). Widespread age-related differences in the human brain microstructure revealed by quantitative magnetic resonance imaging. Neurobiology of aging, 35(8), 1862-1872.
- Duhamel, G., Prevost, V. H., Cayre, M., Hertanu, A., Mchinda, S., Carvalho, V. N., ... & Girard, O. M. (2019). Validating the sensitivity of inhomogeneous magnetization transfer (ihMT) MRI to myelin with fluorescence microscopy. NeuroImage, 199, 289-303.
- Vavasour, I., Smolina, A., MacMillan, E., Gilbert, G., Lam, M., Kozlowski, P., … & Alex MacKay (2018). Comparison of Inhomogeneous Magnetization Transfer (ihMT) and Myelin Water Fraction (MWF) In-Vivo at 3T. ISMRM 2018, Abstract #5487.
- Ercan, E., Varma, G., Mädler, B., Dimitrov, I. E., Pinho, M. C., Xi, Y., ... & Lenkinski, R. E. (2018). Microstructural correlates of 3D steady‐state inhomogeneous magnetization transfer (ihMT) in the human brain white matter assessed by myelin water imaging and diffusion tensor imaging. Magnetic resonance in medicine, 80(6), 2402-2414.
- Berg, R., Menegaux, A., Gilbert, G., Zimmer, C., Sorg, C., Vavasour, I., & Preibisch, C. (2020). Towards advanced microstructural analyses of white matter: Quantitative regional comparison of different myelin measures. ISMRM 2020, Abstract #0046.
- Nagtegaal, M., Koken, P., Amthor, T., de Bresser, J., Mädler, B., Vos, F., & Doneva, M. (2020). Myelin water imaging from multi-echo T2 MR relaxometry data using a joint sparsity constraint. NeuroImage, 219, 117014.
- Tabelow, K., Balteau, E., Ashburner, J., Callaghan, M. F., Draganski, B., Helms, G., ... & Reimer, E. (2019). hMRI–A toolbox for quantitative MRI in neuroscience and clinical research. Neuroimage, 194, 191-210.
- Weiskopf, N., Mohammadi, S., Lutti, A., & Callaghan, M. F. (2015). Advances in MRI-based computational neuroanatomy: from morphometry to in-vivo histology. Current opinion in neurology, 28(4), 313-322.
- Schmidt, P., Gaser, C., Arsic, M., Buck, D., Förschler, A., Berthele, A., ... & Mühlau, M. (2012). An automated tool for detection of FLAIR-hyperintense white-matter lesions in multiple sclerosis. Neuroimage, 59(4), 3774-3783.
- Lesion Segmentation Tool for SPM https://www.applied-statistics.de/lst.html
- Statistical Parametric Mapping www.fil.ion.ucl.ac.uk/spm
- JHU DTI-based white-matter atlases https://identifiers.org/neurovault.collection:264
- Mori, S., Wakana, S., Van Zijl, P. C., & Nagae-Poetscher, L. M. (2005). MRI atlas of human white matter. Elsevier, Amsterdam, The Netherlands (2005).
- Teixeira, R. P. A. G., Malik, S. J., & Hajnal, J. V. (2019). Fast quantitative MRI using controlled saturation magnetization transfer. Magnetic resonance in medicine, 81(2), 907-920.
- Laule, C., Vavasour, I. M., Moore, G. R. W., Oger, J., Li, D. K., Paty, D. W., & MacKay, A. L. (2004). Water content and myelin water fraction in multiple sclerosis. Journal of neurology, 251(3), 284-293.
- Zhang, L., Wen, B., Chen, T., Tian, H., Xue, H., Ren, H., ... & Ren, Z. (2020). A comparison study of inhomogeneous magnetization transfer (ihMT) and magnetization transfer (MT) in multiple sclerosis based on whole brain acquisition at 3.0 T. Magnetic resonance imaging, 70, 43-49.
- Rasoanandrianina, H., Demortière, S., Trabelsi, A., Ranjeva, J. P., Girard, O., Duhamel, G., ... & Callot, V. (2020). Sensitivity of the Inhomogeneous Magnetization Transfer Imaging Technique to Spinal Cord Damage in Multiple Sclerosis. American Journal of Neuroradiology, 41(5), 929-937.
- Vavasour, I. M., Whittall, K. P., Mackay, A. L., Li, D. K., Vorobeychik, G., & Paty, D. W. (1998). A comparison between magnetization transfer ratios and myelin water percentages in normals and multiple sclerosis patients. Magnetic resonance in medicine, 40(5), 763-768.
- Mackay, A., Whittall, K., Adler, J., Li, D., Paty, D., & Graeb, D. (1994). In vivo visualization of myelin water in brain by magnetic resonance. Magnetic resonance in medicine, 31(6), 673-677.
- Lema, A., Bishop, C., Malik, O., Mattoscio, M., Ali, R., Nicholas, R., ... & Newbould, R. D. (2017). A comparison of magnetization transfer methods to assess brain and cervical cord microstructure in multiple sclerosis. Journal of Neuroimaging, 27(2), 221-226.
- Lommers, E., Simon, J., Reuter, G., Delrue, G., Dive, D., Degueldre, C., ... & Maquet, P. (2019). Multiparameter MRI quantification of microstructural tissue alterations in multiple sclerosis. NeuroImage: Clinical, 23, 101879.
- Saccenti, L., Hagiwara, A., Andica, C., Yokoyama, K., Fujita, S., Kato, S., ... & Aoki, S. (2020). Myelin measurement using quantitative magnetic resonance imaging: a correlation study comparing various imaging techniques in patients with multiple sclerosis. Cells, 9(2), 393.
Figures
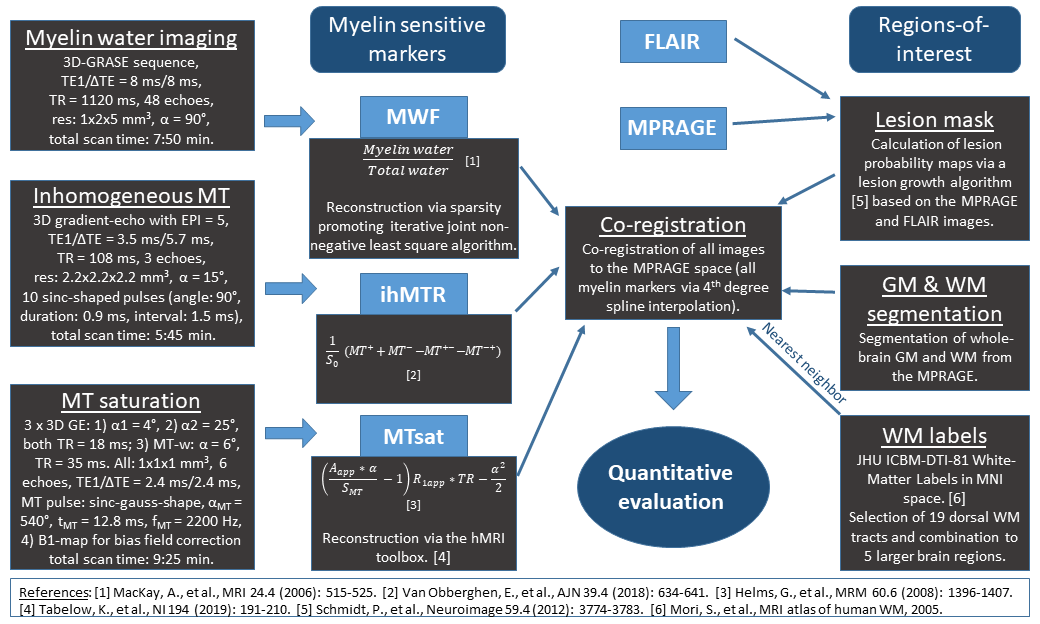
Figure
1: Overview of acquisition protocols, derived parameters, and processing. MRI
comprised myelin water imaging (MWI), inhomogeneous MT (ihMT), MT saturation
(MTsat), FLAIR, and MPRAGE.
Parameter maps were calculated using toolboxes as referenced. Lesion masks were
segmented from MPRAGE and FLAIR, whole-brain GM and WM from MPRAGE. Maps of
MWF, ihMTR, MTsat and 19 dorsal WM segments from the JHU ICBM-DTI WM labels atlas
(combined to 5 brain regions) were co-registered to the MPRAGE for quantitative
VOI analysis.
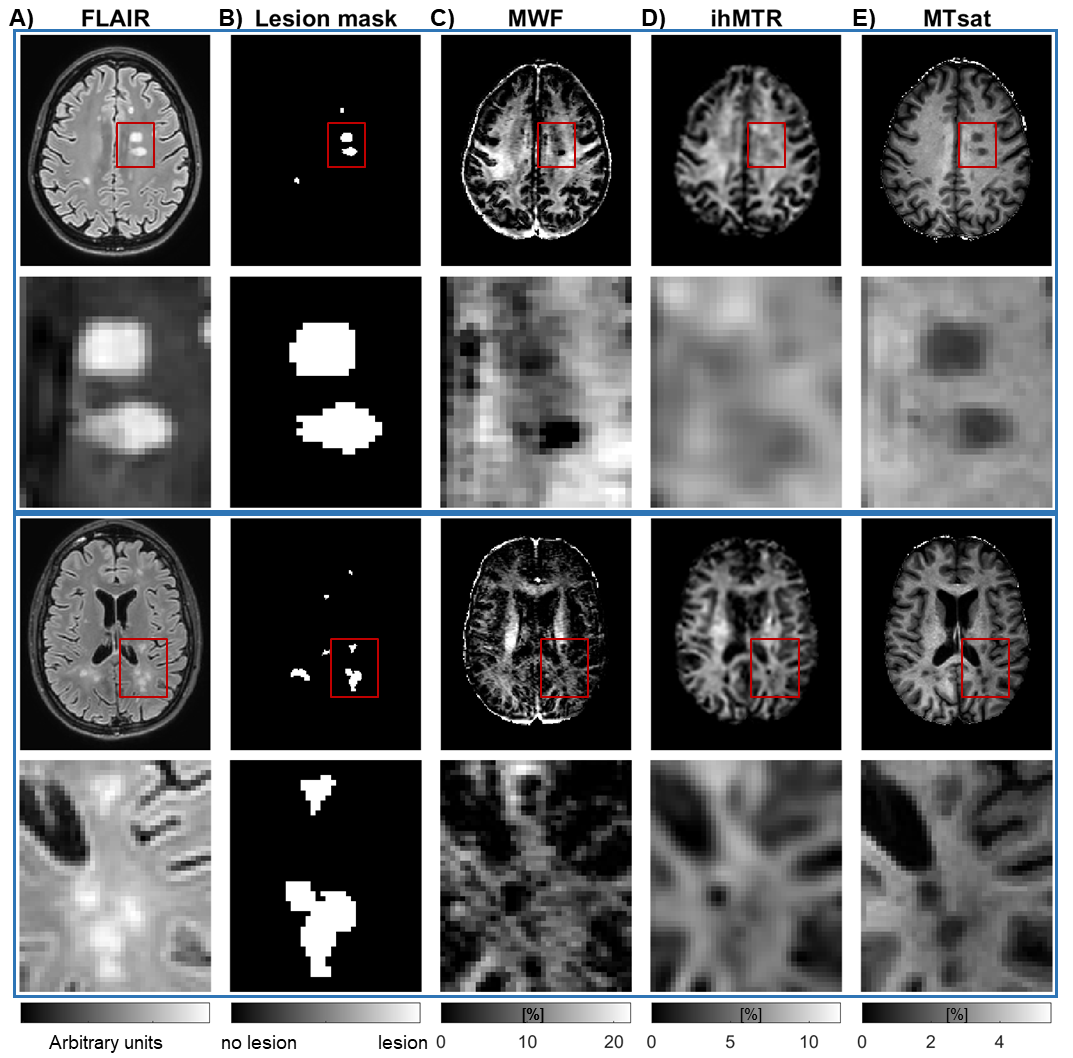
Figure 2: Exemplary slices of FLAIR (A), lesion segmentations (B), and
maps of myelin-sensitive markers (C-E) from two different MS patients including
zoomed-in regions. Myelin-sensitive
markers include myelin water fraction (MWF) (C), inhomogeneous magnetization
transfer ratio (ihMTR) (D), and MT saturation (MTsat) (E). Red rectangles in
the first and third rows indicate the location of the zoomed-in regions in the
second and last rows.
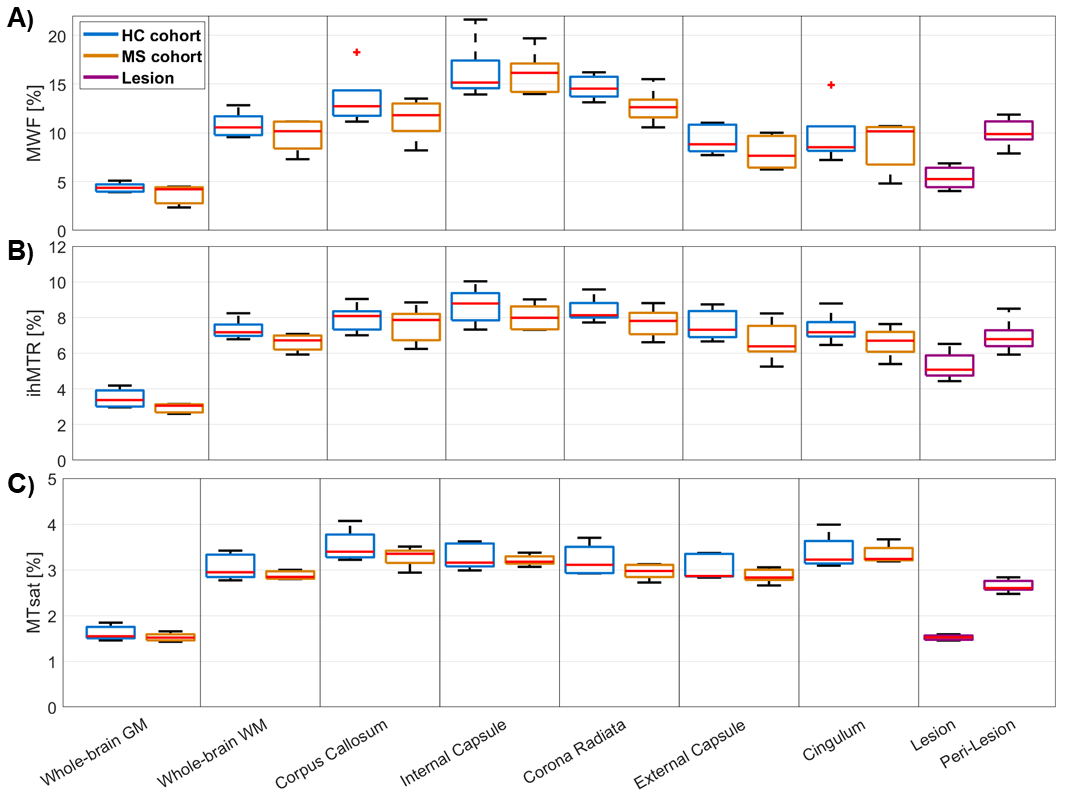
Figure
3: Boxplots of VOI-average MWF (A), ihMTR (B), and MTsat (C) for different brain
tissue types and regions. Each boxplot contains five VOI-average values
either from five healthy volunteers (blue) or from five MS patients in
normal-appearing tissue (orange), in lesions (purple), or in peri-lesional
normal-appearing white matter (purple). Red lines indicate the median of mean
values, boxes (25th and 75th percentiles) and whiskers indicate standard
deviation across participants.
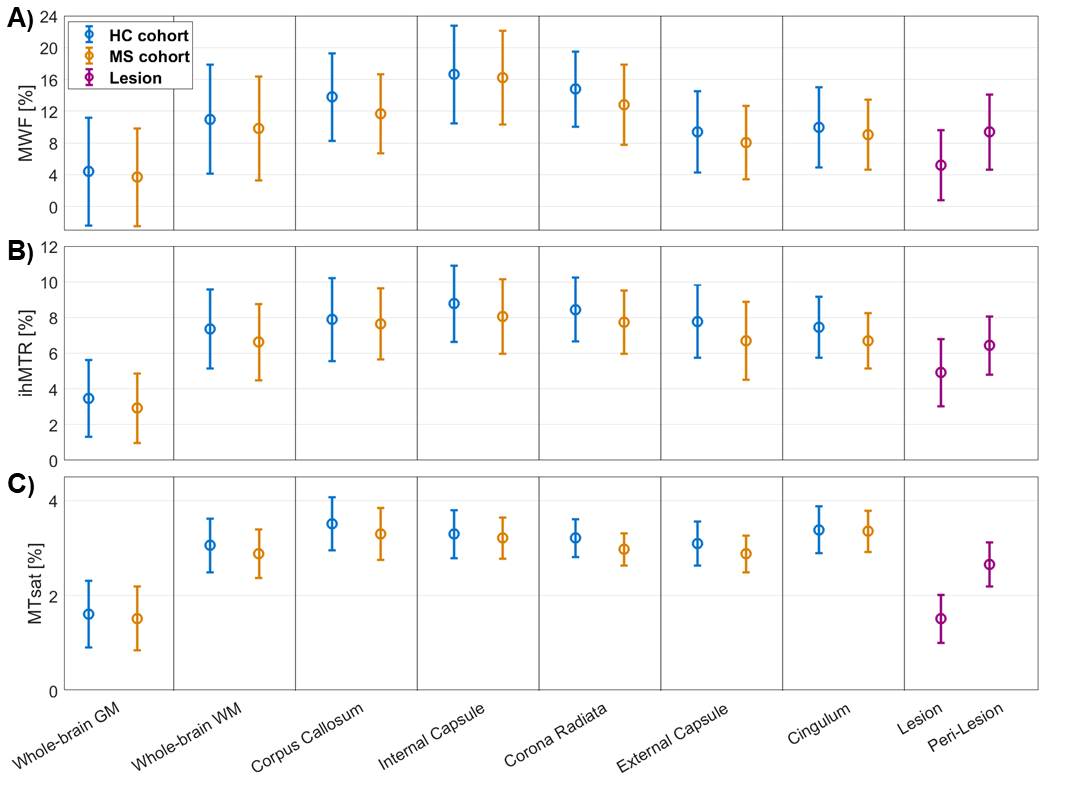
Figure
4: Pooled means and pooled standard deviations of MWF (A), ihMTR (B), and MTsat
(C) for different tissue types or brain regions.
Each data point is calculated as VOI-average across subjects from either five
healthy volunteers (blue) or five MS patients in normal-appearing tissue
(orange), in lesions (purple), or in peri-lesional normal-appearing white
matter (purple). The error bars indicate the standard deviation of voxel values
within VOIs averaged across participants (pooled standard deviation).
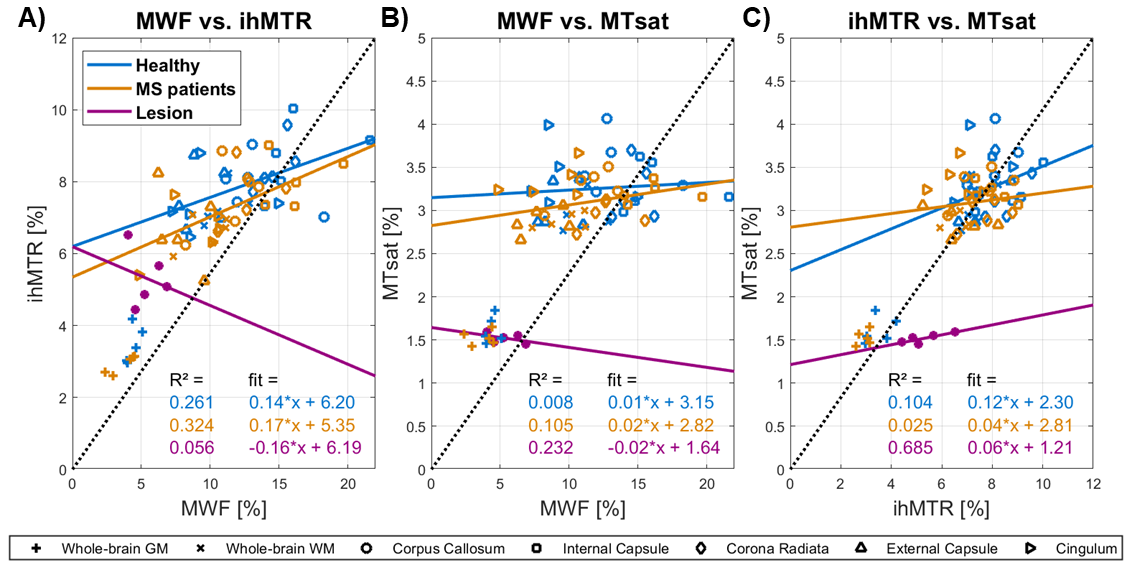
Figure
5: Correlation plots comparing pairs of VOI-average myelin-sensitive marker
values including MWF vs. ihMTR (A), MWF vs. MTsat (B), and ihMTR vs. MTsat (C)
in white matter and lesions. Each panel contains individual VOI-mean myelin
marker values from healthy participants (blue), MS patients (orange), and
lesion tissue (purple). Additionally, for WM VOIs of healthy participants and MS
patients, and for lesion tissue, separate correlation estimates (solid lines) are
provided in the corresponding color. The dotted lines indicate perfect
correlation.
DOI: https://doi.org/10.58530/2022/0890