0889
Magnetic Resonance Fingerprinting enables measuring T1-shortening in multiple sclerosis lesions after contrast media administration1Azienda Ospedaliero Universitaria Pisana, Pisa, Italy, 2IMAGO 7 Research Foundation, Pisa, Italy, 3IRCCS Stella Maris, Pisa, Italy, 4University of Pisa, Pisa, Italy, 5Department of Neuroscience, Rehabilitation, Ophtalmology, Genetics, Maternal and Child Sciences, University of Genoa, Genoa, Italy
Synopsis
Quantitative maps of T1-shortening (ΔT1) related to intra-venous contrast media administration are obtained in patients with Multiple Sclerosis by using 3D Quantitative Transient-state Imaging. Statistically significant ΔT1 is observed not only in enhancing lesions, but also in some non-enhancing lesions, suggesting a potential role of this method as a quantitative imaging biomarker to detect subtle blood-brain barrier damage.
Introduction
In patients with Multiple Sclerosis (MS), contrast enhancement in demyelinating lesions is considered a surrogate marker of active inflammation and is visually assessed in magnetic resonance (MR) imaging using T1-weighted sequences acquired after intravenous contrast media (IVCM) administration1. It has recently been shown that MP2RAGE2 at 7T enables to detect measurable changes in T1 relaxation time caused by IVCM not only in enhancing white matter lesions (EL) but also in some non-enhnancing white matter lesions (NEL)3, which has been proposed as a clinically relevant evidence of blood-brain barrier (BBB) breakdown.This study aims to assess whether quantitative T1 mapping obtained with 3D Quantitative Transient-state Imaging (QTI)4, a multiparametric mapping technique derived from MR fingerprinting5, enables to measure contrast-related T1 shortening (ΔT1) at 3T when acquired before and after IVCM administration.
Methods
Fourteen subjects were included in this study: 12 patients with relapsing-remitting MS (7 males, 39±11 years) and 2 healthy controls (HC, 1 male, 30 and 38 years), who underwent a brain MR exam with an MR750 3T scanner (GE Healthcare, Chicago, USA). Besides the conventional clinical MR protocol which included conventional 3D T1-BRAVO, T2-FLAIR, T2 Fast Spin Echo (FSE) imaging as well as post-IVCM administration 3D T1-FSPGR, the exam protocol of the MS patients included also two 3D steady-state free precession QTI acquisitions with an inversion-prepared variable flip angle pattern for T1/T2 encoding and spiral projection k-space trajectory4,6, obtained respectively before and after IVCM administration. The acquisition had TE/TR=0.5/8.5ms, FOV=225mm, which covered the whole head with a data matrix of size 200×200×200 with TA=7’00”. Quantitative maps of T1, T2 and proton density (PD) with isotropic spatial resolution of 1.1×1.1×1.1 mm3 were obtained from the acquired and motion-compensated6 data by comparison with a pre-computed dictionary of MR signal evolutions7. For each exam, the pre- and post-contrast T1 maps were co-registered8 and a ΔT1 map was obtained by voxel-wise subtraction. ΔT1 maps were visually inspected by an experienced neuroradiologist to identify signal changes in brain tissue corresponding to T1-shortening. Regions of interest (ROI) covering all enhancing lesions (EL), representative non-enhancing lesions (NEL) and normal-appearing white matter (NAWM) were manually drawn on synthetic FSE images generated by using the T1, T2 and PD maps obtained from QTI4. Then, ΔT1 measures were recorded and compared among ROIs with linear mixed models, using subject identifier as grouping factor.The HC underwent QTI scanning twice to obtain ΔT1 maps in the absence of IVCM administration, which were smoothed with a box filter of size 3×3×3 voxels. The distribution of HC ΔT1 values in voxels with PD > 0.5 was used as a reference distribution, whose standard deviation σ enabled assessment of the significance of ΔT1 values observed in patients.
Results and Discussion
At radiological inspection of conventional post-contrast T1-weighted images, four ELs were observed in two MS patients (two lesions in each patient). Two of these were punctiform lesions.Figure 1 shows representative lesions (one EL in the left column and one NEL in the right column), seen in conventional T2-FLAIR on the top row, in conventional T1-weighting after IVCM administration in the middle row, and in QTI-derived ΔT1 maps in the bottom row.
Upon radiological inspection of all patients’ ΔT1 maps, all ELs were clearly visible, except for one of the punctiform ELs.
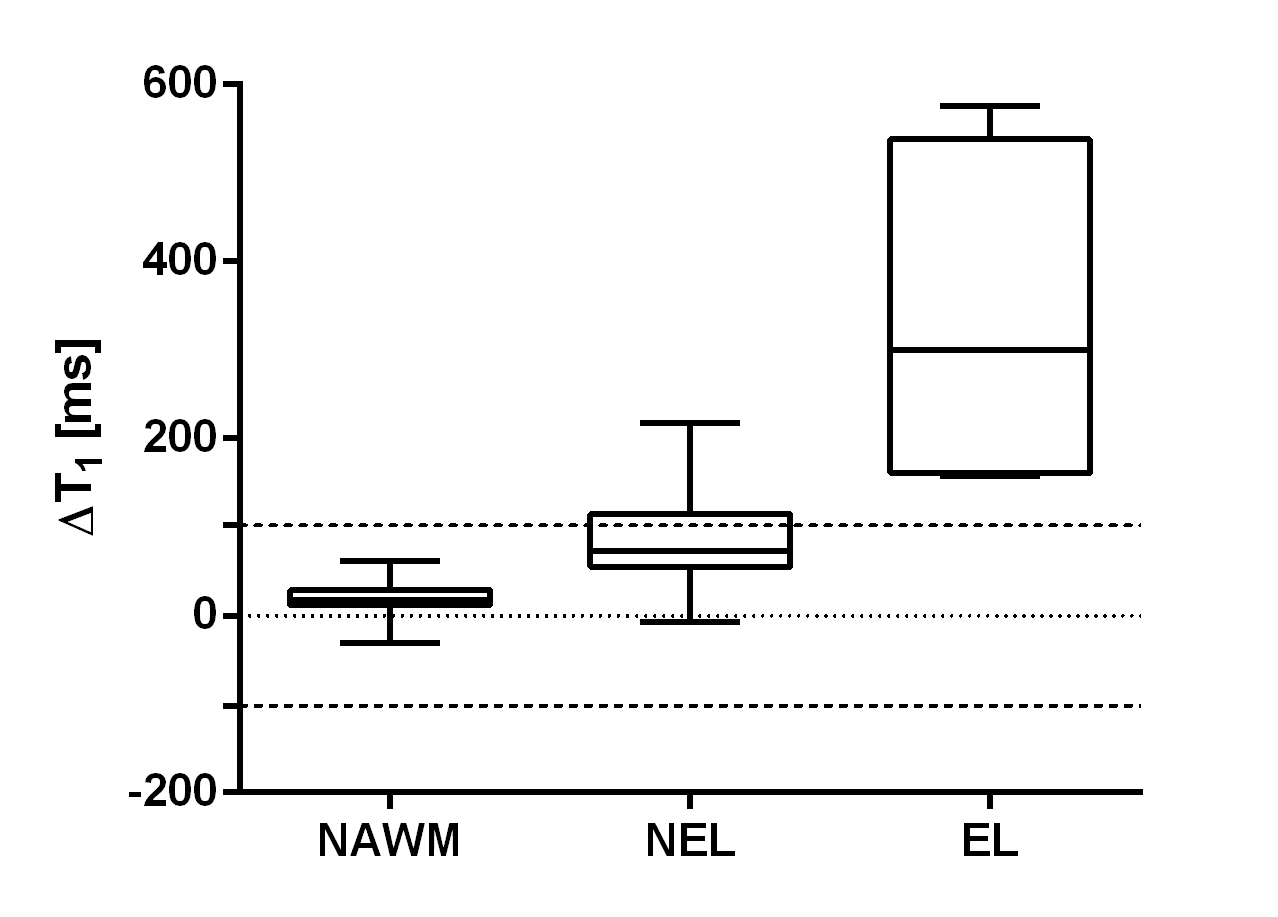
Figure 2 shows that, in quantitative analysis, ΔT1 resulted significantly higher in ELs than in NELs. Also, ΔT1 was higher in lesions (both ELs and NELs) than in NAWM (in all comparisons, p< 0.001, Bonferroni-corrected). In HC, the ΔT1 in voxels with PD>0.5 was normally distributed with ΔT1= -1.4±51.2 ms (mean ± standard deviation). Dashed lines in Figure 2 delimit the interval of ΔT1 values within 2σ in HC: all ELs and a non-negligible fraction (26%) of NELs exhibit significantly higher ΔT1 values than those observed in HC.
Conclusion
QTI-derived ΔT1 mapping reveals enhancing MS lesions with both qualitative and quantitative analyses.Non-enhancing lesions exhibiting ΔT1 values that significantly deviate from the reference distribution may indicate persistent, subtle, BBB disruption. Access to this information may be proved useful to better characterize pathology and monitor disease progression.
Acknowledgements
This study is part of a research project funded by the Italian Ministry of Health (grant n. GR-2016-02361693).References
1. Hawkins CP, Munro PMG, Mackenzie F, et al. Duration and selectivity of blood-brain barrier breakdown in chronic relapsing experimental allergic encephalomyelitis studied by gadolinium-dtpa and protein markers. Brain. 1990;113(2):365-378.
2. Marques JP, Kober T, Krueger G, van der Zwaag W, Van de Moortele PF, Gruetter R. MP2RAGE, a self bias-field corrected sequence for improved segmentation and T1-mapping at high field. Neuroimage. 2010;49(2):1271-1281. doi:10.1016/J.NEUROIMAGE.2009.10.002
3. Choi S, Spini M, Hua J, Harrison DM. Blood-brain barrier breakdown in non-enhancing multiple sclerosis lesions detected by 7-Tesla MP2RAGE ΔT1 mapping. PLoS One. 2021;16(4). doi:10.1371/JOURNAL.PONE.0249973
4. Gómez PA, Cencini M, Golbabaee M, et al. Rapid three-dimensional multiparametric MRI with quantitative transient-state imaging. Sci Rep. 2020;10(1):1-17. doi:10.1038/s41598-020-70789-2
5. Ma D, Gulani V, Seiberlich N, et al. Magnetic resonance fingerprinting. Nature. 2013;495(7440):187-192. doi:10.1038/NATURE11971
6. Kurzawski JW, Cencini M, Peretti L, et al. Retrospective rigid motion correction of three-dimensional magnetic resonance fingerprinting of the human brain. Magn Reson Med. 2020;84(5):2606-2615. doi:10.1002/mrm.28301
7. Jiang Y, Ma D, Seiberlich N, Gulani V, Griswold MA. MR fingerprinting using fast imaging with steady state precession (FISP) with spiral readout. Magn Reson Med. 2015;74(6):1621-1631. doi:10.1002/mrm.25559
8. Jenkinson M, Bannister P, Brady M, Smith S. Improved optimization for the robust and accurate linear registration and motion correction of brain images. Neuroimage. 2002;17(2):825-841. doi:10.1016/S1053-8119(02)91132-8
Figures
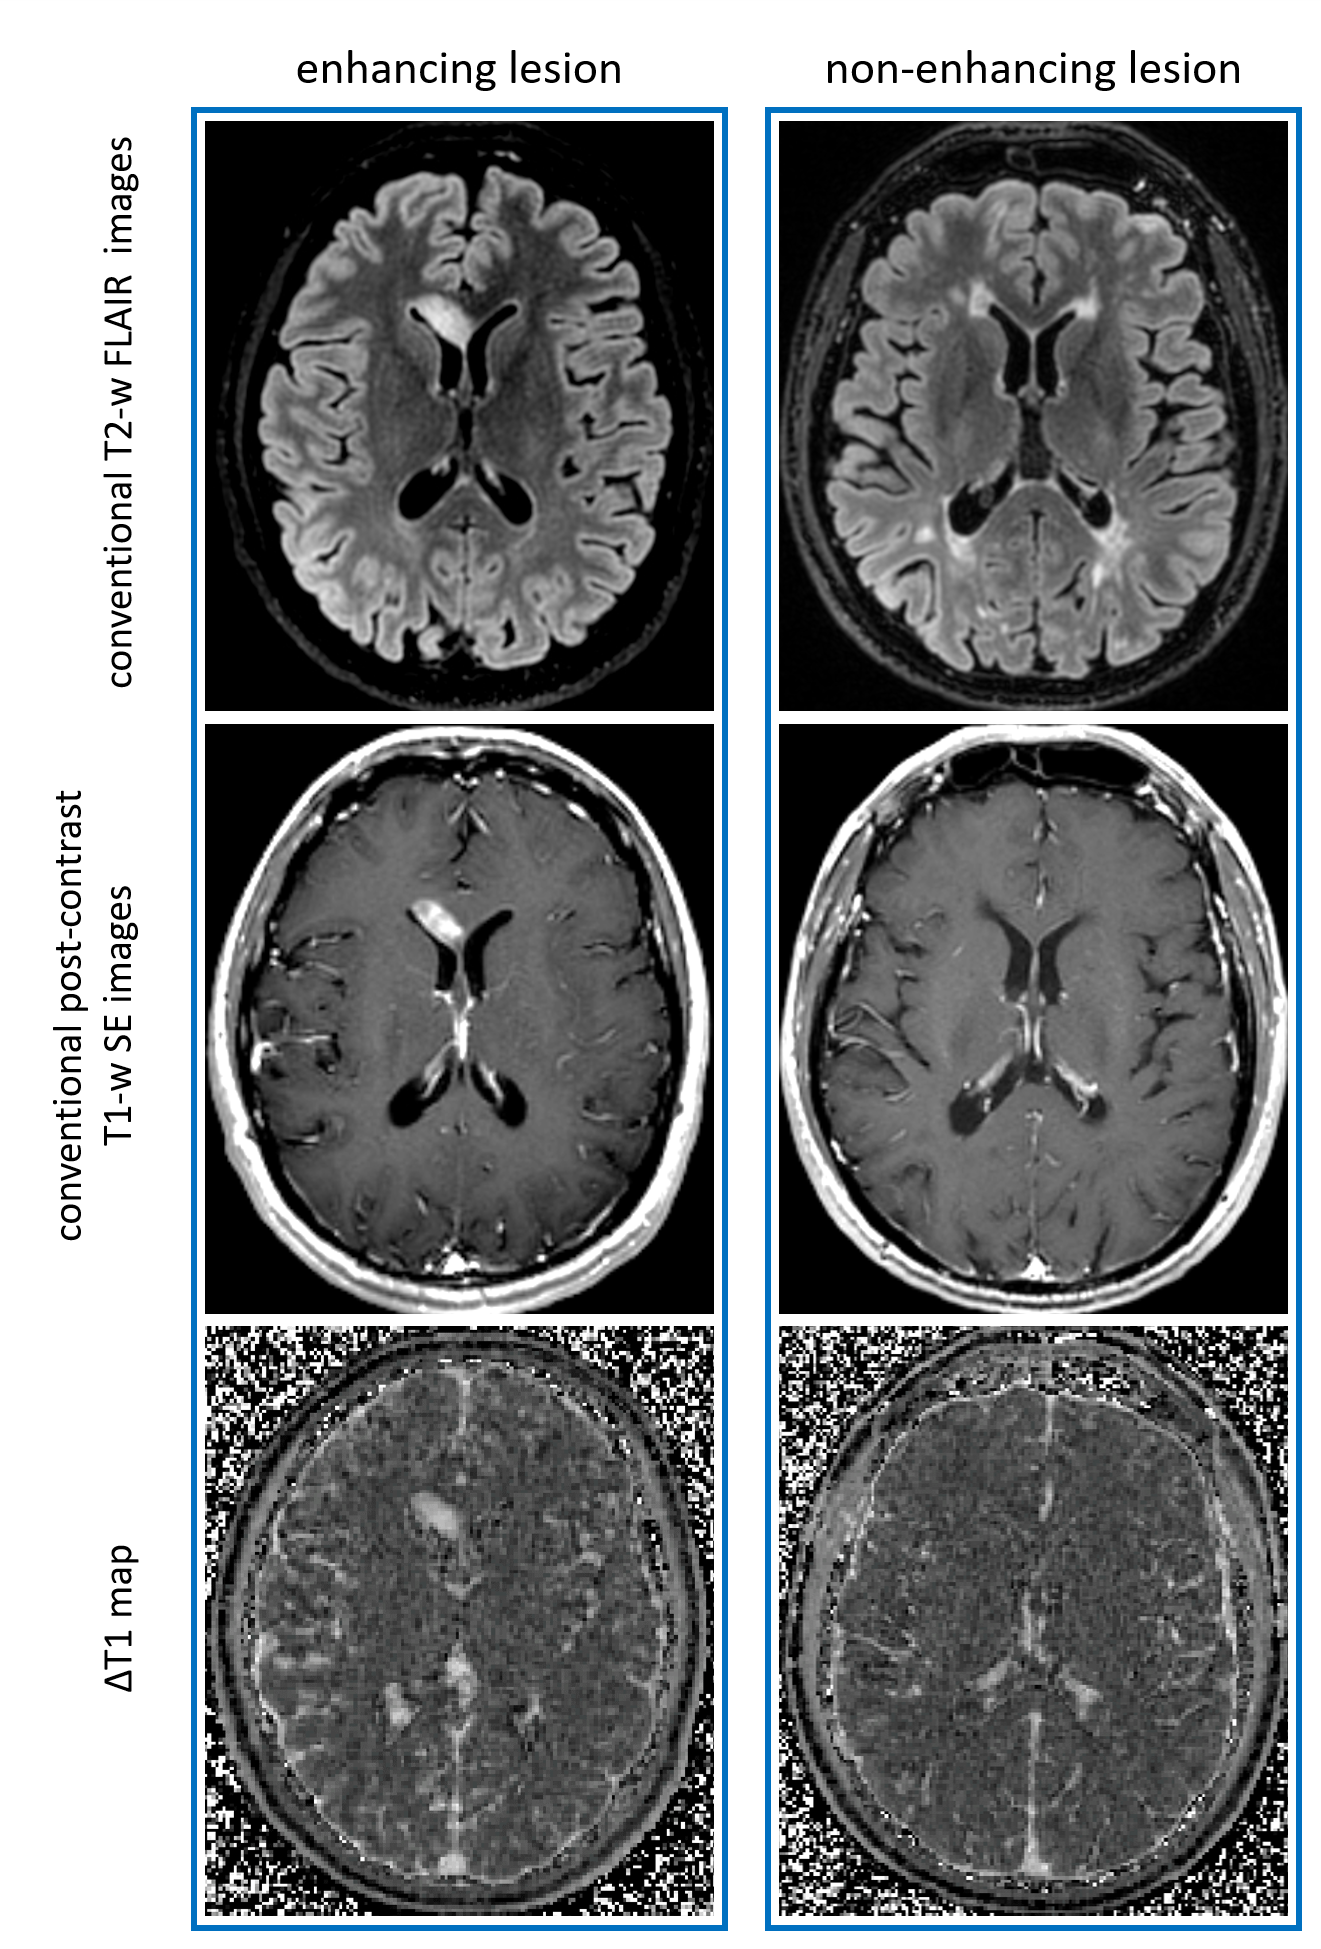
Figure 1. Representative EL (left column) and NEL (right column) in two patients. Top row: T2-FLAIR images; middle row: T1w images after IVCM administration; bottom row: QTI-derived ΔT1 maps