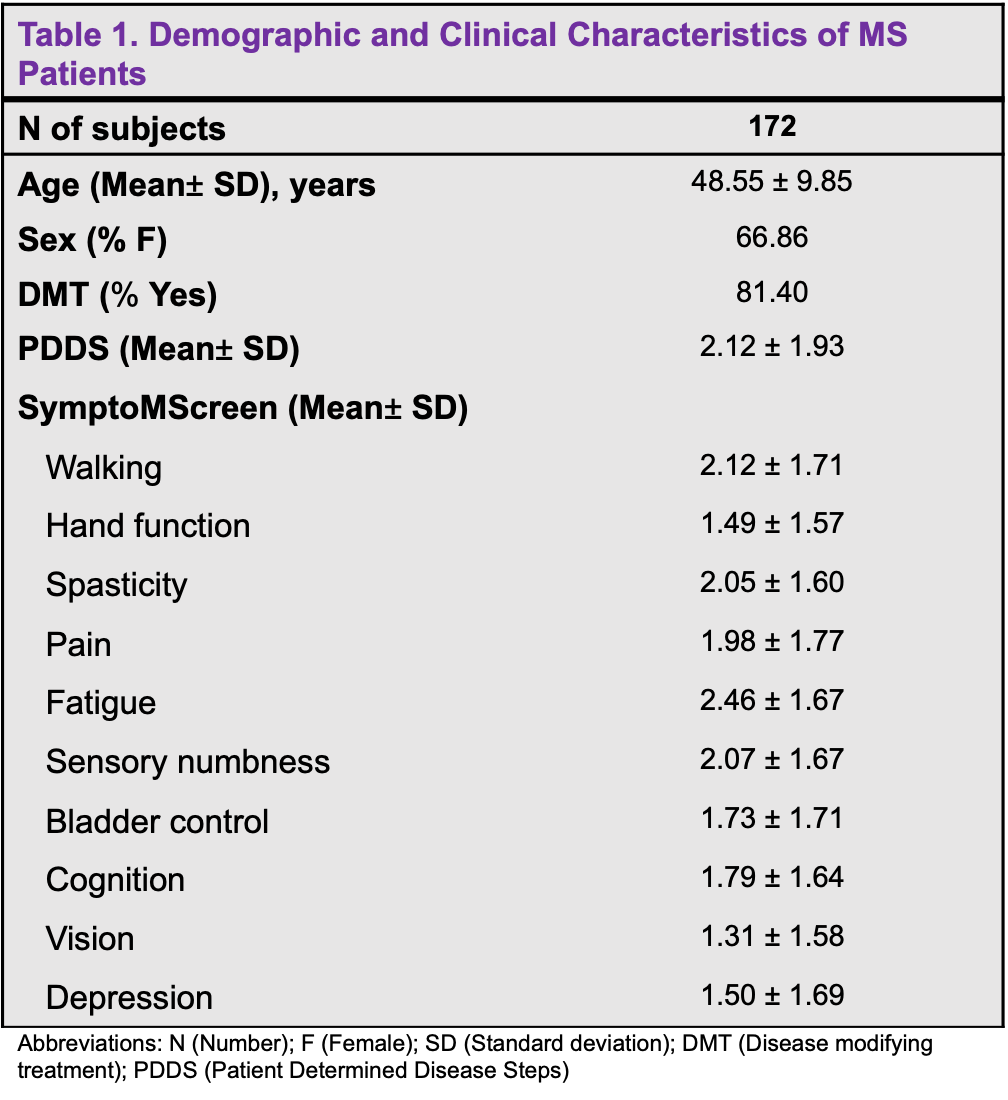
0888
Gray Matter Correlates of Patient-Reported Indices of Disability in Multiple Sclerosis1Radiology, NYU, New York, NY, United States, 2Neurology, NYU, New York, NY, United States
Synopsis
In a cohort of 172 MS subjects, we identified thalamic atrophy as a significant gray matter correlate of patient-reported indices of motor disability.
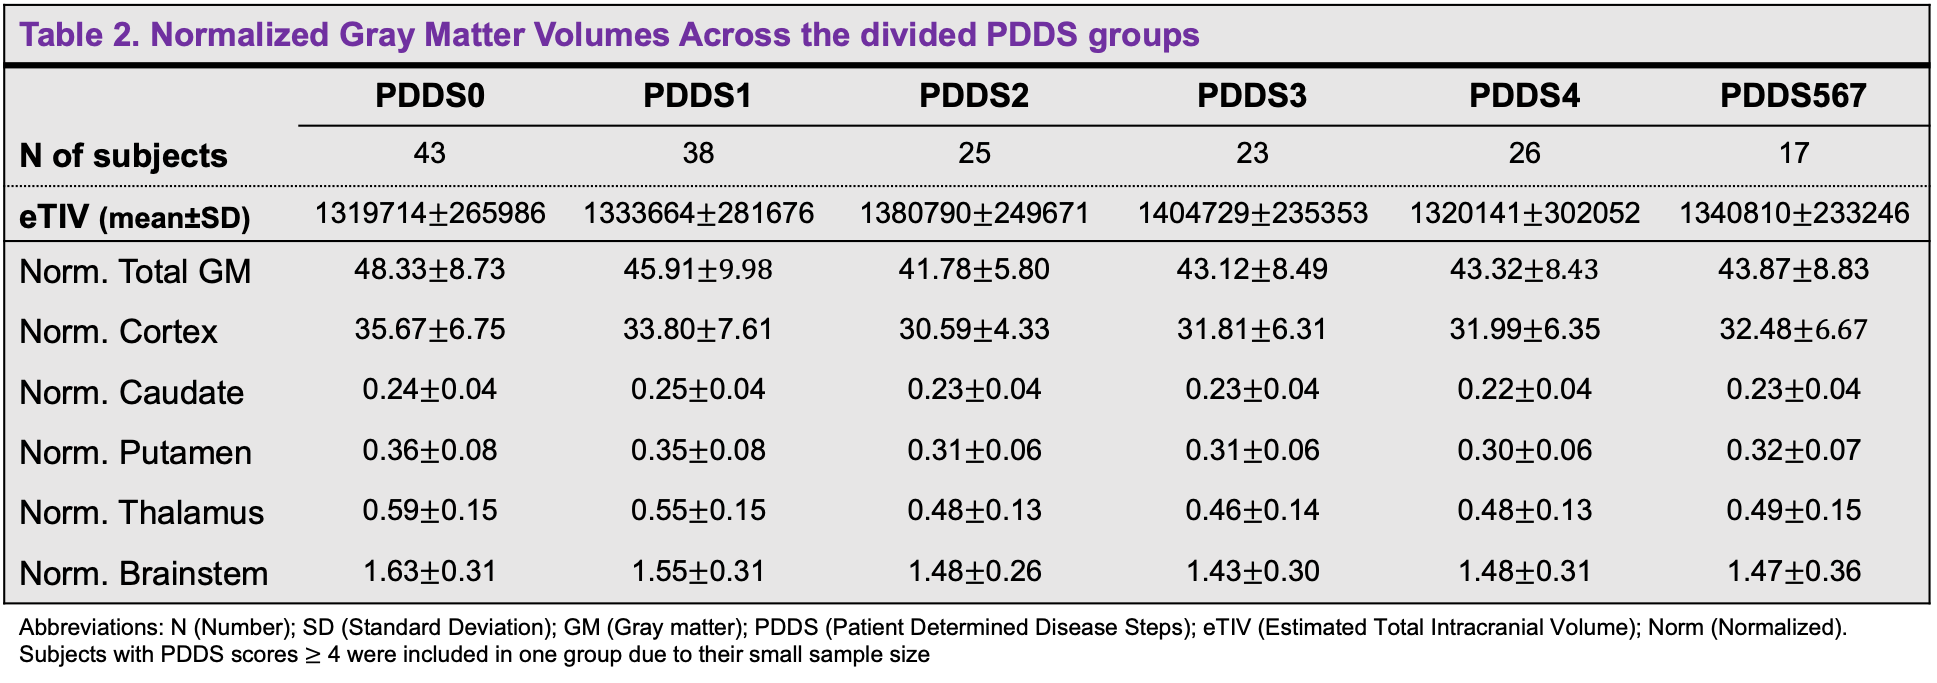
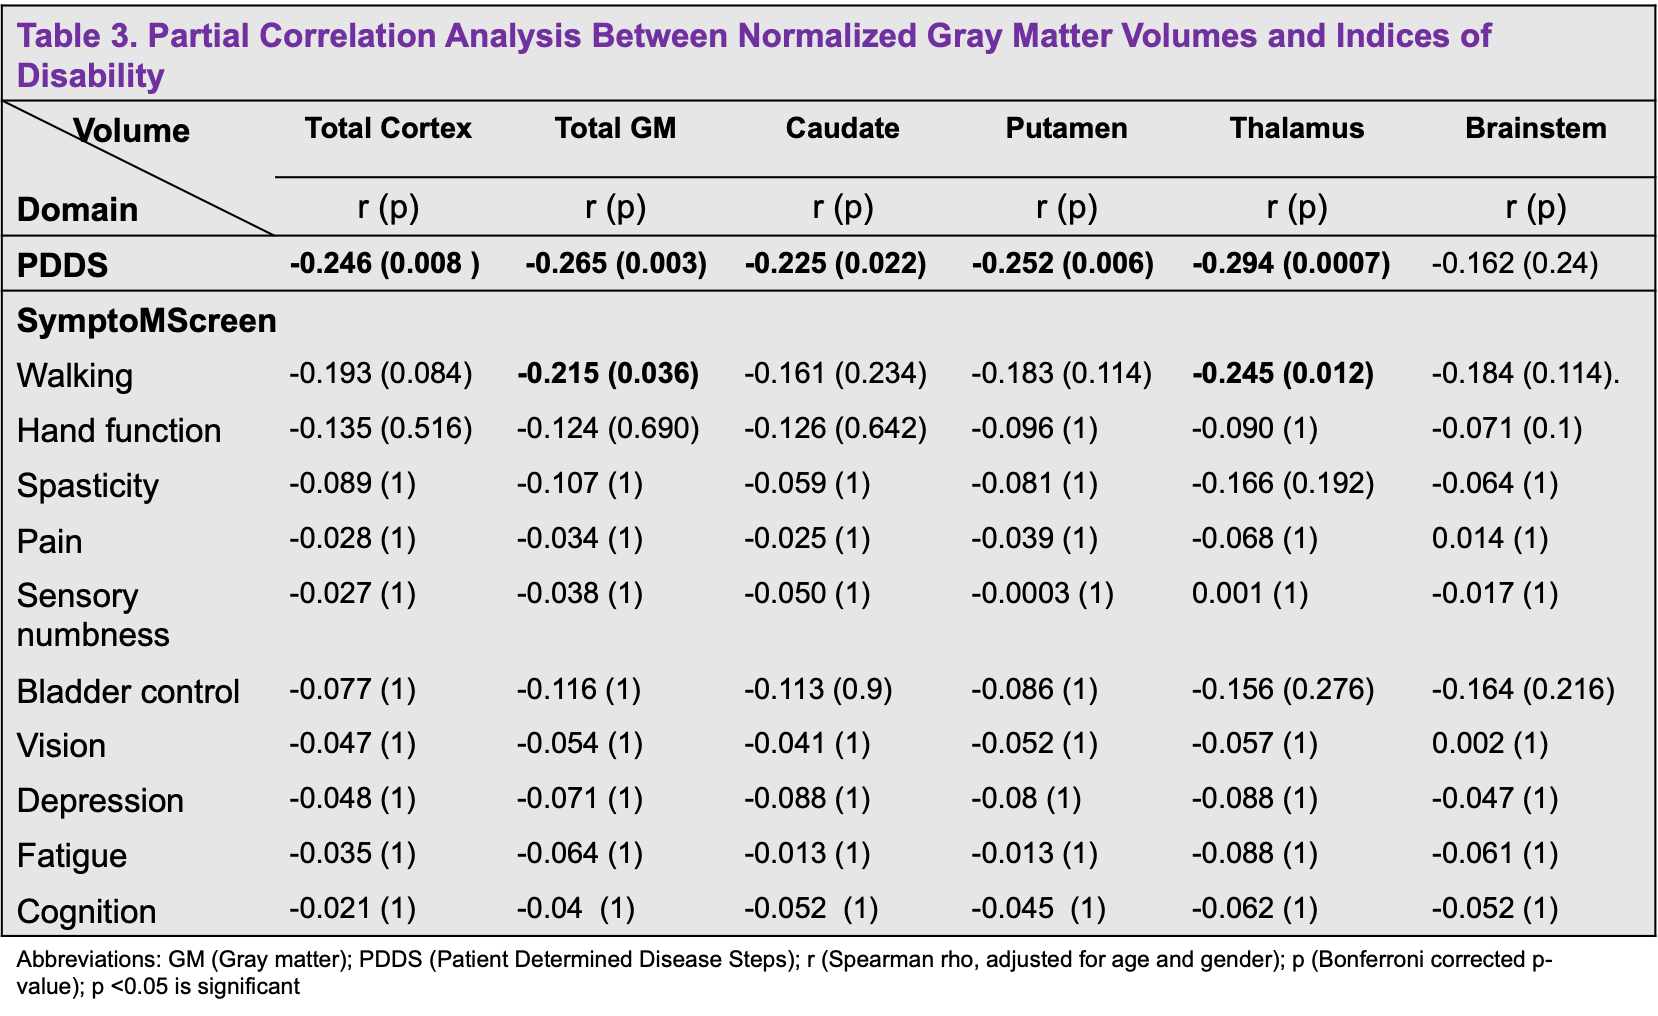
Method: This IRB-approved retrospective study included 172 subjects identified with a clinical diagnosis of MS using the McDonald criteria that underwent clinically-indicated MRI using a 3T-MRI scanner (Siemens Magnetom Prisma or Skyra) with a 20-channel head coil between 2014 and 2020 (Table 1). Within one year of the MRI, disability status was assessed using two patient self-report measures, the Patient Determined Disease Steps (PDDS)4 and the SymptoMScreen Tool5. The MRI protocol included 3DT1-weighted magnetization prepared rapid gradient echo sequence for cortical thickness and volumetric measurements (1 mm3 isotropic), echo-planar diffusion kurtosis imaging with three diffusion weightings (b = 250/1000/2,000 s/mm2; 4/20/60 directions), together with a non-diffusion weighted images for assessment of the normal-appearing WM and GM, and fluid attenuated inversion recovery images for WM lesion detection. FreeSurfer recon-all (version 7.1.1) pipeline was used to obtain brain volumetric segmentation and to perform cortical thickness measures as previously described6. For the region of interest (ROI) analysis, volumes of the caudate, putamen, thalamus, brainstem, cortex and total GM were considered (Table 2). Spearman partial correlation covarying for age and sex was used to study the relationship between the subcortical volumes (normalized to intracranial volume) and clinical measures with the statistical package R. Bonferroni correction was applied to correct for multiple comparisons of ROIs. Cortical thickness maps were smoothed using a Gaussian kernel with a full width at half maximum of 10 mm. A general linear model was run to study the correlation between cortical thickness and MS disability scores, with sex and age as covariates. A pre-computed Z Monte Carlo simulation was used to perform a cluster-wise correction for multiple comparisons with vertex-wise cluster.
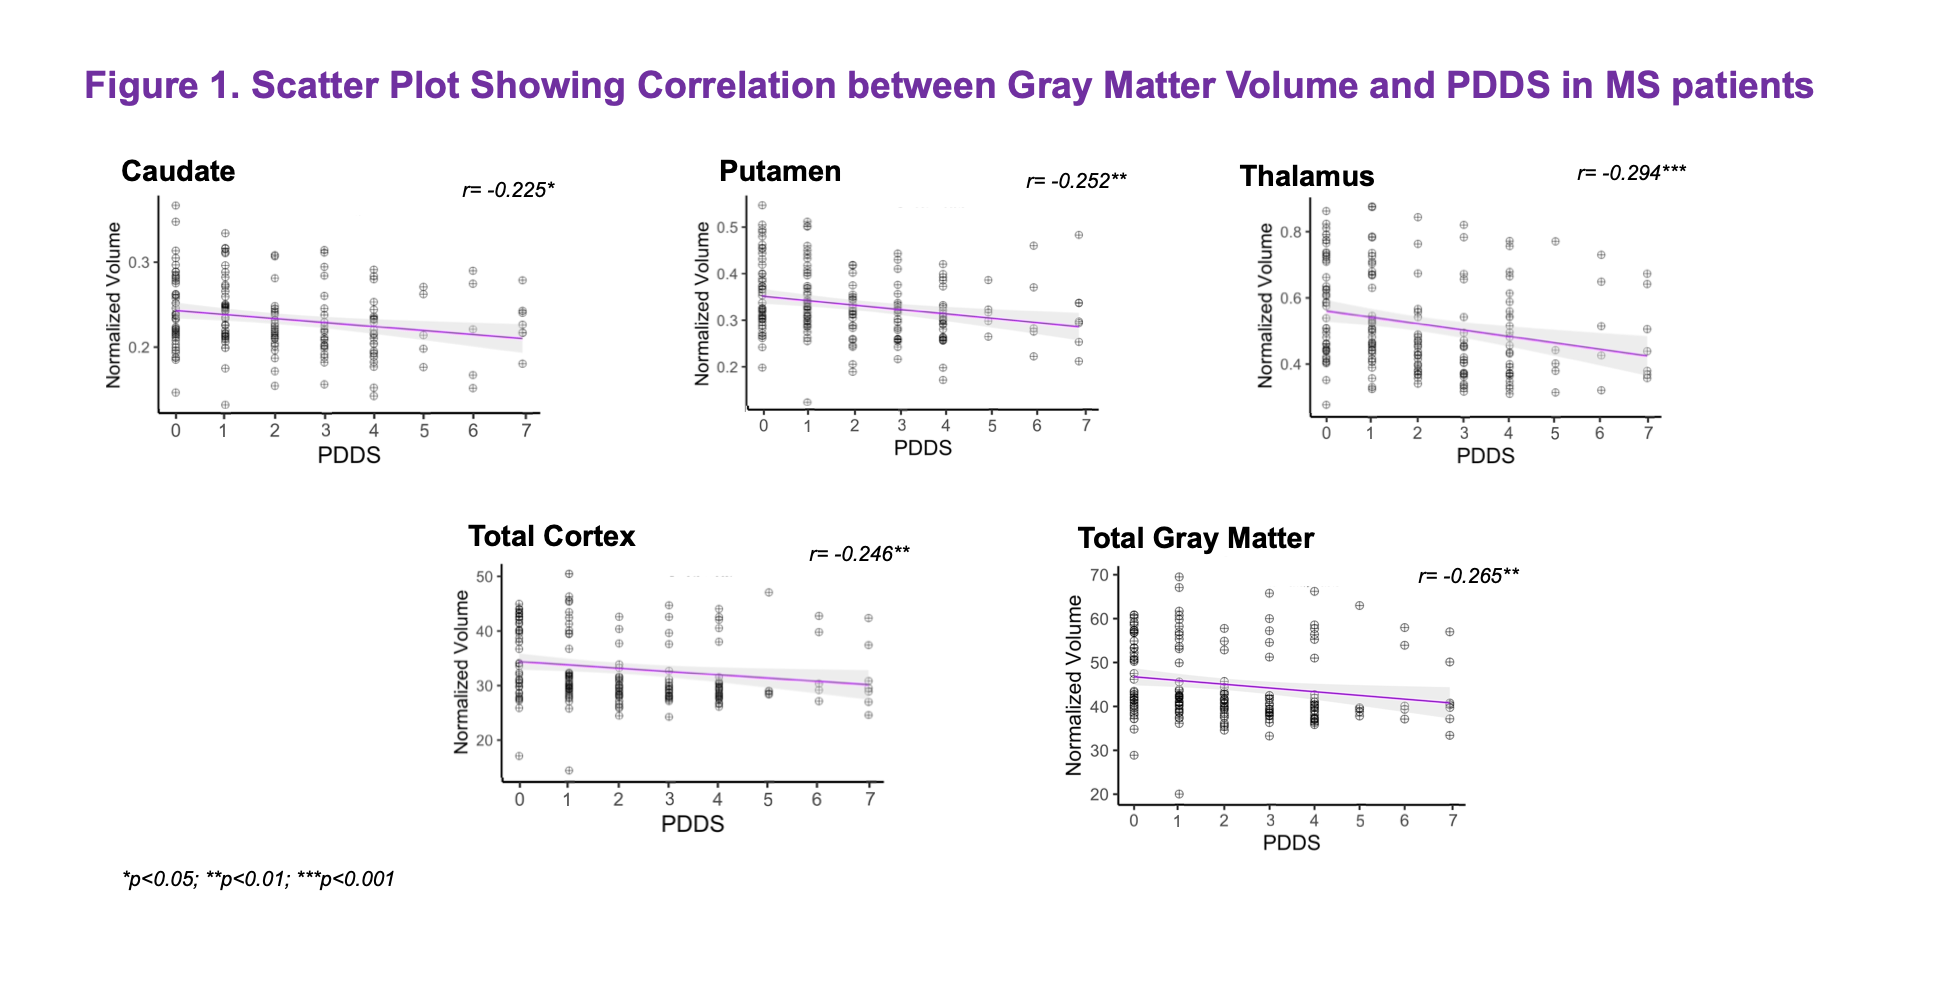
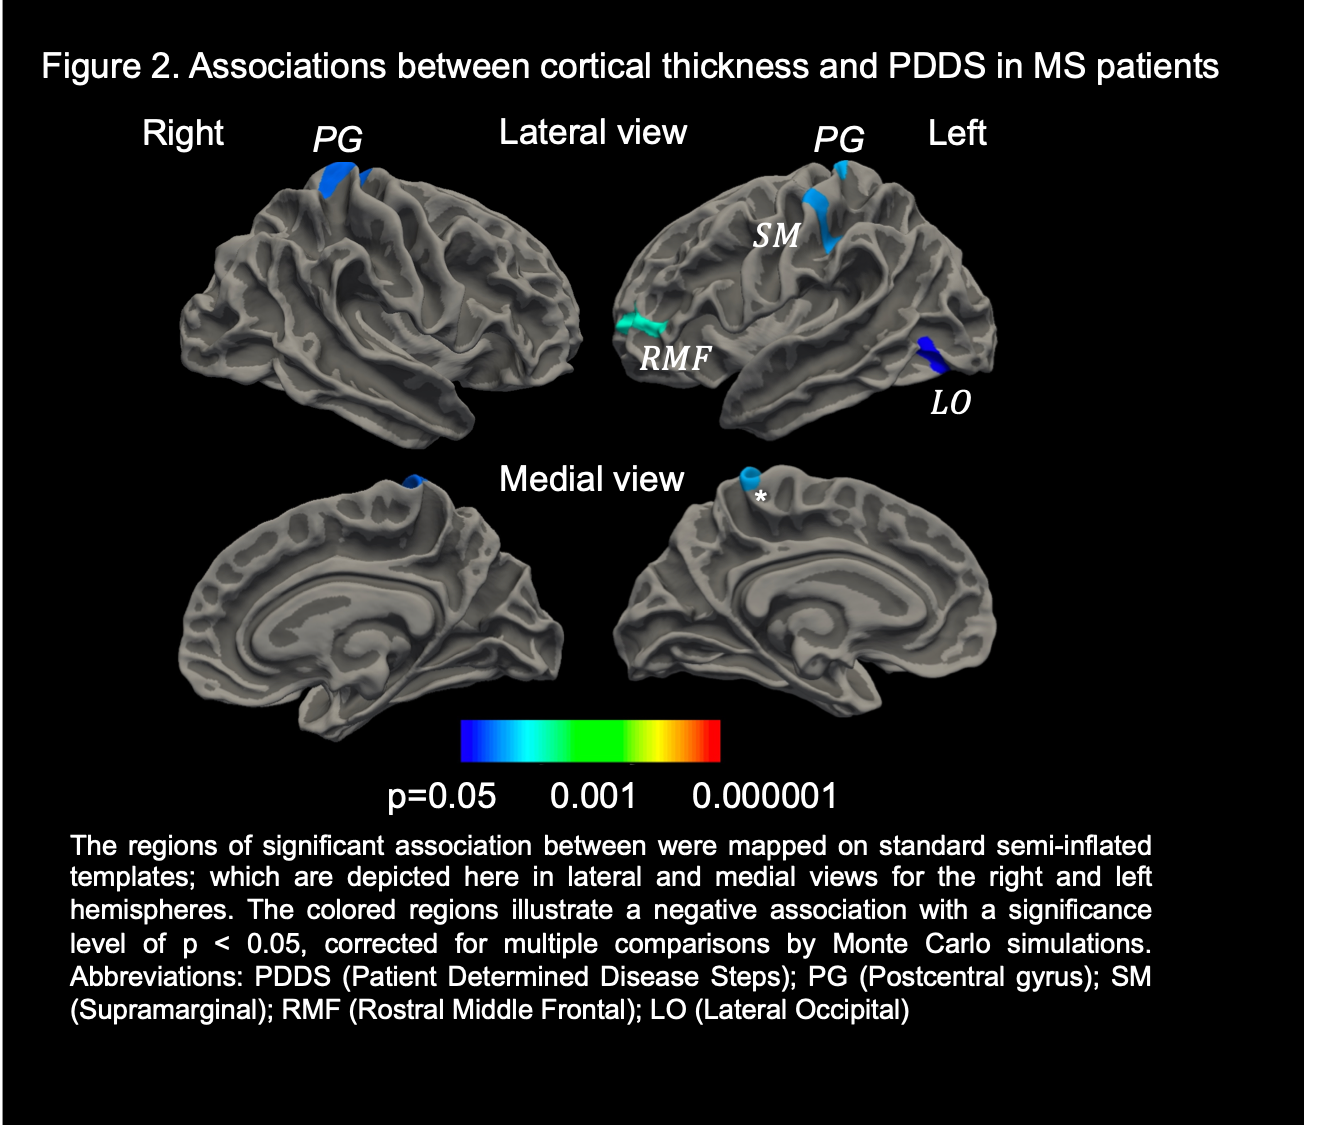
Results: MS subjects were primarily females ( 66.86%) with a mean age of 48.55 ± 9.85 years (Table 1). The mean PDDS score was 2.12 with an interquartile range of 2.5. Subjects with PDDS 4 constituted 25.0% of the sample, reflecting the early use of cane for walking or greater gait disability. PDDS score was found to be negatively correlated with almost all normalized gray matter volumes (Table 3). The strongest correlation was observed for the thalamic volume (rho= -0.294, p= 0.0007) (Figure 1). A similar negative correlation was also observed between thalamic volume and walking domain in the SymptoMScreen (rho= -0.245, p= 0.012). Notably, the PDDS score increased significantly with worse walking on the SymptoMScreen (rho= 0.80, p<0.0001), but no correlations were observed between PDDS and other functional domains. The vertex-wise analysis is shown in Figure 2. We found significant cluster-wise negative correlations between PDDS scores and cortical thickness in the right (r= -0.246, p= 0.013) and left postcentral gyrii (r= -0.248, p =0.008), left rostral middle frontal (r= -0.240, p= 0.002), left supramarginal (r= -0.237, p= 0.009) and left lateral occipital gyrus (r= -0.238, p= 0.039). In contrast, SymptoMScreendomains were not found to correlate with any of the ROI volumes or vertex-wise cortical thickness.
Discussion: GM pathology in MS has been increasingly recognized as an early event in the disease course. The current study sought to identify cortical and subcortical gray matter correlates of various clinical manifestations in MS after adjusting for age and sex in 172 patients. Our ROI analysis suggested significant associations between the normalized thalamic volume and both the PDDS and SymptoMScreen walking domain. These correlations speak to a robust role of thalamic atrophy in motor disability7,8 and support using this measurement as an outcome measure for phase III MS trials 9. Subsequent vertex-wise analyses showed negative correlations between PDDS and thickness of the postcentral gyrus bilaterally, as well as with several cortical regions in the left hemisphere. This suggests that dysfunctions in higher-order aspects of motor control may have a role in mediating motor decline in MS. Although PDDS is a subjective measure of disability, it has significant GM brain correlations and can be potentially used in longitudinal studies to track disease progression. Future work will account for MS lesion burden and investigate the tissue microstructural changes underlying thalamic atrophy in MS using dMRI.
Conclusions: Thalamic atrophy is significantly related to motor disability in MS and may predict functional disability along the disease course. Our results support the use of the thalamus as a potential outcome measure in MS clinical trials and warrants future work characterizing microstructural changes underling atrophy.
Acknowledgements
Research was supported by the National Institute of Neurological Disorders and Stroke of the NIH under awards R01 NS088040 and R21 NS081230, and by the Hirschl foundation, and was performed at the Center of Advanced Imaging Innovation and Research (CAI2R, www.cai2r.net), a Biomedical Technology Resource Center supported by NIBIB with the award P41 EB017183References
1. Wallin MT, Wilken JA, Kane R (2006) Cognitive dysfunction in multiple sclerosis: assessment, imaging, and risk factors. J Rehabil Res Dev 43(1):632.
2. Fisniku, L. K., Chard, D. T., Jackson, J. S., Anderson, V. M., Altmann, D. R., Miszkiel, K. A., Thompson, A. J., & Miller, D. H. (2008). Gray matter atrophy is related to long-term disability in multiple sclerosis. Annals of neurology, 64(3), 247–254. https://doi.org/10.1002/ana.214233.
3. Calabrese, M., Agosta, F., Rinaldi, F., Mattisi, I., Grossi, P., Favaretto, A., Atzori, M., Bernardi, V., Barachino, L., Rinaldi, L., Perini, P., Gallo, P., & Filippi, M. (2009). Cortical lesions and atrophy associated with cognitive impairment in relapsing-remitting multiple sclerosis. Archives of neurology, 66(9), 1144–1150. https://doi.org/10.1001/archneurol.2009.1744.
4. Hohol M, Orav E, Weiner H. Disease steps in multiple sclerosis: a simple approach to evaluate disease progression. Neurology 1995; 5: 251/55.5.
5. Green, R., Kalina, J., Ford, R., Pandey, K., & Kister, I. (2017). SymptoMScreen: A Tool for Rapid Assessment of Symptom Severity in MS Across Multiple Domains. Applied neuropsychology. Adult, 24(2), 183–189. https://doi.org/10.1080/23279095.2015.11259056.
6. Fischl B, Dale AM (2000) Measuring the thickness of the human cerebral cortex from magnetic resonance images. Proc Natl Acad Sci U S A 97(20):11050–11055. https://doi.org/10.1073/pnas. 2000337977.
7. Rocca, M. A., Mesaros, S., Pagani, E., Sormani, M. P., Comi, G., & Filippi, M. (2010). Thalamic damage and long-term progression of disability in multiple sclerosis. Radiology, 257(2), 463–469. https://doi.org/10.1148/radiol.101003268.
8. Azevedo, C. J., Cen, S. Y., Khadka, S., Liu, S., Kornak, J., Shi, Y., Zheng, L., Hauser, S. L., & Pelletier, D. (2018). Thalamic atrophy in multiple sclerosis: A magnetic resonance imaging marker of neurodegeneration throughout disease. Annals of neurology, 83(2), 223–234. https://doi.org/10.1002/ana.251509.
9. Van Munster CE, Uitdehaag BM. Outcome Measures in Clinical Trials for Multiple Sclerosis. CNS Drugs. 2017;31(3):217-236. doi:10.1007/s40263-017-0412-5
Figures