0887
Quantitative MRI measures of thalamic microstructural integrity in patients with multiple sclerosis1Translational Imaging in Neurology (ThINK) Basel, Department of Biomedical Engineering, Translational Imaging in Neurology (ThINK) Basel, Department of Biomedical Engineering, Faculty of Medicine, University Hospital Basel and University of Basel, Basel, Switzerland. Neurologic Clinic and Policlinic, MS Center and Research Center for Clinical Neuroimmunology and Neuroscience Basel (RC2NB), University Hospital Basel and University of Basel, Basel, Switzerland, Basel, Switzerland, 2Translational Imaging in Neurology (ThINK) Basel, Department of Biomedical Engineering, Faculty of Medicine, University Hospital Basel and University of Basel, Basel, Switzerland. Neurologic Clinic and Policlinic, MS Center and Research Center for Clinical Neuroimmunology and Neuroscience Basel (RC2NB), University Hospital Basel and University of Basel, Basel, Switzerland. Division of Radiological Physics, Department of Radiology, University Hospital Basel, Basel, Switzerland, Basel, Switzerland, 3Laboratory for Research in Neuroimaging, Department of Clinical Neuroscience, Lausanne University Hospital and University of Lausanne, Switzerland, Lausanne, Switzerland, 4Department of Radiology, Weill Cornell Medical College, New York, NY, USA, New York, NY, United States, 5Neurologic Clinic and Policlinic, MS Center and Research Center for Clinical Neuroimmunology and Neuroscience Basel (RC2NB), University Hospital Basel and University of Basel, Basel, Switzerland, Basel, Switzerland
Synopsis
Thalamus represents a pivotal structure to study MS-associated neurodegeneration. In this study we investigated the alterations in thalamic microstructure of MS patients by using magnetization transfer saturation (MTsat), T1-relaxometry, and myelin water fraction (MWF). Compared to healthy controls (HCs), MS patients presented significant modifications in the thalamic quantitative MRI metrics, suggesting ongoing microstructural and myelin loss. The thalamic quantitative MRI metrics explored showed variable degrees of association with MS lesion burden, brain atrophic changes, as well as with clinical and cognitive disability.
Introduction
The thalamus is a critically relevant central nervous system (CNS) structure that is extensively affected in multiple sclerosis (MS) patients, even at early disease stages1. Thalamic damage in MS is thought to be due to direct damage2 but also to axonal transection in thalamic connections with other CNS compartments3. Besides, mechanisms at least partially independent from focal inflammation are likely to be involved in thalamic degeneration, such as iron accumulation4, and mitochondrial dysfunction5.Given its centrality in CNS physiology and MS pathology, the thalamus has been proposed as a pivotal structure to study MS-associated neurodegeneration1.
The aim of our study was to investigate alterations in thalamic microstructure in MS patients by using different quantitative MRI metrics – namely magnetization transfer saturation (MTsat), T1-relaxometry, and myelin water fraction (MWF). We then explored the association between such metrics and demographic, conventional MRI, and clinical measures.
Methods
Participants: we included 152 MS patients [60% female; mean (SD) age: 45.5 (14.6) years; median (IQR) disease duration 6.0 (0.9-14.8) years; median (IQR range) EDSS: 2.5 (1.5-4.5); 97 relapsing MS (RMS), 55 progressive MS (PMS)], and 103 HCs [55% female; mean (SD) age: 37.5 (12.9) years]. Demographic, and clinical data were available for the entire cohort, while cognitive assessment was available for 89 patients.MRI acquisition: all subjects underwent the same MRI protocol, on a 3T scanner (Magnetom Prisma, Siemens Helthcare), including: 3D, 1mm isotropic, fluid-attenuated inversion recovery (FLAIR) [repetition time/echo time/inversion time = 5000/386/1800 ms]; 3D, 1mm isotropic, magnetization-prepared 2 rapid gradient-echo (MP2RAGE) [repetition time/inversion time 1/inversion time 2 = 5000/700/2500 ms]; fast acquisition with spiral trajectory and adiabatic T2prep (FAST-T2) [spiral repetition time/echo time = 7.5/0.5 ms, six T2prep times = 0 (T2prep turned off), 7.5, 17.5, 67.5, 147.5, 307.5 ms, voxel size = 1.25 × 1.25 × 5 mm3, scan time = 4.5 min]. Quantitative MTsat images were acquired using three 3D RF spoiled gradient echo acquisitions with predominantly Magnetization Transfer-weighted (MTw: TR/α = 25 ms/5o), proton density-weighted (PDw: TR/α = 25 ms/5o) and T1-weighted (T1w: TR/α = 11 ms/15o) contrast6,7. MWF maps were obtained from FAST-T2, as previously described8.
MRI analysis: T2-lesion volume (T2LV) was obtained automatically9, and subsequently manually corrected. Manual detection of cortical lesions was performed on MP2RAGE images by consensus by two readers. Total brain volume (TBV), gray matter (GM) volume, white matter (WM) volume, and total intracranial volume (TIV) were obtained with SAMSEG10,11, part of FreeSurfer12.
Thalami were manually segmented with ITK-SNAP13, using as contrasts of reference MP2RAGE and MTsat. To restrict the analysis to the normal-appearing thalamic tissue, the volume of lesions within thalamus was subtracted to thalamic masks. The resulting masks were then used as regions of interest to extract the mean thalamic values of MTsat, T1-relaxometry, and MWF.
Statistical analysis: the quantitative MRI metrics were compared between MS patients and HCs after full propensity score matching of groups for age and sex.
General linear models were used to explore the association between quantitative MRI metrics and: 1) demographic factors; 2) volume of WM lesions and cortical lesions (after logarithmic transformation); 3) brain volumetric measurements (adjusted for TIV); 4) measures of clinical and cognitive disability: Expanded Disability Status Scale (EDSS) and Symbol Digit Modality Test (SDMT), respectively.
Results
After quality check, thalamic MTsat, T1-relaxometry, and MWF values were available for 146, 147, and 133 MS patients, and 98, 101, and 97 HCs respectively.Compared to HCs, MS patients exhibited lower MTsat (β=-0.152; p=0.01), higher T1-relaxometry (β=0.192; p=0.002), higher WMF (β=0.161; p=0.007), as well as lower volume (β=-0.622; p<0.0001) in the thalamus.
Thalamic MTsat and MWF were associated with age (β=-0.404; p<0.0001 and β=0.433; p<0.0001 respectively), while there were no associations with sex. Both thalamic MTsat and MWF values were associated with T2LV (β=-0.319; p<0.0001 and β=0.374; p<0.0001 respectively), as well as with the volume of cortical lesions (β=-0.229; p=0.006; β=0.446, p<0.0001 respectively). The association between MWF and cortical lesions remained significant also after adjusting for total T2LV (β=0.347; p=0.0004). Thalamic MTsat and MWF showed an association with TBV, as well as with the volumes of GM, WM, and thalamus, while thalamic T1-relaxometry was associated exclusively with WM volume.
When adjusting for age, thalamic MTsat and T1-relaxometry values were significantly different between RMS and PMS patients (β=0.392; p=0.0002 and β=-0.309; p=0.008 respectively). Thalamic MTsat showed an association with both EDSS (β=-0.289; p=0.005 after adjusting for age), and SDMT Z-score (β=0.268, p=0.01).
Discussion
In this study we found that quantitative MRI measures of thalamic tissue integrity provide an insight into thalamic pathology in MS patients, suggesting ongoing microstructural and myelin loss.The three quantitative metrics investigated proved useful to distinguish between MS patients and HCs. Additionally, thalamic MTsat and T1-relaxometry were significantly different between RMS and PMS patients. Thalamic MTsat and MWF were linked to MS lesion burden, as well as diffuse brain atrophic changes. Furthermore, thalamic MTsat reflected physical and cognitive impairment.
Conclusion
Quantitative MRI measures of thalamic tissue integrity are altered in MS patients with respect to HCs, showing a variable degree of associations with MS lesion burden, brain tissue loss, and clinical measures of physical and cognitive disability.Acknowledgements
No acknowledgement found.References
1) Azevedo CJ, Cen SY, Khadka S, et al. Thalamic atrophy in multiple sclerosis: A magnetic resonance imaging marker of neurodegeneration throughout disease. Ann Neurol. 2018;83(2):223-234. doi:10.1002/ana.25150
2) Vercellino M, Plano F, Votta B, Mutani R, Giordana MT, Cavalla P. Grey matter pathology in multiple sclerosis. J Neuropathol Exp Neurol. 2005;64(12):1101-1107. doi:10.1097/01.jnen.0000190067.20935.42
3) Trapp BD, Peterson J, Ransohoff RM, Rudick R, Mörk S, Bö L. Axonal transection in the lesions of multiple sclerosis. N Engl J Med. 1998;338(5):278-285. doi:10.1056/NEJM199801293380502
4) Haider L, Simeonidou C, Steinberger G, et al. Multiple sclerosis deep grey matter: the relation between demyelination, neurodegeneration, inflammation and iron. J Neurol Neurosurg Psychiatry. 2014;85(12):1386-1395. doi:10.1136/jnnp-2014-307712
5) Witte ME, Mahad DJ, Lassmann H, van Horssen J. Mitochondrial dysfunction contributes to neurodegeneration in multiple sclerosis. Trends Mol Med. 2014;20(3):179-187. doi:10.1016/j.molmed.2013.11.007
6) Helms G, Dathe H, Dechent P. Quantitative FLASH MRI at 3T using a rational approximation of the Ernst equation. Magn Reson Med. Mar 2008;59(3):667-72. doi:10.1002/mrm.21542
7) Helms G, Dathe H, Dechent P. Quantitative FLASH MRI at 3T using a rational approximation of the Ernst equation. Magn Reson Med. Mar 2008;59(3):667-72. doi:10.1002/mrm.21542
8) Rahmanzadeh R, Lu PJ, Barakovic M, et al. Myelin and axon pathology in multiple sclerosis assessed by myelin water and multi-shell diffusion imaging. Brain. 2021;144(6):1684-1696. doi:10.1093/brain/awab088
9) La Rosa F, Abdulkadir A, Fartaria MJ, et al. Multiple sclerosis cortical and WM lesion segmentation at 3T MRI: a deep learning method based on FLAIR and MP2RAGE. Neuroimage Clin. 2020;27:102335. doi:10.1016/j.nicl.2020.102335
10) Puonti O, Iglesias JE, Van Leemput K. Fast and sequence-adaptive whole-brain segmentation using parametric Bayesian modeling. Neuroimage. 2016;143:235-249. doi:10.1016/j.neuroimage.2016.09.011
11) Cerri S, Puonti O, Meier DS, et al. A contrast-adaptive method for simultaneous whole-brain and lesion segmentation in multiple sclerosis. Neuroimage. 2021;225:117471. doi:10.1016/j.neuroimage.2020.117471
12) https://surfer.nmr.mgh.harvard.edu/
13) Paul A. Yushkevich, Joseph Piven, Heather Cody Hazlett, Rachel Gimpel Smith, Sean Ho, James C. Gee, and Guido Gerig. User-guided 3D active contour segmentation of anatomical structures: Significantly improved efficiency and reliability. Neuroimage 2006 Jul 1;31(3):1116-28.
Figures
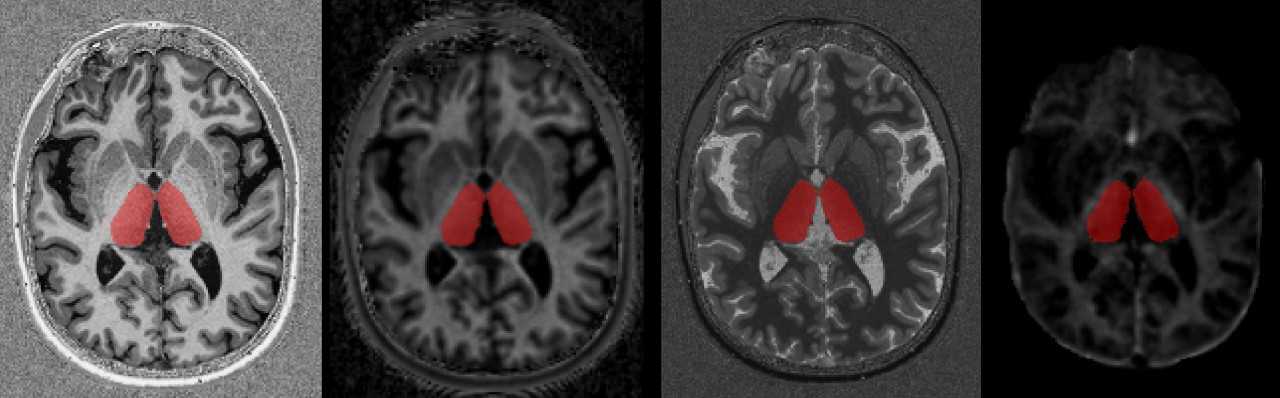
Figure 1. Example of thalamic segmentation in a MS patients. The manually segmented mask is overlayed to different contrasts (from left to right: 1) MP2RAGE; 2) MTsat; 3) T1-relaxometry; 4) MWF).
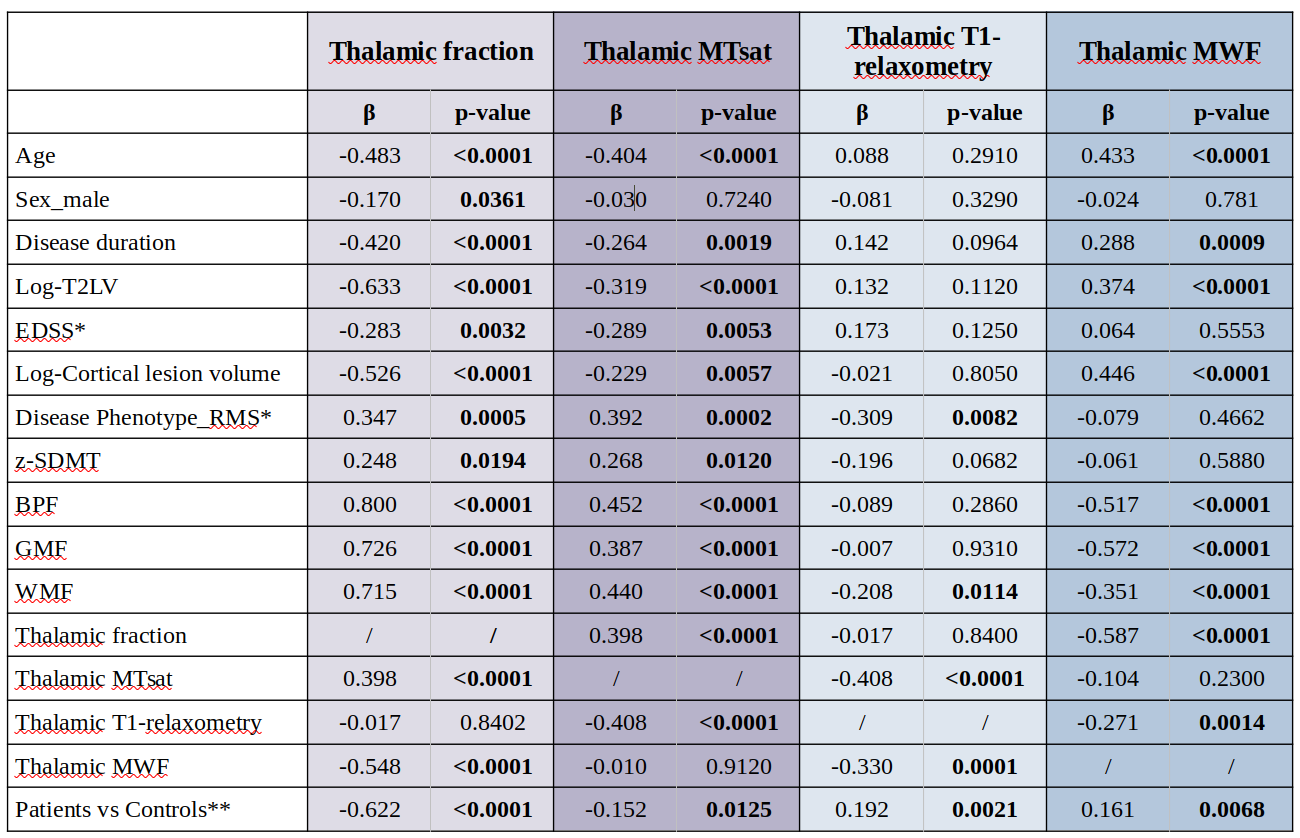
Table 1. Association between 1) thalamic fraction (i.e. ratio between thalamic volume and total intracranial volume), 2) thalamic MTsat, 3) thalamic T1-relaxometry, and 4) thalamic MWF with demographic, conventional MRI and clinical measures in MS patients.
β, standardized beta coefficient; BPF, brain parenchymal fraction; GMF, gray matter fraction; WMF, white matter fraction. *Adjusting for age. **Comparison in full propensity score matched groups for age and sex.