0885
Effect of limited segmentation performance on regional qMRI parameter estimations using FSL FIRST in anatomical regions with poor T1 contrast1Buffalo Neuroimaging Analysis Center, Department of Neurology, Jacobs School of Medicine and Biomedical Sciences at the University at Buffalo, Buffalo, NY, United States, 2IRCCS, Fondazione Don Carlo Gnocchi ONLUS, Milan, Italy, 3Center for Biomedical Imaging, Clinical and Translational Science Institute, The State University of New York, Buffalo, NY, United States, 4Jacobs Multiple Sclerosis Center, Department of Neurology, Jacobs School of Medicine and Biomedical Sciences, University at Buffalo, The State University of New York, Buffalo, NY, United States
Synopsis
Most T1w imaging sequences produce only weak deep gray matter (DGM) contrast compared to iron-sensitive techniques such as QSM. In particular, using multi-modal information in both template generation and brain normalization steps has the potential to result in improved segmentation performance. In this study, we compared FIRST to a custom multi-contrast T1w-QSM atlas segmentation approach for estimating thalamic volumes and susceptibility. Our study suggested that an advanced atlas-based approach may result in better regional segmentations of regions with weak T1w contrast and result in more accurate parameter estimates.
Introduction
Brain’s subcortical structures are a collection of nuclei with distinct morphologies and MR contrast properties, and segmenting them manually in 3D is time-consuming and operator-dependent.1 For this reason, researchers tend to use an automatic segmentation approach.FSL/FIRST is a widely-used model-based segmentation tool for T1-weighted (T1w) images.2 Several imaging studies have benchmarked FSL/FIRST, freesurfer, and manual segmentation.3,4 A study4 comparing FSL/FIRST and freesurfer found that scan-rescan reliability of regional brain volumes was dependent on the size and T1w contrast of the segmented region. Another study5 found that performance of FSL/FIRST was limited in cases with severe atrophy found in multiple sclerosis (MS). Systematic mis-segmentation of brain regions may introduce bias to study outcomes. For example, a volume-dependent bias of average signal intensities may result from segments that include adjacent tissue regions.
Most T1w imaging sequences produce only weak deep gray matter (DGM) contrast compared to iron-sensitive techniques such as QSM. Research has shown that a combination of T1w and QSM contrast may provide benefits in brain analysis.6 In particular, using multi-modal information in both template generation and brain normalization steps has the potential to result in improved segmentation performance.
In this study, we compared FIRST to a custom multi-contrast T1w-QSM atlas segmentation approach for estimating thalamic volumes and susceptibility. Our atlas approach makes simultaneous use of tissue contrast on both T1 and QSM images to achieve optimal brain normalization performance.
Methods
Subjects and data acquisition: We used 160 brain scans acquired at 3 T (GE Signa Excite HD) with an eight-channel head-and-neck coil. We acquired 3D T1-weighted and 3D single-echo spoiled gradient recalled echo (GRE) data (matrix=512x192x64, 0.5x1x2 mm7, flip angle=12°, TE/TR=22ms/40ms, bandwidth=13.89 kHz).QSM: We used best-path unwrapping,8 V-SHARP,9,10 and HEIDI9 for the reconstruction.
Image analysis: We created a custom bi-modal brain template from QSM and T1 scans6 and manually defined the thalamus (Tha). The label was propagated to the QSM space using both QSM and T1w contrast.6 For all labels, we estimated region-average susceptibility and volume.
Results
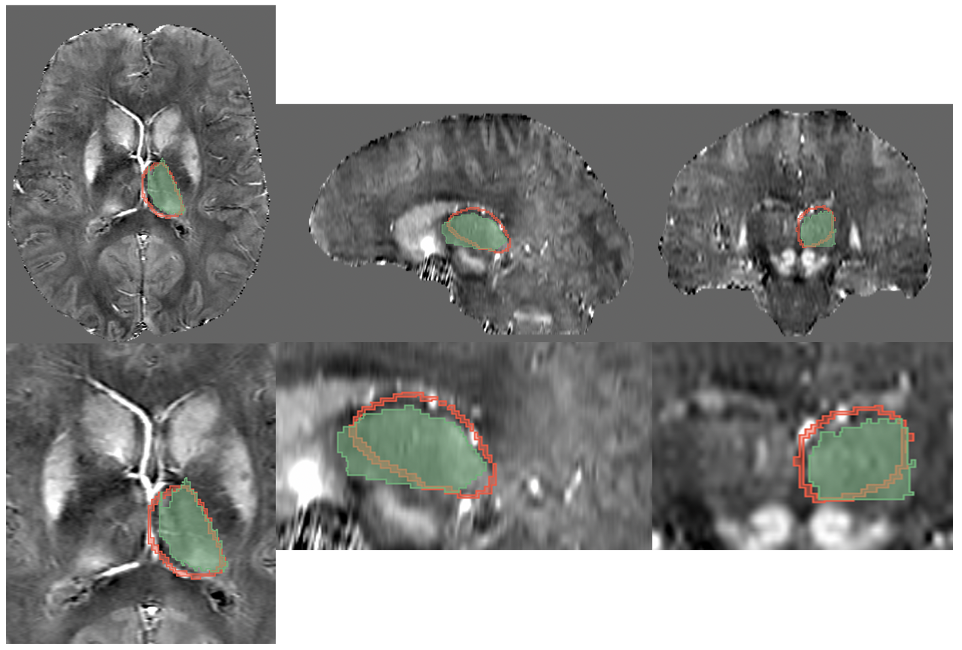
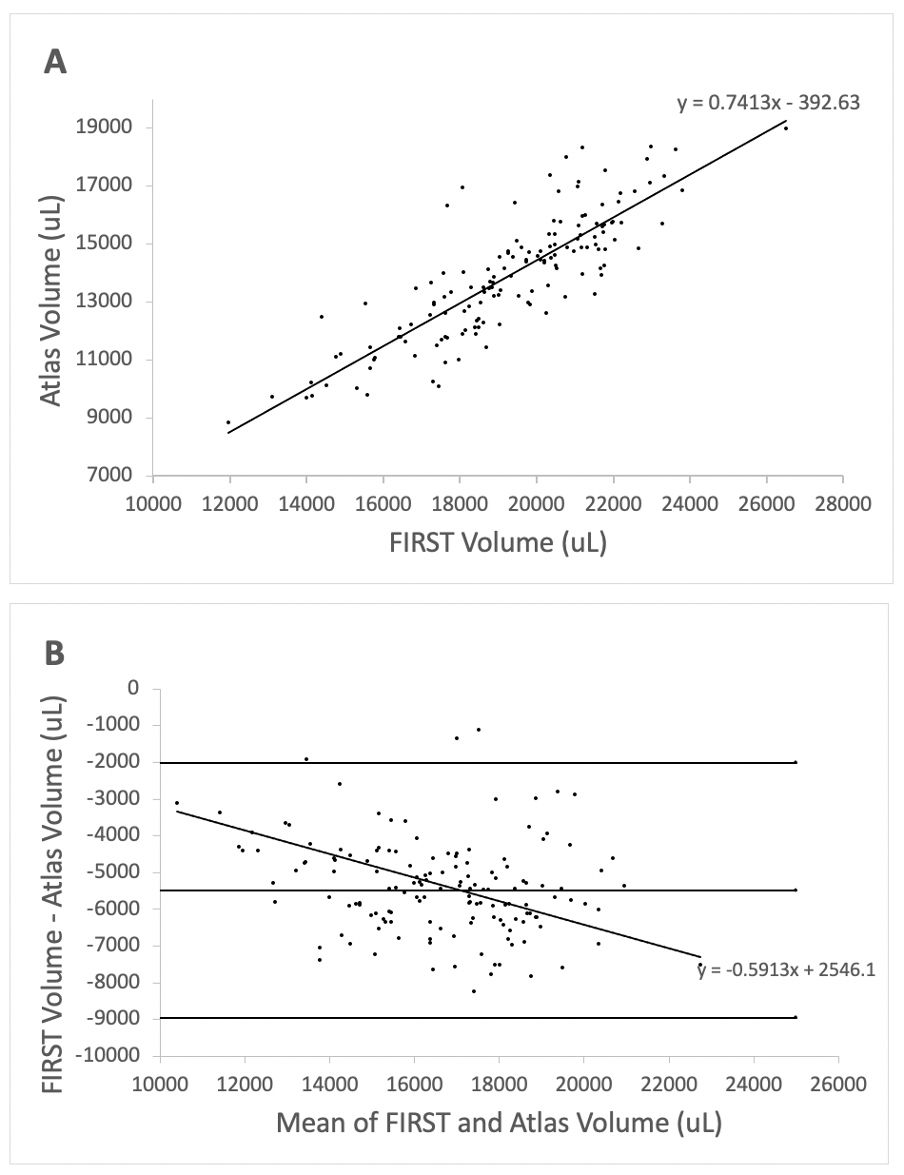
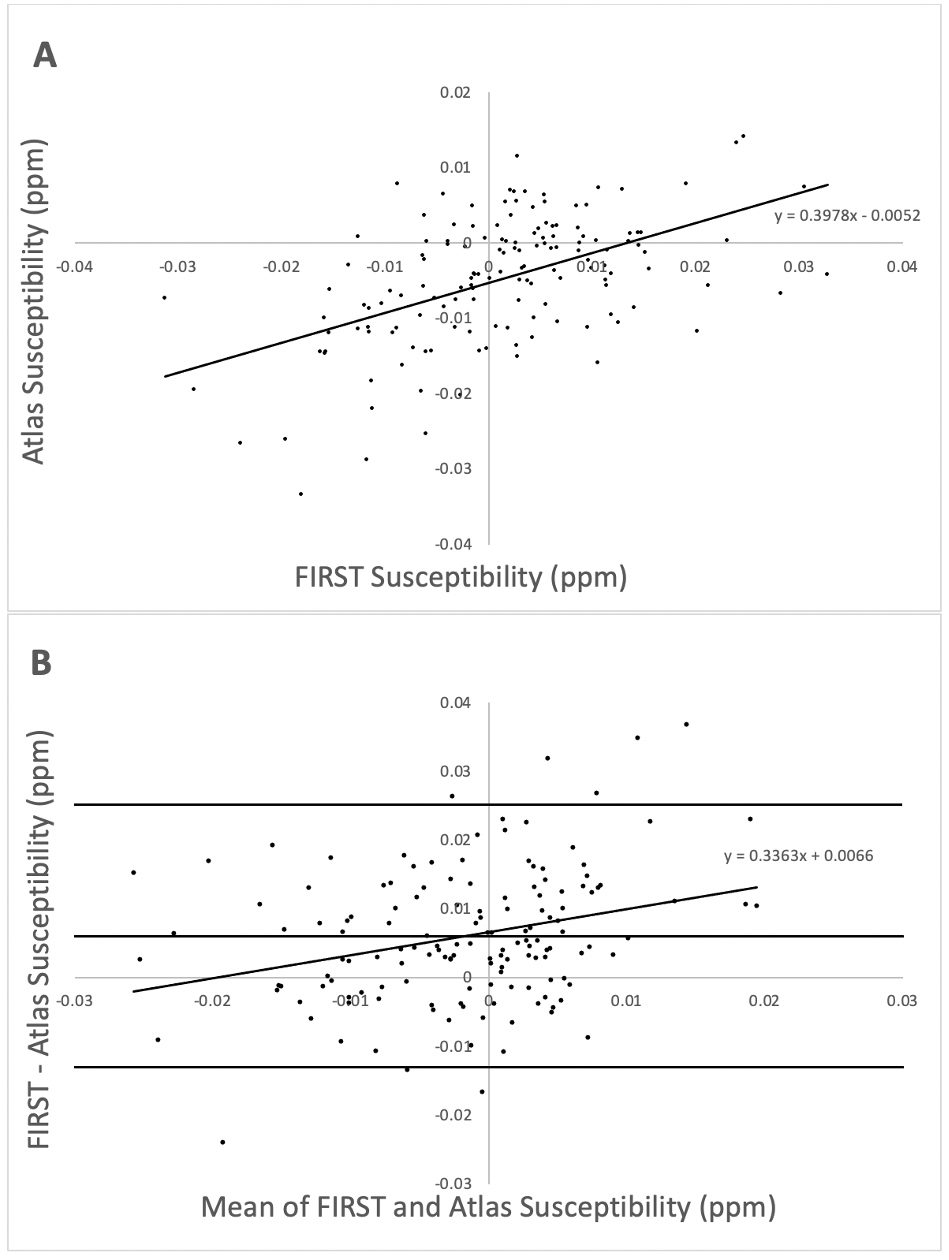
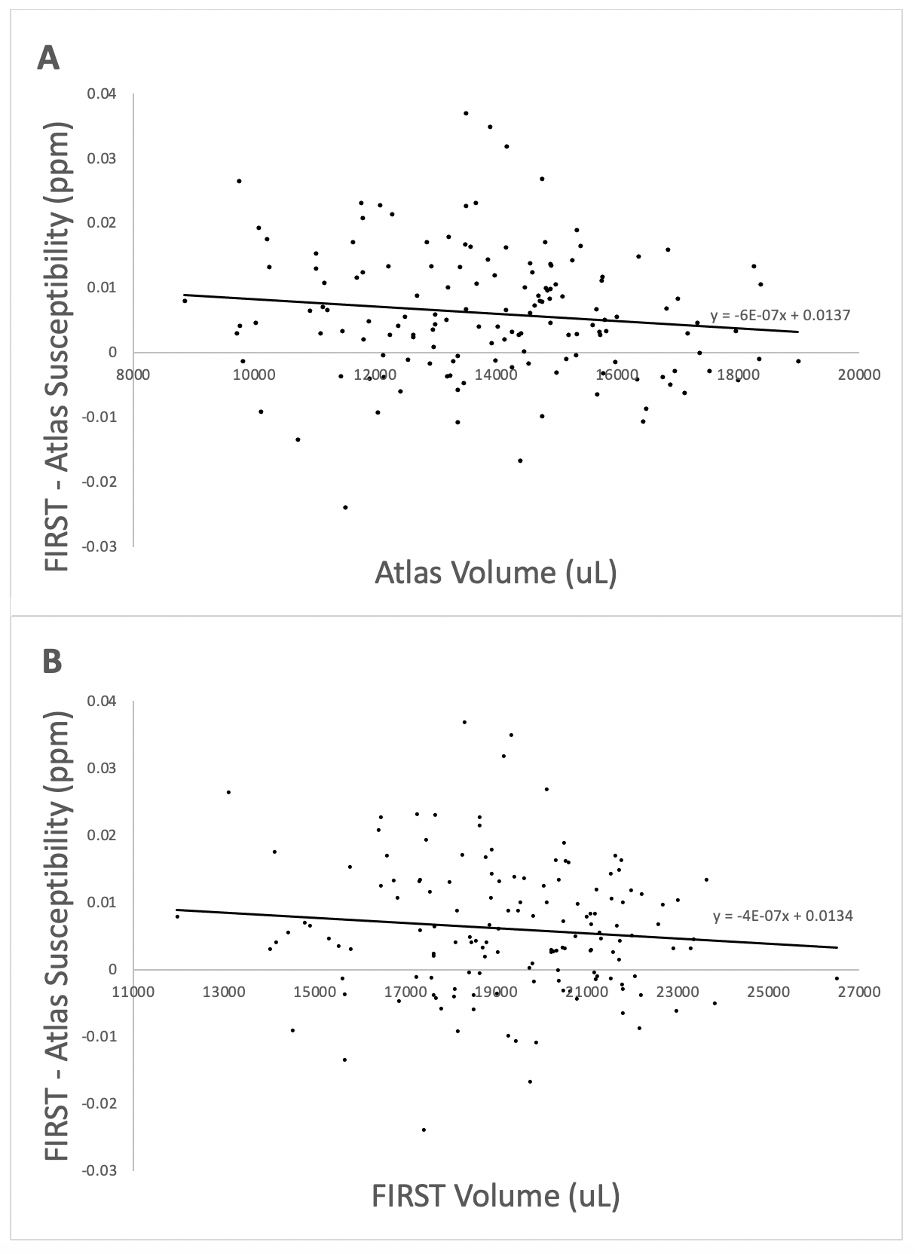
Visual inspection of segmentation labels on the original susceptibility maps showed that FIRST segments often extended into the ventricular space and adjacent tissue regions (Fig. 1). Volumes determined by FSL FIRST and the atlas-based technique are contrasted in Fig. 2, and average susceptibility values obtained with the labels are contrasted in Fig. 3. Volumes were highly correlated (R2=0.85; p<0.001; Fig. 2A) but FIRST volumes were almost 30% greater (5.5ml average) than those from the atlas segmentation (Fig. 2A,B), consistent with the visual inspection. Bland-Altman analysis revealed a small but significant systematic volume-based bias (R2=0.06; p=0.003; Fig. 2B).The correlation of mean thalamic susceptibility values was much lower (R2=0.26; p<0.001; Fig. 3A) than that of the volumes, and values obtained with FIRST were on average 76% greater (+0.05ppb; Fig. 3A,B) than those obtained with the atlas technique. The systematic susceptibility bias due to the FSL FIRST segmentation was small but significant (R2=0.12; p<0.001), as illustrated in Fig. 4.
Discussion
FIRST’s systematic overestimation of thalamic volumes may be attributed to the limited thalamic contrast on T1w images.11 Our study showed that this mis-segmentation resulted in a small (R2=0.12) but significant volume-based bias in estimated susceptibility values. Depending on effect sizes, previous QSM studies that used FIRST for segmentation may have been affected by the segmentation errors and it cannot be excluded that study outcomes were driven by bias from co-existing atrophy in the patient group. Furthermore, segmentation errors are a source of additional variation, which reduces statistical power and may have masked group differences in previous studies.Conclusion
We demonstrated that limitations in FIRST’s segmentation accuracy can give rise to an atrophy-related susceptibility estimation bias. FSL FIRST should be applied with caution for analyzing quantitative parameter maps, such as QSM in the thalamus. Our study suggested that an advanced atlas-based approach may result in better segmentation of regions with weak T1w contrast and result in more accurate parameter estimates.Acknowledgements
Research reported in this publication was partially supported by the National Institute Of Neurological Disorders And Stroke of the National Institutes of Health under Award Number R01NS114227 and the National Center for Advancing Translational Sciences of the National Institutes of Health under Award Number UL1TR001412. The content is solely the responsibility of the authors and does not necessarily represent the official views of the National Institutes of Health.References
1. Visser, E., Keuken, M. C., Douaud, G., Gaura, V., Bachoud-Levi, A.-C., Remy, P., Forstmann, B. U., & Jenkinson, M. Automatic segmentation of the striatum and globus pallidus using MIST: Multimodal image segmentation tool. NeuroImage, 125, 479–497 (2016).
2. Patenaude, B., Smith, S.M., Kennedy, D., and Jenkinson M. A Bayesian Model of Shape and Appearance for Subcortical Brain NeuroImage, 56(3):907-922 (2011).
3. Morey et al. A comparison of automated segmentation and manual tracing for quantifying hippocampal and amygdala volumes. NeuroImage 45, 855–866 (2009).
4. C Nugent, A et al. Automated Subcortical Segmentation Using FIRST: Test–Retest Reliability, Inter-scanner Reliability, and Comparison to Manual Segmentation. Hum Brain Mapp. 2013 Sep; 34(9):2313-29.
5. Feng, X et al. An improved FSL-FIRST pipeline for subcortical gray matter segmentation to study abnormal brain anatomy using quantitative susceptibility mapping (QSM). Magn Reson Imaging. 2017 Jun; 39:110-122.
6. Hanspach, J. et al. Methods for the computation of templates from quantitative magnetic susceptibility maps (QSM): Toward improved atlas- and voxel-based analyses (VBA). J Magn Reson Imaging 46, 1474–1484 (2017).
7. Hernández‐Torres, E. et al. Increased mean R2* in the deep gray matter of multiple sclerosis patients: Have we been measuring atrophy? J. Magn. Reson. Imaging 50, 201–208 (2019).
8. Abdul-Rahman, H. S. et al. Fast and robust three-dimensional best path phase unwrapping algorithm. Appl Opt 46, 6623–35 (2007).
9. Schweser, F., Sommer, K., Deistung, A. & Reichenbach, J. R. Quantitative susceptibility mapping for investigating subtle susceptibility variations in the human brain. NeuroImage 62, 2083–2100 (2012).
10. Wu, B., Li, W., Avram, A. V., Gho, S.-M. & Liu, C. Fast and tissue-optimized mapping of magnetic susceptibility and T2* with multi-echo and multi-shot spirals. NeuroImage 59, 297–305 (2012).
11. Burggraaff, J. et al, Manual and automated tissue segmentation confirm the impact of thalamus atrophy on cognition in multiple sclerosis: A multicenter study. NeuroImage: Clinical Volume 29, 102549 (2021).
Figures