0884
QSMRim-Net: Fusing Radiomic and Convolutional Features for Identification of Chronic Active MS Lesions on Quantitative Susceptibility Maps1Electrical & Computer Engineering, Cornell University, New York, NY, United States, 2Biomedical Engineering, Cornell University, New York, NY, United States, 3Department of Radiology, Cornell University, New York, NY, United States, 4Cornell University, New York, NY, United States, 5Department of Population Health Sciences, Cornell University, New York, NY, United States
Synopsis
Chronic active multiple sclerosis (MS) lesions are characterized on Quantitative susceptibility mapping (QSM) by a paramagnetic rim (rim+) at the edge of the lesion. We present QSMRim-Net, a deep neural network that fuses lesion-level radiomic and convolutional image features together for automated identification of rim+ lesions on MRI. On the lesion-level, using five-fold cross validation, the proposed QSMRim-Net detected rim+ lesions with an area under the receiver operating characteristic curve of 0.965 and an area under the precision recall curve of 0.655. QSMRim-Net out-performed other state-of-the-art methods on both metrics.
Introduction
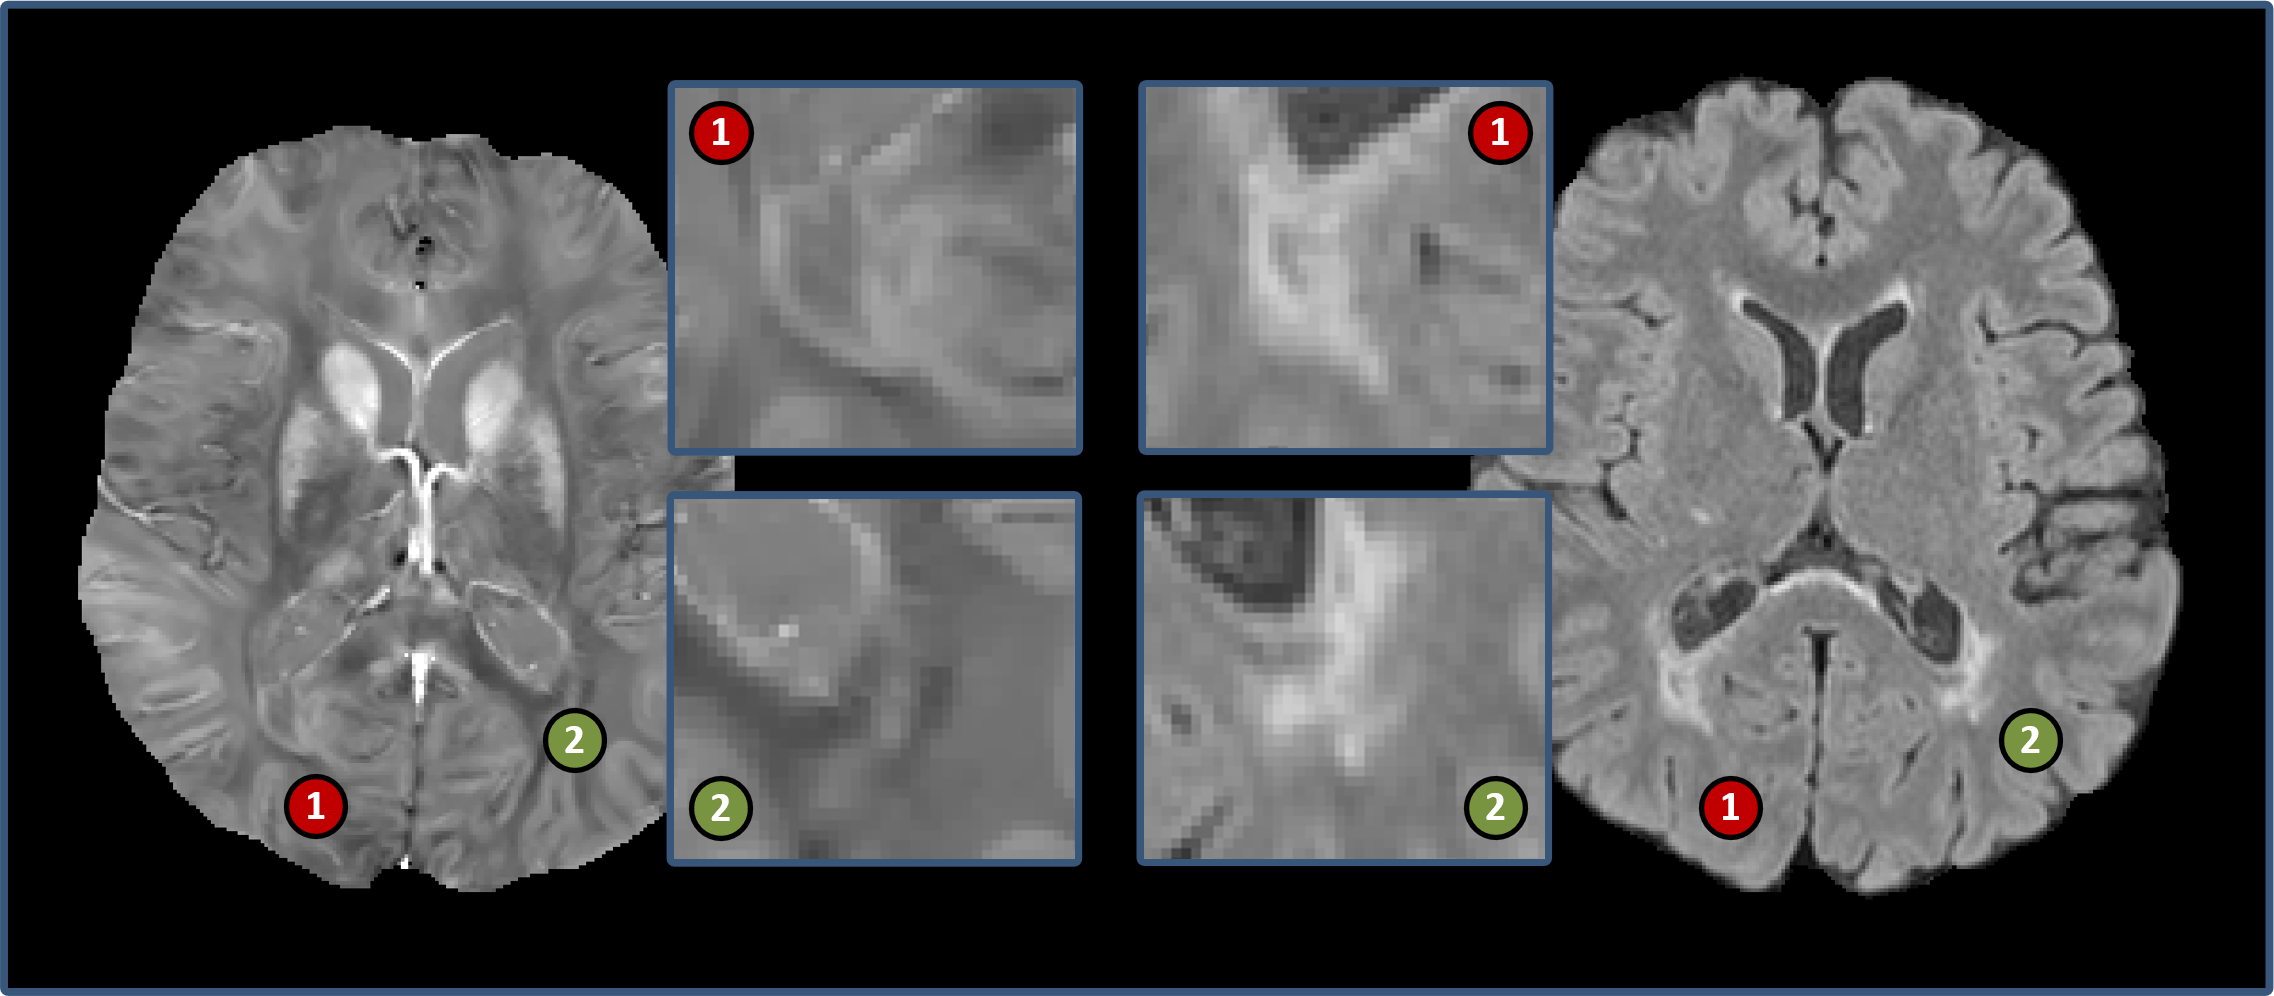
Multiple sclerosis (MS) is an inflammatory disease of the central nervous system, characterized by lesions in the brain and spinal cord [1]. A particular type of MS lesion, called a chronic active lesion, is characterized by an iron-enriched rim of activated macrophages and microglia in histopathology studies [2,3], the presence of which is associated with a more severe disease course [4,5]. Precise identification of these lesions is important for clinical translation, such as using rim+ lesions as an imaging biomarker.Chronic active lesions (rim+) lesions are typically identified on T2-weighted-Fluid-Attenuated Inversion Recovery (T2-FLAIR) images and then are determined to be rim+ through visual inspection on QSM. However, this process is time-consuming and prone to inter- and intra- rater variability. We propose an automated method, called QSMRim-Net, to identify rim+ lesions using QSM [6] and T2-FLAIR images of the brain (see Fig. 1 for an image example). Our method is a two-branch neural network architecture that fuses QSM and T2-FLAIR imaging features derived from a recently developed residual network [7] with lesion-level radiomic features from the QSM. This is the first method proposed in the literature to identify rim+ lesions using QSM and the first method to fuse convolutional imaging features with radiomic features. We will compare QSMRim-Net with two other recent methods [12,13].
Materials and Methods
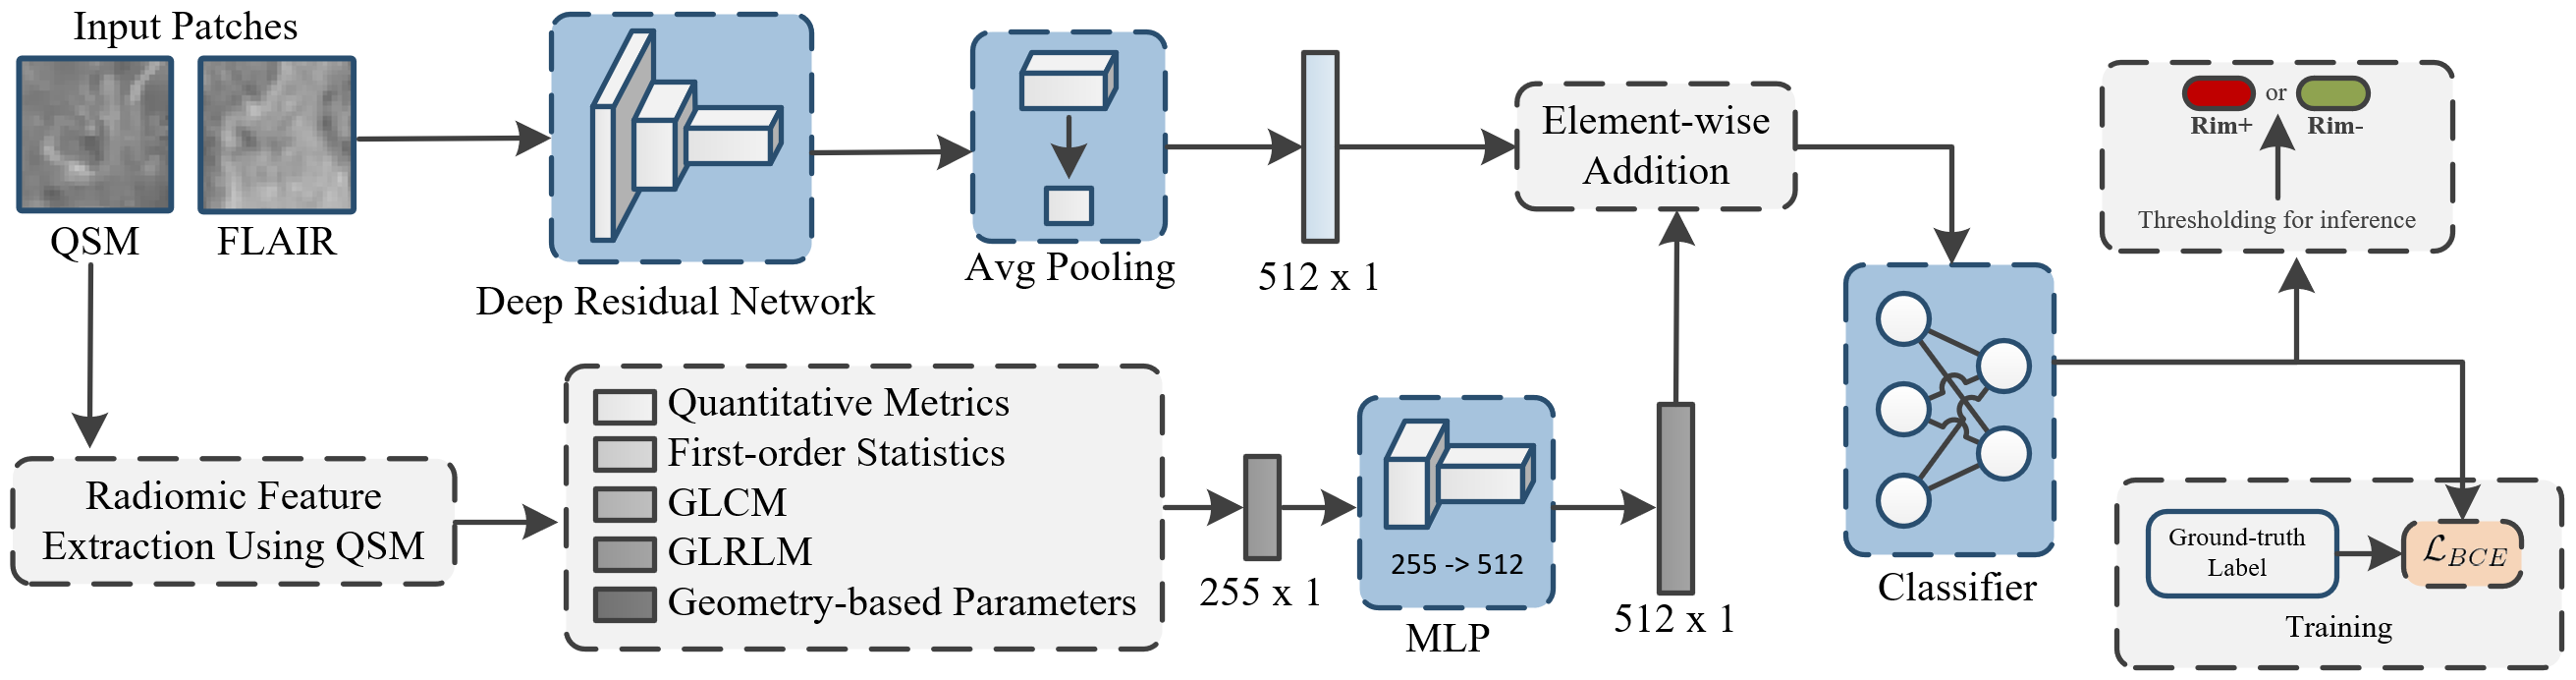
Dataset: QSMRim-Net was evaluated on an MS imaging dataset collected at Weill Cornell, consisting of 172 MS patients enrolled in an ongoing prospective database for MS research. Standard whole-brain FLAIR (1 mm isotropic) and QSM () images were acquired on a 3T Magnetom Skyra scanner (Siemens Medical Solutions, Malvern, PA, USA). Rim+ and rim- (MS lesions that are not rim+) lesions were annotated by two human experts, followed the consensus of a third reviewer. After the rim lesion annotation, 177 lesions were identified as rim+ lesions and 3,986 lesions were identified as rim- lesions.Network Architecture: QSMRim-Net is a two-branch network consisting of three parts: a convolutional network for image feature extraction, a fully connected network for radiomic feature extraction, and a final classifier that outputs the probability that a lesion is rim+ (see Fig. 2). For image feature extraction, we use a deep residual network [7] with 18 layers as our backbone network. We modified the convolutional kernels from 2D to 3D, use two input channels to accommodate the QSM and T2-FLAIR, and use two categories (rim+ and rim-) for the last linear layer. For radiomic feature extraction, radiomic features were calculated on the QSM (described in detail in the section below). The fully connected network for radiomic feature extraction consists of two fully connected layers. The first layer is a linear layer followed by a one-dimensional batch normalization [8], a Swish activation function [9] and a dropout layer. The second layer has the same structure as the first layer, but does not include the dropout layer. To fuse the convolutional and radiomic features, we performed element-wise addition for feature vectors from both the output of the residual network and the fully connected network and processed the new feature vector with another fully connected layer (see classifier in Fig. 2).
Radiomic Feature Analysis: Radiomic features have been shown to be effective in many applications of medical image analysis[ES1] . For QSMRim-Net, radiomic features were calculated over each lesion using the RIA R package [10,11]. Specifically, we calculated five different types of radiomic features: 1) conventional quantitative metrics such as mean intensity and lesion volume, 2) first-order statistics such as harmonic mean and geometric mean, 3) gray-level co-occurrence matrix (GLCM) statistics such as interquartile range and energy sum, 4) gray-level run-length matrix (GLRLM) statistics such as run percentage, and 5) geometric-based parameters such as ratio of lesion surface to volume. In total, 255 radiomic features were calculated over each lesion on the QSM for our model. [ES1]Cite: (Coroller et al., 2016, Liu et al., 2016, Bakas et al., 2017, Sweeney et al., 2021).
Evaluations: Two automated methods, RimNet [12] and APRL [13], have been developed to identify chronic active lesions on T2* phase imaging. Therefore, for use with our data, we adapted these methods to a QSM implementation. More specifically, we implemented three methods for performance comparison: 1) APRL (RF): original APRL method using radiomic features and a random forest; 2) APRL (NN): APRL (RF) method with the random forest replaced by a neural network; 3) RimNet: a multi-model VGG-Net using image features. We used receiver operating characteristic (ROC) curves, precision-recall (PR) curves, F1 score, accuracy, sensitivity, specificity, and PPV as metrics for performance evaluation.
Results
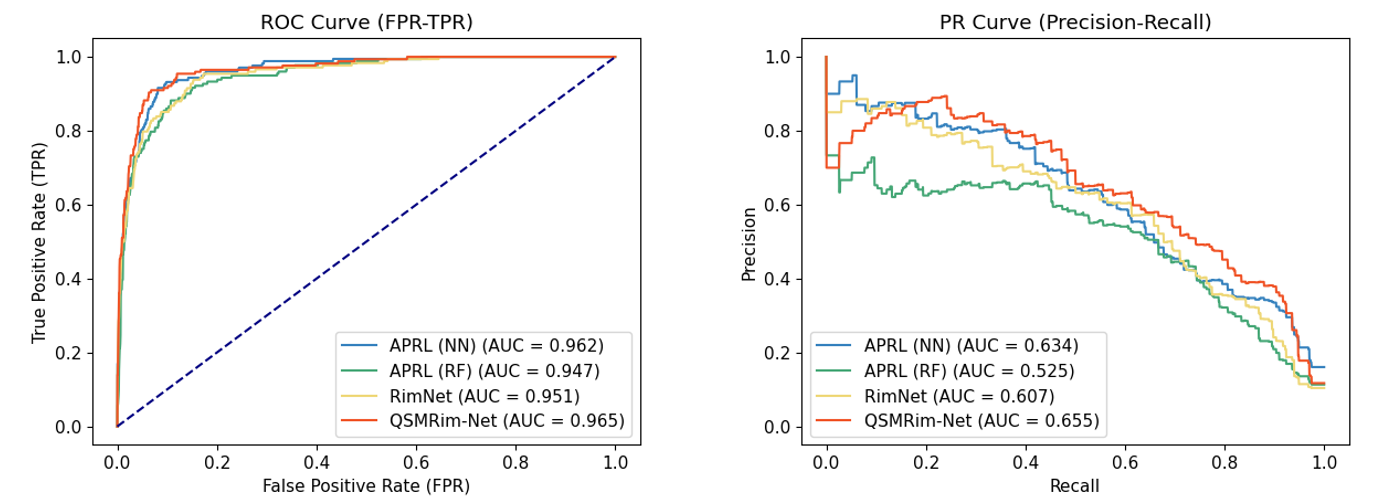
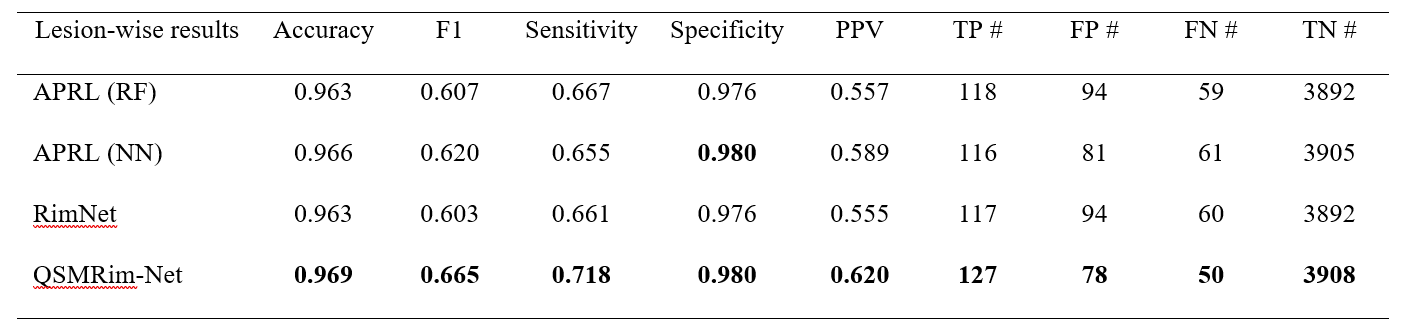
Fig. 4 shows the lesion-wise performance metrics of the proposed QSMRim-Net and the other methods. QSMRim-Net outperformed the competitors in all metrics used for evaluation. With a similar overall accuracy and specificity with other methods, QSMRim-Net resulted in a 10.3% and 9.6% improvement in F1 score, 8.6% and 7.6% improvement in sensitivity and 11.7% and 11.3% improvement in PPV compared to Rim-Net and APRL , respectively. Fig. 3 shows the ROC curves and the PR curves for different methods. The proposed QSMRim-Net has a higher AUC for both the ROC and PR curves than the other methods, indicating improved rim+ lesion identification performance.Acknowledgements
No acknowledgement found.References
[1] Sahraian, M. A. and E.-W. Radue (2008). Multiple Sclerosis and Brain Atrophy. MRI Atlas of MS Lesions. E.-W. Radü and M. A. Sahraian. Berlin, Heidelberg, Springer Berlin Heidelberg: 95-102.
[2] Absinta, M., et al. (2016). "Persistent 7-tesla phase rim predicts poor outcome in new multiple sclerosis patient lesions." The Journal of clinical investigation 126(7): 2597-2609.
[3] Gillen, K. M., et al. (2021). "QSM is an imaging biomarker for chronic glial activation in multiple sclerosis lesions." Annals of Clinical Translational Neurology 8(4): 877-886.
[4] Absinta, M., et al. (2019). "Association of chronic active multiple sclerosis lesions with disability in vivo." JAMA neurology 76(12): 1474-1483.
[5] Marcille, M., et al. (2021). "Disease correlates of quantitative susceptibility mapping rim lesions in multiple sclerosis." medRxiv.
[6] Wang, Y. and T. Liu (2015). "Quantitative susceptibility mapping (QSM): decoding MRI data for a tissue magnetic biomarker." Magnetic resonance in medicine 73(1): 82-101.
[7] He, K., et al. (2016). Deep residual learning for image recognition. Proceedings of the IEEE conference on computer vision and pattern recognition.
[8] Ioffe, S. and C. Szegedy (2015). Batch normalization: Accelerating deep network training by reducing internal covariate shift. International conference on machine learning, PMLR.
[9] Ramachandran, P., et al. (2017). "Searching for activation functions." arXiv preprint arXiv:.05941.
[10] Kolossváry, M., et al. (2017). "Radiomic features are superior to conventional quantitative computed tomographic metrics to identify coronary plaques with napkin-ring sign." Circulation: Cardiovascular Imaging 10(12): e006843.
[11] Kolossváry, M., et al. (2018). "Cardiac computed tomography radiomics." Journal of thoracic imaging 33(1): 26-34.
[12] Barquero, G., et al. (2020). "RimNet: A deep 3D multimodal MRI architecture for paramagnetic rim lesion assessment in multiple sclerosis." NeuroImage: Clinical 28: 102412.
[13] Lou, C., et al. (2021). "Fully automated detection of paramagnetic rims in multiple sclerosis lesions on 3T susceptibility-based MR imaging." NeuroImage: Clinical: 102796.
Figures