0883
Correlations of inflammation metrics from multi echo T2 relaxation and multi-shell diffusion imaging in multiple sclerosis1Physics and Astronomy, University of British Columbia, Vancouver, BC, Canada, 2International Collaboration on Repair Discoveries, University of British Columbia, Vancouver, BC, Canada, 3Montreal Neurological Institute - Hospital, McGill University, Montreal, QC, Canada, 4Medicine, University of British Columbia, Vancouver, BC, Canada, 5Radiology, University of British Columbia, Vancouver, BC, Canada, 6Imaging Physics, MD Anderson Cancer Center, Houston, TX, United States, 7School of Biomedical Engineering, University of British Columbia, Vancouver, BC, Canada, 8Pathology & Laboratory Medicine, University of British Columbia, Vancouver, BC, Canada, 9Radiology, Washington University, St. Louis, MO, United States
Synopsis
Inflammation is a key component in multiple sclerosis (MS) pathology. Quantitative MRI metrics reflecting inflammation are important for understanding disease processes in vivo. Metrics from multi-echo T2 relaxation, Diffusion Basis Spectrum Imaging (DBSI) and Neurite Orientation Dispersion and Density Imaging (NODDI) were compared in participants with MS and healthy controls. NODDI neurite density index and DBSI restricted fraction were correlated and may be sensitive to similar pathology. GMT2 correlated negatively with cellularity, but positively with oedema, suggesting oedema may be a key mechanism driving GMT2 increases. Our findings support a complementary T2 and diffusion approach to probe inflammation in MS.
Background
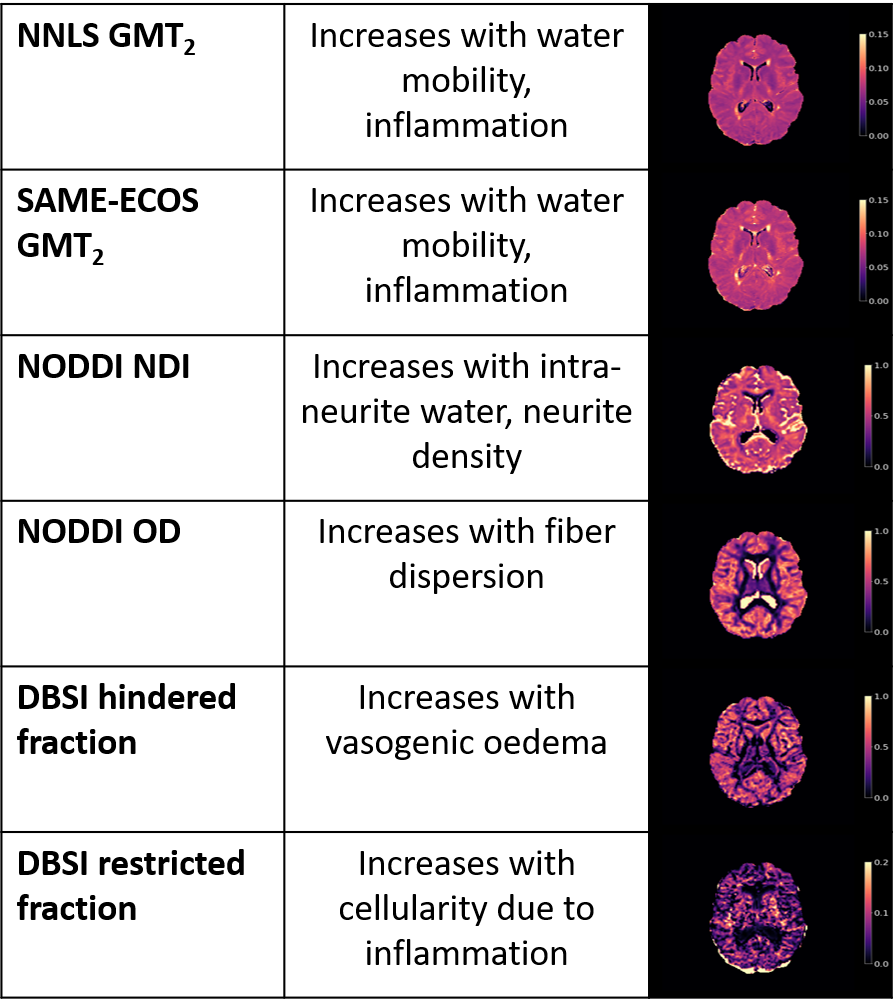
Inflammation, manifested as increased cellularity and oedema, is common in multiple sclerosis (MS) lesions and may contribute to demyelination and axon damage1. Quantitative MRI metrics reflecting inflammation could facilitate tracking disease progression and treatment response. Various techniques have been proposed to assess inflammation, but how these techniques relate to each other has not been explored in detail.Multi-echo T2 relaxation quantifies water T2 decay time in various compartments based on local environment. The Geometric Mean T2 (GMT2) of the intra/extracellular pool is thought to increase when more water is present due to inflammation2, with lesions having a higher GMT2 than normal-appearing white matter (NAWM)3. T2 spectrum analysis most commonly uses a regularized Non-Negative Least Squares (NNLS) approach4,5; recently a new machine learning method has been proposed (Spectrum Analysis for Multiple Exponentials via Experimental Condition Oriented Simulation (SAME-ECOS)) which is more robust than NNLS in the presence of noise6.
Inflammation-related metrics can also be derived from multi-shell diffusion imaging, which models diffusion characteristics for various water pools: Neurite Orientation Dispersion and Density Imaging (NODDI) distinguishes 3 water environments (intracellular, extracellular, cerebrospinal fluid (CSF)) and fits for their different contributions to the overall signal7,8. NODDI metrics include neurite density index (NDI, neurite (axons+dendrites) measure, decreases with less neurites), and orientation dispersion (OD, increases with fiber dispersion)8. Diffusion Basis Spectrum Imaging (DBSI) models different diffusion tensors that represent myelinated and unmyelinated axons, restricted diffusion, nonrestricted diffusion, and CSF8. DBSI metrics include restricted fraction (increases with cellularity), and hindered fraction (increases with extracellular oedema)8,9.
Investigating how inflammation metrics from different imaging and analysis techniques are related can provide information about how different microstructure changes relate to pathology. Our objective was to assess pair-wise correlations between MRI metrics putatively reflecting inflammation: (1) NNLS GMT2, (2) SAME-ECOS GMT2, (3) NODDI NDI, (4) NODDI OD, (5) DBSI restricted fraction, (6) DBSI hindered fraction in normal (controls) and normal-appearing (MS) white matter and MS lesions.
Methods
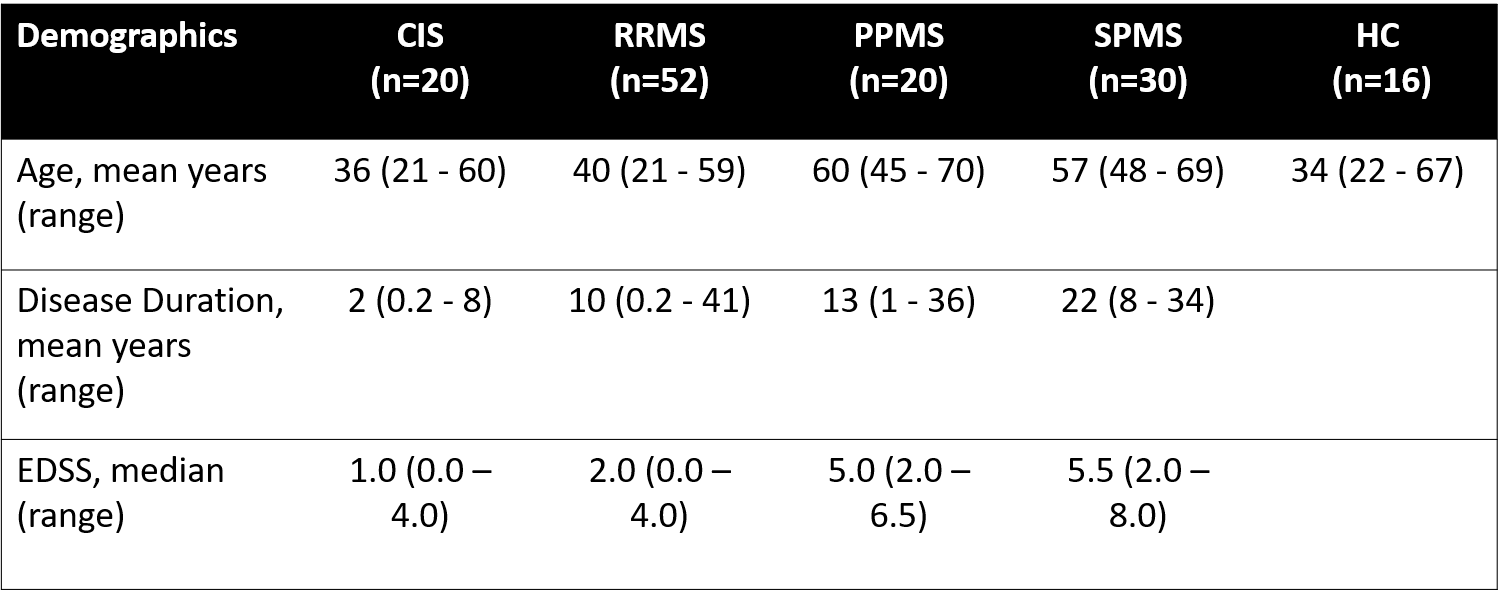
Data Collection: Sixteen healthy controls (HC) and 122 MS (demographics in Figure 1) had 3T (Philips Achieva) scans: 48-echo Gradient and Spin Echo (TR/TE=1073/8ms, resolution = 1x1x2.5mm3)10, diffusion (99 directions, b values = 0–1500, TR/TE=4798/79ms, voxel size = 2×2×2mm3)11, 3DT1 (TR/TE/TI=3000/3.5/926ms, resolution = 1x1x1mm3), and proton-density/T2-weighted (TR/TE1/TE2=2900/8.42/80ms, resolution = 1x1x3mm3). MS participants were recruited from 2 studies using the same MRI protocol.Analysis: Voxel-wise GMT2 maps of the intra/extracellular pool (spectrum weighted mean 40ms< T2 < 200ms) were made with NNLS4,5 and SAME-ECOS6. Diffusion data was eddy current corrected and smoothed (FSL12). NODDI NDI and OD maps were made using the NODDI algorithm with AMICO13. DBSI restricted and hindered fraction maps were made with in-house MATLAB software11. All maps were registered to 3DT1 space. CSF masks were made using thresholded diffusion b0 images. Lesion masks were segmented using seed points on the PD/T214, then registered to 3DT1 space. HC white matter (WM) and MS NAWM masks were made using FAST15 on the 3DT1; lesion and CSF masks were subtracted. Masks were overlaid on registered MRI metric maps to obtain mean WM, NAWM and lesion values. Pairwise Pearson correlations assessed relationships between MRI metrics (significance p < 0.05).
Results and Discussion
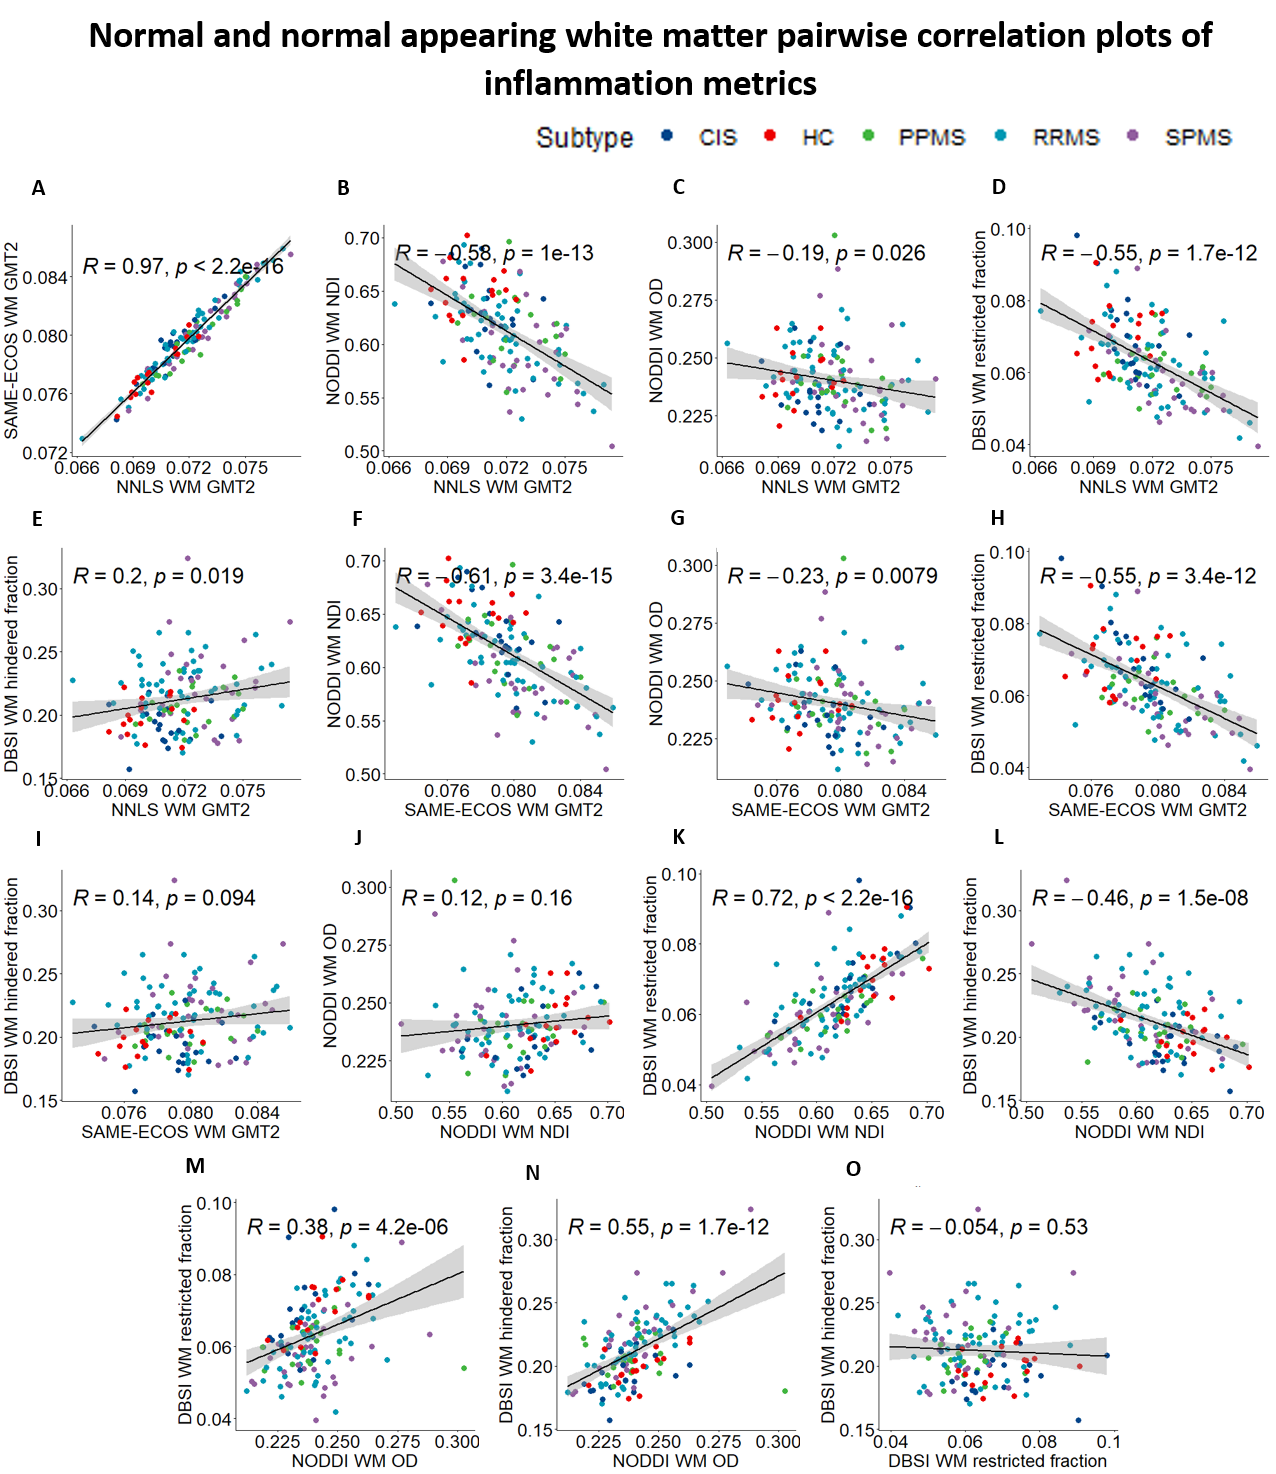
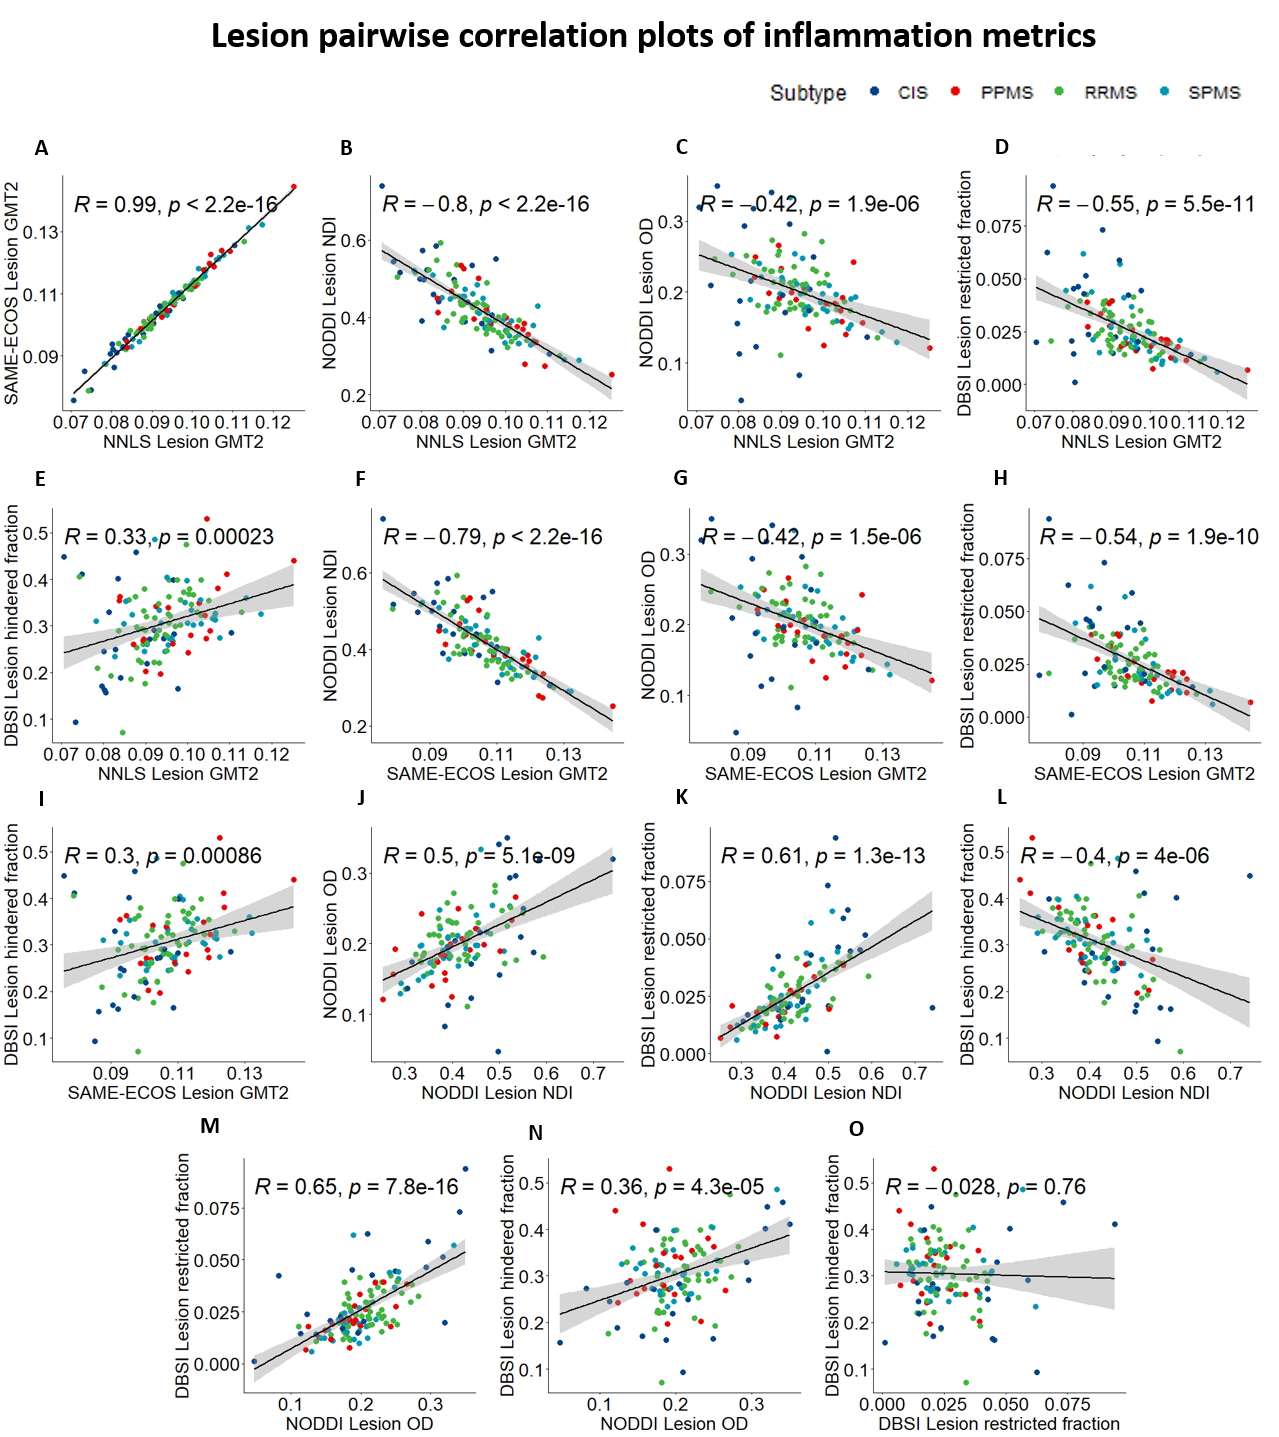
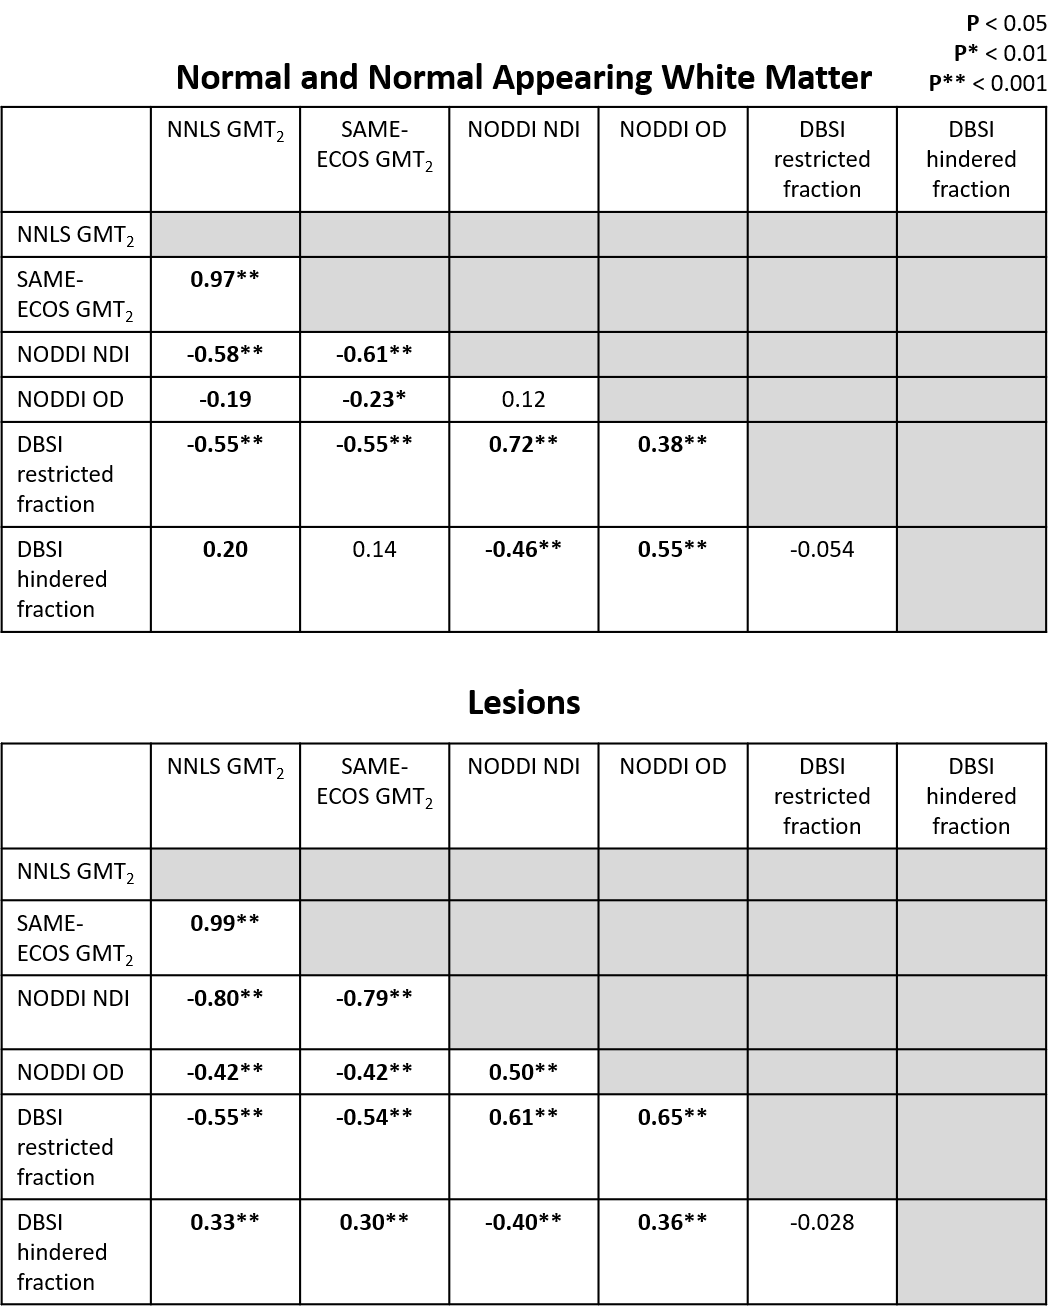
Representative maps are displayed in Figure 2. Correlation plots of pair-wise inflammation metric comparisons are displayed in Figures 3 and 4. Correlation coefficients (R) are summarized in Figure 5.NNLS and SAME-ECOS GMT2 correlated strongly with each other, and similarly with other metrics.
GMT2 correlated negatively with NODDI NDI in both white matter and lesions with stronger correlation in the lesions, suggesting increased water mobility is related to decreased neurite density. GMT2 also correlated negatively with restricted fraction in white matter and lesions, but positively with hindered fraction. A longer GMT2 with less cellularity suggests other sources of water (likely oedema) are present that increase T2 time. In line with this, the positive GMT2-hindered fraction relationship was stronger in lesions, suggesting that oedema/tissue loss underlies GMT2 increases as water becomes more mobile. GMT2 negatively correlated with NODDI OD, suggesting that increased water mobility was related to a decrease in fiber dispersion. This somewhat counterintuitive observation may be due to axonal loss affecting OD interpretations16.
NODDI NDI and DBSI restricted fraction correlated positively in white matter and lesions. The relationship between restricted fraction and fiber density (NDI) would depend on the lesion pathology. If inflammatory cells reduce with disease, as demonstrated by DBSI restricted fraction decreasing from CIS to progressive MS17, fiber density may still be low if axons are lost and/or oedema persists. NODDI OD correlated with DBSI restricted and hindered fraction in white matter and lesions, which may indicate increases in inflammation-related isotropic diffusion are linked to reduced fiber coherence.
Conclusion
Strong positive correlations were observed between DBSI cellularity and NODDI NDI, which may be due neurite loss after cellularity has decreased. GMT2 negatively correlated with DBSI cellularity, but positively correlated with oedema, suggesting oedema may be a dominant mechanism driving increases in GMT2. The relationships and accuracy of inflammation metrics require further investigation using phantom and histopathology studies to definitively characterize how MRI metrics correspond to tissue microstructure changes in MS.Acknowledgements
The collection of the data was funded by the MS Society of Canada and F. Hoffman La Roche. TSJ was funded by an UBC MS Connect Summer Studentship Award funded from the Christopher Foundation and an endMS Master’s Studentship award from the Multiple Sclerosis Society of Canada. Thank you to the MRI technologists at the UBC MRI Research Center, the neurologists and staff at the UBC MS Clinic, as well as the study participants and their families. This work was conducted on the traditional, ancestral, and unceded territories of Coast Salish Peoples, including the territories of the xwməθkwəy̓əm (Musqueam), Skwxwú7mesh (Squamish), Stó:lō and Səl̓ílwətaʔ/Selilwitulh (Tsleil- Waututh) Nations.References
1. Stadelmann C, Wegner C, Brück W. Inflammation, demyelination, and degeneration — Recent insights from MS pathology. Biochimica et Biophysica Acta (BBA) - Molecular Basis of Disease. 2011;1812(2):275-282. doi:10.1016/j.bbadis.2010.07.007
2. Liu H, Ljungberg E, Dvorak AV, et al. Myelin Water Fraction and Intra/Extracellular Water Geometric Mean T 2 Normative Atlases for the Cervical Spinal Cord from 3T MRI. Journal of Neuroimaging. 2019;30(1):50-57. doi:10.1111/jon.12659
3. Laule C, Vavasour IM, Kolind SH, et al. Long T2 water in multiple sclerosis: What else can we learn from multi-echo T2 relaxation? Journal of Neurology. 2007;254(11):1579-1587. doi:10.1007/s00415-007-0595-7
4. Whittall KP, Mackay AL. Quantitative interpretation of NMR relaxation data. Journal of Magnetic Resonance (1969). 1989;84(1):134-152. doi:10.1016/0022-2364(89)90011-5.
5. Prasloski T, Mädler B, Xiang Q-S, Mackay A, Jones C. Applications of stimulated echo correction to multicomponent T 2 analysis. Magnetic Resonance in Medicine. 2011;67(6):1803-1814. doi:10.1002/mrm.23157
6. Liu H, Joseph TS, Xiang Q-S, et al. A data-driven T2 relaxation analysis approach for myelin water imaging: Spectrum analysis for multiple exponentials via experimental condition oriented simulation (SAME-ECOS). Magn Reason Med. 2021. doi: 10.1002/mrm.29000
7. Zhang H, Schneider T, Wheeler-Kingshott CA, Alexander DC. NODDI: Practical in vivo neurite orientation dispersion and density imaging of the human brain. NeuroImage. 2012;61(4):1000-1016. doi:10.1016/j.neuroimage.2012.03.072
8. Lakhani DA, Schilling KG, Xu J, Bagnato F. Advanced Multicompartment Diffusion MRI Models and Their Application in Multiple Sclerosis. AJNR Am J Neuroradiol. 2020;41(5):751-757. doi:10.3174/ajnr.A6484
9. Wang X, Cusick MF, Wang Y, et al. Diffusion basis spectrum imaging detects and distinguishes coexisting subclinical inflammation, demyelination and axonal injury in experimental autoimmune encephalomyelitis mice. NMR in Biomedicine. 2014;27(7):843-852. doi:10.1002/nbm.3129
10. Oshio K, Feinberg DA. GRASE (Gradient-and Spin-Echo) imaging: A novel fast MRI technique. Magnetic Resonance in Medicine. 1991;20(2):344-349. doi:10.1002/mrm.1910200219
11. Wang Y, Wang Q, Haldar JP, et al. Quantification of increased cellularity during inflammatory demyelination. Brain. 2011;134(12):3590-3601. doi:10.1093/brain/awr307
12. Jenkinson M, Beckmann CF, Behrens TEJ, et al. FSL. Neuroimage. 2012; 62(2): 782–790. doi: 10.1016/j.neuroimage.2011.09.015.
13. Daducci A, Canales-Rodríguez EJ, Zhang H, Dyrby TB, Alexander DC, Thiran J-P. Accelerated Microstructure Imaging via Convex Optimization (AMICO) from diffusion MRI data. NeuroImage. 2015;105:32-44. doi:10.1016/j.neuroimage.2014.10.026
14. McAusland J, Tam RC, Wong E, Riddehough A, Li DK. Optimizing the use of radiologist seed points for improved multiple sclerosis lesion segmentation. IEEE Trans Biomed Eng. 2010;57(11). doi: 10.1109/TBME.2010.2055865.
15. Zhang, Y, Brady, M, Smith, S. Segmentation of brain MR images through a hidden Markov random field model and the expectation-maximization algorithm. IEEE Trans Med Imag, 20(1):45-57, 2001.
16. Alotaibi A. Investigating microstructural changes in white matter in multiple sclerosis: A systematic review and individual participant data meta-analysis of neurite orientation dispersion and density imaging. Brain Sciences. 2021;11(9):1151. doi:https://doi.org/10.3390/brainsci11091151
17. Vavasour IM, Sun P, Graf C, et al. Characterization of multiple sclerosis neuroinflammation and neurodegeneration with relaxation and diffusion basis spectrum imaging. Multiple Sclerosis Journal. 2021:135245852110233. doi:10.1177/13524585211023345
Figures