0882
Network analysis of multiple sclerosis using pair-wise matched controls and cohesive parcellation of rsfMRI1Imaging Institute, Cleveland Clinic, Cleveland, OH, United States, 2Cleveland Clinic, Cleveland, OH, United States
Synopsis
Multiple sclerosis (MS) is characterized by degenerative changes in white matter, resulting in motor and cognitive deficits. The corresponding damage to functional brain networks is not well understood. We studied several graph theoretic network features of multiple sclerosis patients imaged with rsfMRI. Using a data-driven parcellation designed for optimal node-based representation as well as sex and age-matched controls, we find no significant differences. This result was robust to individual and group parcellations, as well as paired and group comparisons. This differs from previous studies based on standard parcellations and pooled group comparisons. Methodologic reasons for the different observations are discussed.
Introduction
Multiple sclerosis (MS) is characterized by degenerative changes in brain white matter, resulting in functional deficits, the hallmark of which are motor and cognitive deficits. Brain networks are disrupted in patients suffering from MS, primarily through degeneration of white matter tracts between functionally connected regions of gray matter. Therefore, it is appropriate to analyze these changes as local and global disruptions to the brain via a network model based on resting state functional imaging1 (rsfMRI).Graph-theory-based brain network models cannot normally be studied in full-resolution fMRI data. These methods depend heavily on parcellation to define network nodes. Typically, an exemplar time series based on the average of all voxels within a parcel is extracted and used to model connections between these parcel-defined nodes. While several classic parcellations have been used, we have recently introduced cohesive parcellation, a data-driven parcellation designed for optimal downstream, exemplar-based analyses2.
In addition, most studies perform necessary sex and age-matching by matching frequency across cohorts of healthy controls and MS patients5. Then, study outcomes are aggregated within each group and the groups are then statistically compared. Such studies may reflect changes in the groups themselves, rather than MS-related differences. Therefore, we designed a study using individual sex and age-matched control subjects to mitigate this potential confound. We perform pair-wise and group aggregate analyses of network models.
Methods
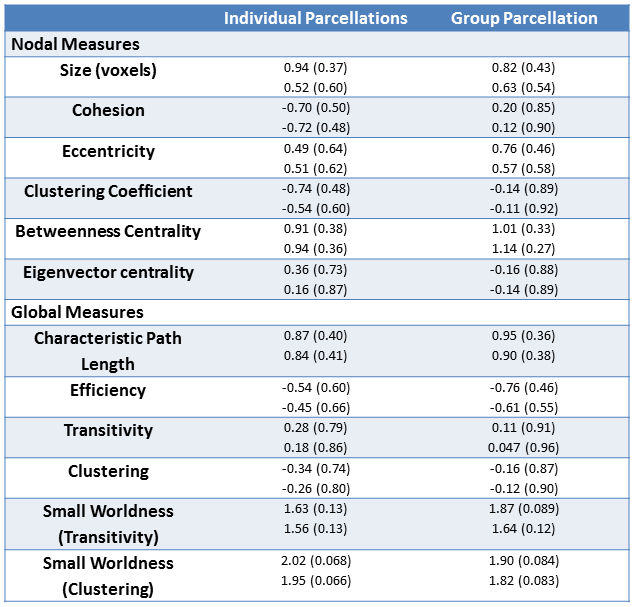
12 MS patients (age 43.8 +/- 9.7, 5 female) and 12 individually sex and age-matched (within 1.5 years) healthy controls were imaged on a Siemens 3T Trio (Erlangen, Germany). Whole brain rsfMRI data were acquired using 31 contiguous 4 mm thick axial slices (TE/TR =29/2800 ms, 140 volumes, 80° flip, 1282 matrix, 2562 FOV, 2x2x4 mm3 resolution). High resolution T1w images were acquired for anatomical context as well as dual echo field GRE maps. rsfMRI data were corrected for slice timing, motion3, physiologically based nuisances4, and B0 distortions. Anatomical data were registered to both their corresponding functional data and the 2 mm MNI template. All data were then warped to this common space and smoothed with an isotropic 2 mm FWHM Gaussian kernel. The data were temporally preprocessed with a quadratic detrend followed by filtering with a 0.01 – 0.1 Hz passband filter.The data were then parcellated at the single subject and group level using cohesive parcellation2 with a cohesion threshold of 0.5. Parcel exemplars were calculated based on the mean of voxel member time courses and used to construct a graph-based network model, with edges defined by the correlation between network exemplars. All edges below 0.5 correlation were removed, and the largest connected component was extracted. Several node-based and global graph-theoretic measures were calculated5. Nodal measures include size (voxels), cohesion, eccentricity, clustering coefficient, betweenness centralicity, and eigenvector centrality. Global measures include characteristic path length, efficiency, transitivity, clustering, and small worldness. Paired and unpaired two-tailed t-tests were then calculated to investigate matched and pooled differences in these measures, respectively. The median of nodal measures were used for t-test analysis, and 1000 lattice-preserving graph randomizations were used for normalizing the clustering in small worldness calculations.
Results
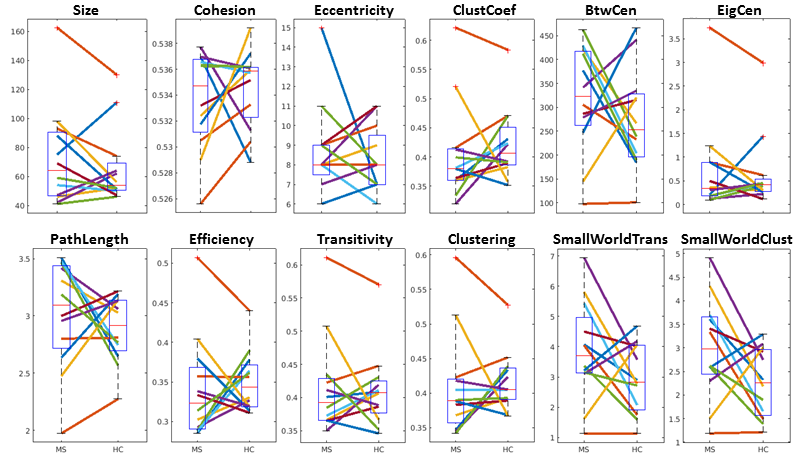
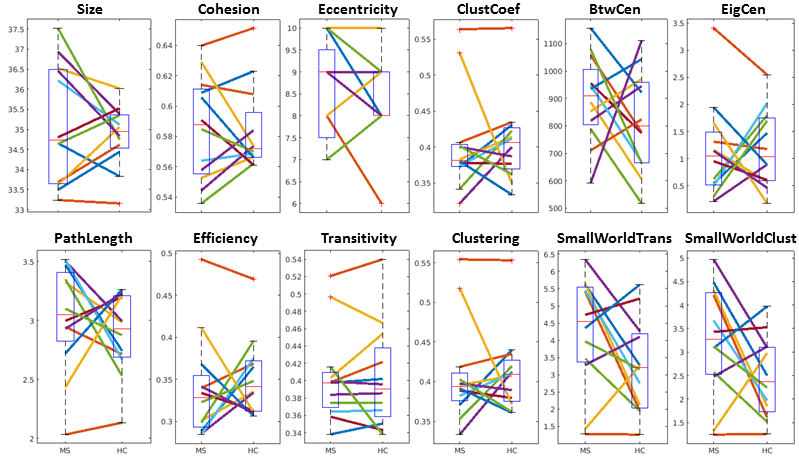
See table 1 for demographics, including MS-specific neuropsychological evaluations. Cohesive parcellation produced 2241 parcels at the group level and 1044 +/- 228 parcels at the individual level. Table 2 shows the t-test results of the network analysis between MS patients and controls based on these parcellations. No significant differences were detected across all measures at both the nodal and global level. This includes paired comparisons with matched controls as well as unpaired group comparisons. In addition, no difference was seen whether individual or group cohesive parcellations were used. Figures 1 and 2 show the distributions of network measures for MS patients and their matched controls based on individual and group parcellations, respectively.Discussion
Previous studies based on standard parcellation templates and group differences have found longer path lengths, increased clustering, and reduced efficiency in MS patients compared to controls6. Using cohesive parcellation optimized for exemplar-based analyses, we find no significant difference in these measures. This held even when age- and sex-matched controls were used in a paired analysis. Previous studies did not used individually matched controls, implying that part of the discrepancy may reflect group differences, such as motion characteristics or physiologic confounds, rather than underlying brain network changes. Standard templates tend to have much fewer parcels (FreeSurfer, 168; Yeo/Choi, 68; Human connectome project, 360), producing parcel exemplars that may not represent their underlying member voxels well, while cohesive parcellation uses many more parcels (group, 2241; individual 1044 +/- 228) to guarantee strong exemplar/member agreement. Therefore, it is possible the lack of network changes seen in the current study reflects larger network models with more nodes and improved network representation.Conclusion
Our findings show that functional and cognitive deficits in MS are not reflected in brain network models when derived using larger, data-driven parcellations. These results are robust to both group and matched analyses. This represents a challenge to using network measures as a biomarker for MS and highlights possible deficiencies in current group-level analysis methodology.Acknowledgements
No acknowledgement found.References
1. Schoonheim MM, et al. Network collapse and cognitive impairment in multiple sclerosis. Front Neurol. 2015;6:82.
2. Nemani A and Lowe MJ. Cohesive parcellation of rsfMRI using constrained hierarchical clustering. Proc 29th ISMRM. 2020;#3960.
3. Beall E and Lowe M. SimPACE: generating simulated motion corrupted BOLD data with synthetic-navigated acquisition for the development and evaluation of SLOMOCO: a new, highly effective slicewise motion correction. NeuroImage. 2014;101:21-34.
4. Beall E. Adaptive cyclic physiologic noise modeling and correction in functional MRI. J Neurosci Meth. 2010;187(2):216-28.
5. Welton T, et al. Reproducibility of graph-theoretic brain network metrics: a systematic review. Brain Connect. 2015;5:193-202.
6. Welton T, et al. Graph theoretic analysis of brain connectomics in multiple sclerosis: reliability and relationship with cognition. Brian Connect. 2020;10(2):95-104.
Figures