0881
MR-derived g-ratio is sensitive to longitudinal change and associated with disability progression in early multiple sclerosis1Centre for Clinical Brain Sciences, University of Edinburgh, Edinburgh, United Kingdom, 2Anne Rowling Regenerative Neurology Clinic, University of Edinburgh, Edinburgh, United Kingdom
Synopsis
There is a pressing need for longitudinal in vivo biomarkers sensitive to heterogeneous pathology in relapsing-remitting multiple sclerosis (RRMS). The MR-g-ratio may be derived from myelin-sensitive magnetisation transfer saturation (MTsat) and multishell diffusion-weighted MRI but its relevance as a longitudinal biomarker and correlate of disability progression in RRMS is previously unexplored. Fifty-nine patients with recently diagnosed RRMS contributed g-ratio data at baseline and one year. G-ratio showed a significant decrease in normal-appearing white matter (NAWM) but not T2 FLAIR white matter lesions over one year. Both g-ratio in NAWM and lesions were, however, associated with clinical disability progression.
Introduction
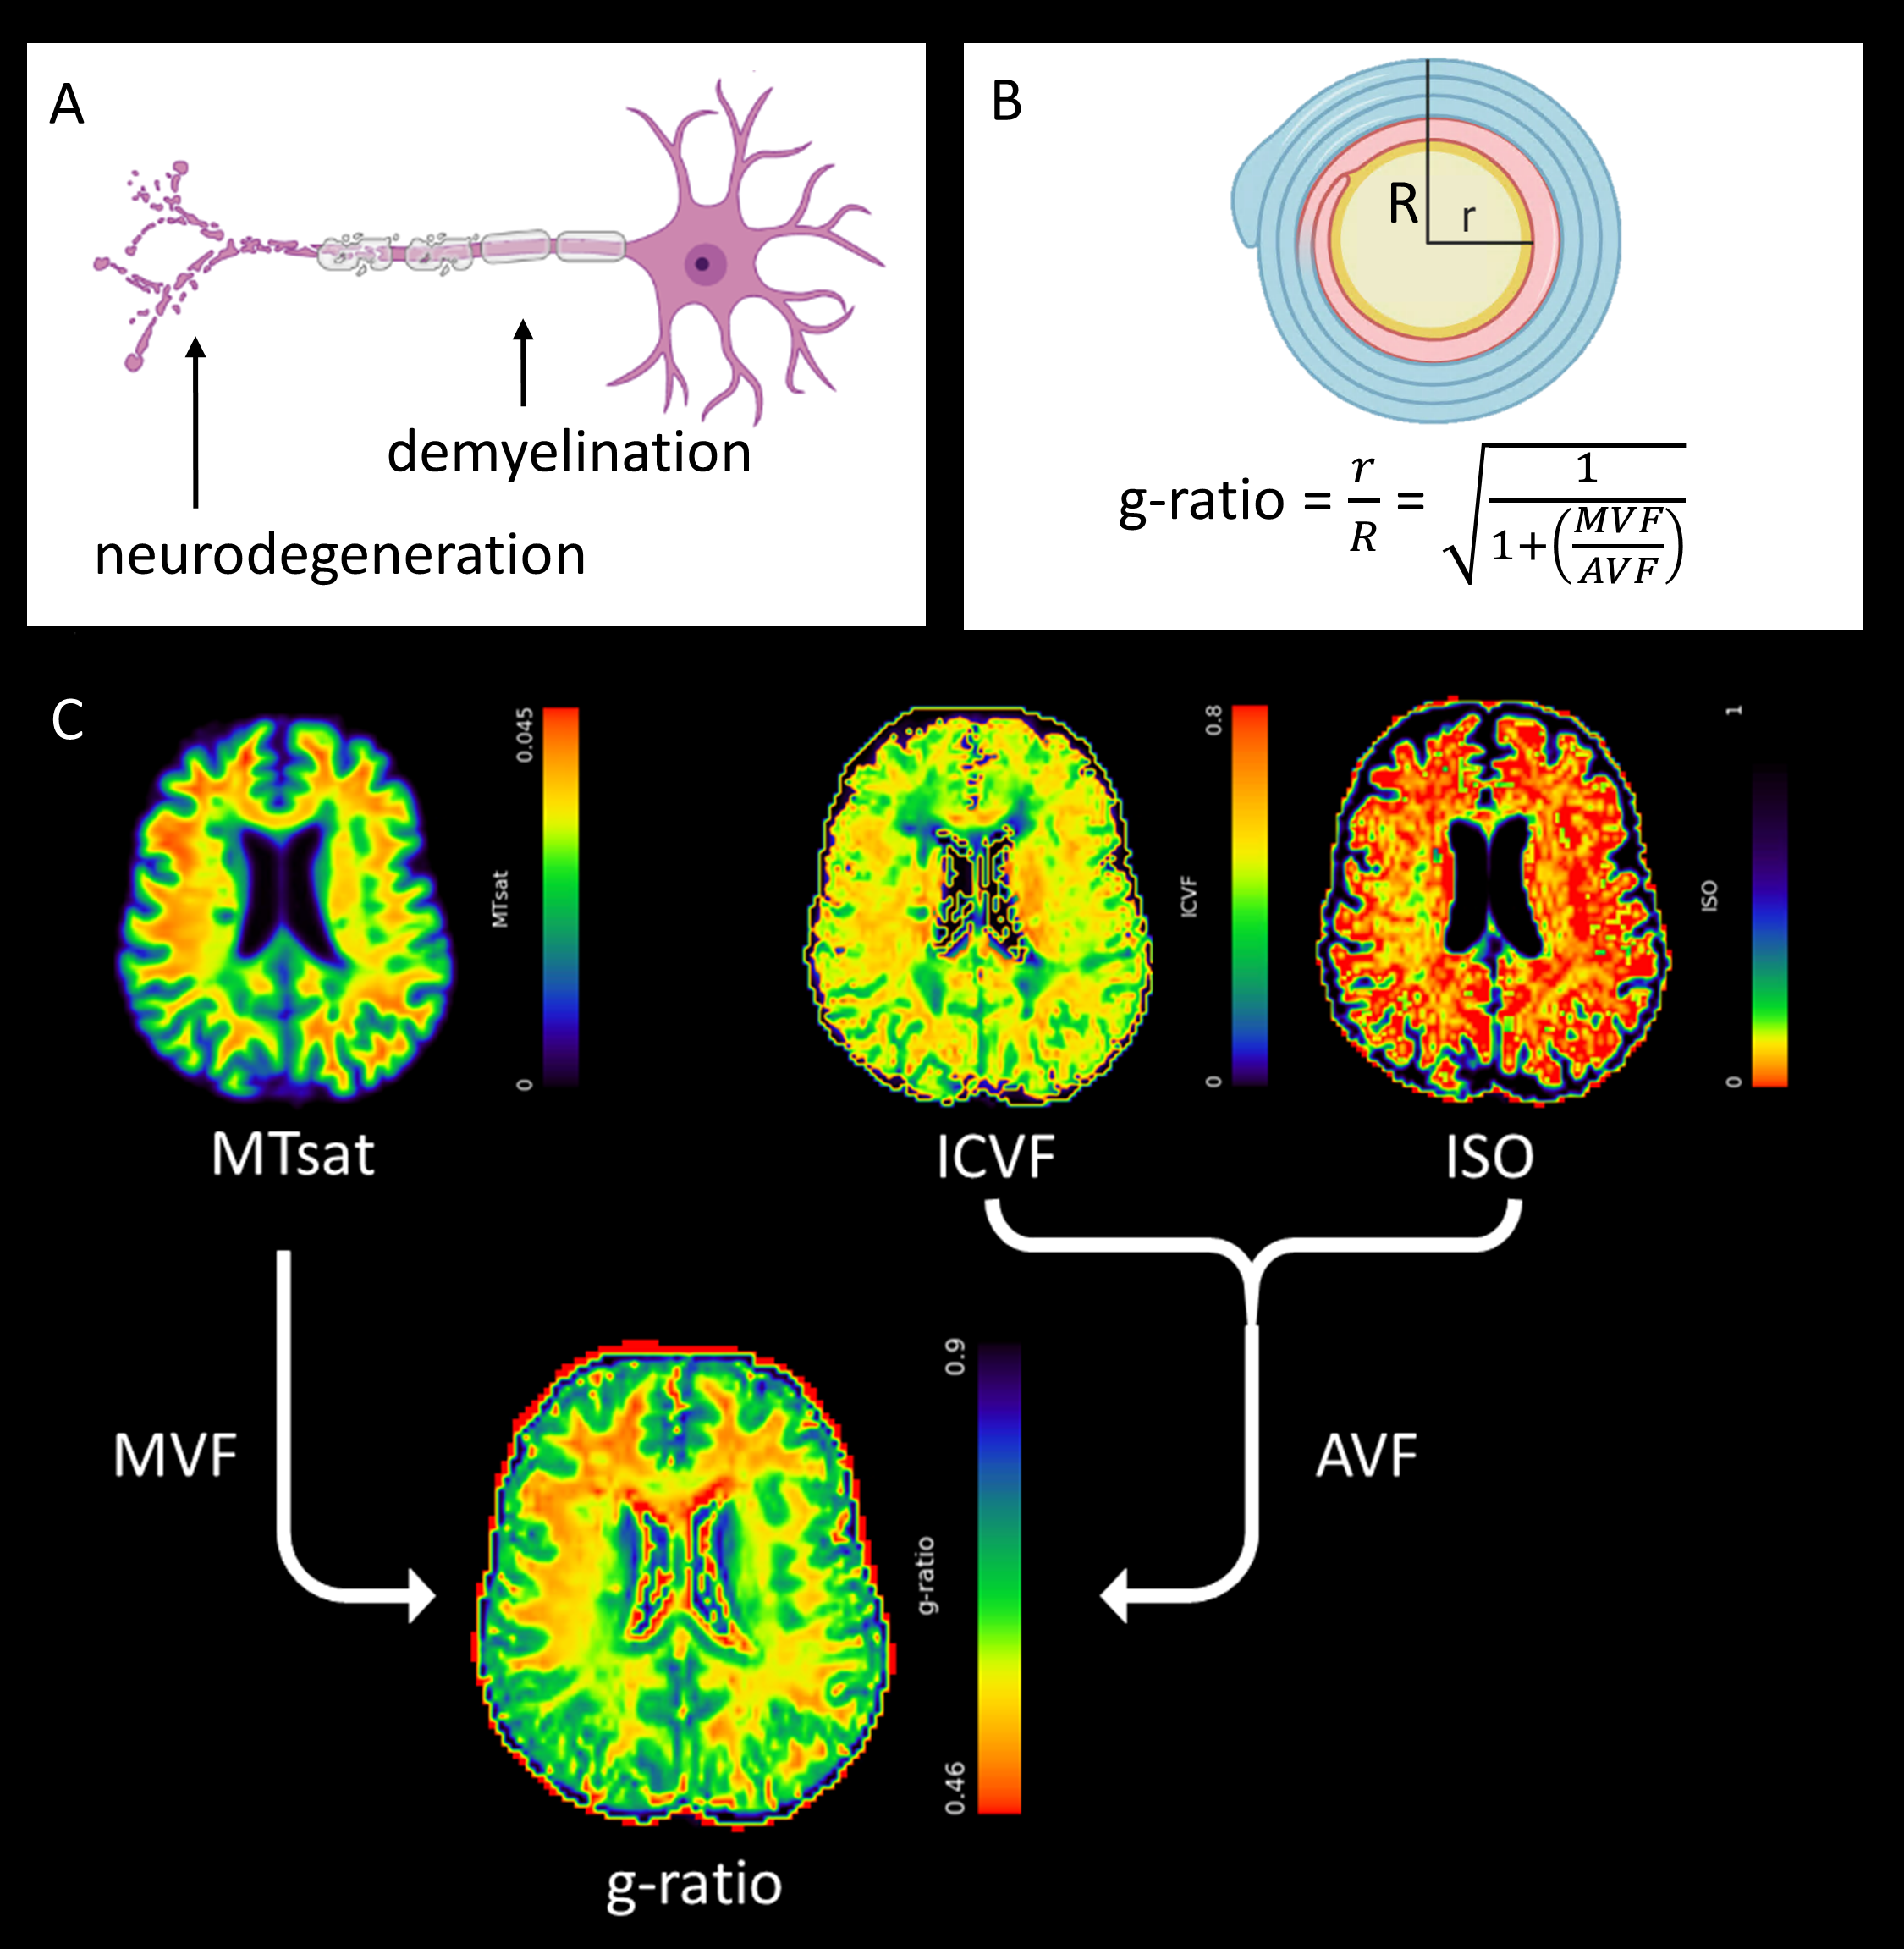
Relapsing-remitting multiple sclerosis (RRMS) has a highly heterogeneous disease course characterised by immune-mediated demyelination and neurodegeneration (Figure 1A). Early patient stratification requires longitudinal in vivo biomarkers, which are sensitive to subtle changes in RRMS pathology, and which can predict disease progression and assess the therapeutic effectiveness of novel treatments.Multimodal imaging biomarkers, such as the MRI-derived g-ratio1, may improve specificity to RRMS pathology.2 G-ratio is defined as the ratio of the axonal to myelinated axonal radius (Figure 1B), and may be derived from myelin-sensitive magnetisation transfer saturation (MTsat)3 and axonal-sensitive multishell Neurite Orientation Dispersion and Density Imaging (NODDI)4 diffusion-weighted (dMRI) methods (Figure 2).5
The MRI-derived g-ratio was recently shown to be associated with ongoing axonal damage in early RRMS.6 This study aims to address whether g-ratio is sensitive to longitudinal change and clinical disability progression in RRMS.
Methods
Seventy-seven people with RRMS were recruited to an extended MRI protocol of a longitudinal study of recently diagnosed RRMS, Future-MS (protocol details available elsewhere7,8). All patients were treatment-naïve at baseline and clinical assessment included Expanded Disability Status Score (EDSS). Approval was granted from the local Research Ethics committee and written informed consent was provided by participants.MR imaging was performed at baseline and one year on a 3.0T MR system (Prisma; Siemans Healthcare, Erlangen, Germany) with 32-channel head coil. Structural imaging included a sagittal 3D T1-weighted MPRAGE (1mm isotropic voxels; 176 slices; 256 x 256 mm acquisition matrix; TR/TE: 2.26/2500 ms) and axial 2D T2 FLAIR PROPELLER (1 x 1 x 3mm; 60 slices; 256 x 256 mm; TR/TE: 120/9500ms).
Magnetisation transfer (MT) imaging was three sagittal 3D gradient echo fast low-angle shot (FLASH) sequences: two proton density images (1.4mm isotropic; 128 slices; 160 x 172 mm; TR=30ms, α=5°) with and without a Gaussian off-resonance MT saturation pulse, plus a T1-weighted image (TR=15ms, α=18°). dMRI was an axial multishell, multiband diffusion-weighted 2D echo-planar imaging (2 mm isotropic; 74 slices; 128 x 128 mm acquisition matrix; TE/TR: 74/4300 ms; b-values: 0[14]/200[3]/500[6]/1000[64]/2000[64] and reverse phase encoding: 0 [3]; 151 directions).
The g-ratio was calculated as1: $$g=\sqrt{(1+\frac{MVF}{AVF})^{-1}}$$ where MVF is the (MTsat-derived) myelin volume fraction and AVF is the (dMRI-derived) axonal volume fraction (Figure 2), detailed elsewhere.6 Graphical simulations were also performed to model how longitudinal changes in ISO, ICVF, MTsat and AVF alter the g-ratio.
T2 FLAIR white matter lesions (WMLs) were automatically segmented and manually corrected.8 Normal-appearing white matter (NAWM) was segmented with FreeSurfer with WMLs subtracted from masks.8
Statistical analyses were carried out in RStudio (v1.4.1103). Longitudinal change in MR-derived g-ratio NAWM and WMLs was assessed with paired t-tests (α=0.05) with follow-up linear mixed models, where significant, to control for age, lesion load and initiation of disease-modifying therapies (DMTs). The association between change in g-ratio and EDSS progression over one year was assessed with binomial logistic regression models for (1) NAWM and (2) WMLs. Age, change in lesion load and change in brain volume (as a ratio of intracranial volume) were covariates.
Results
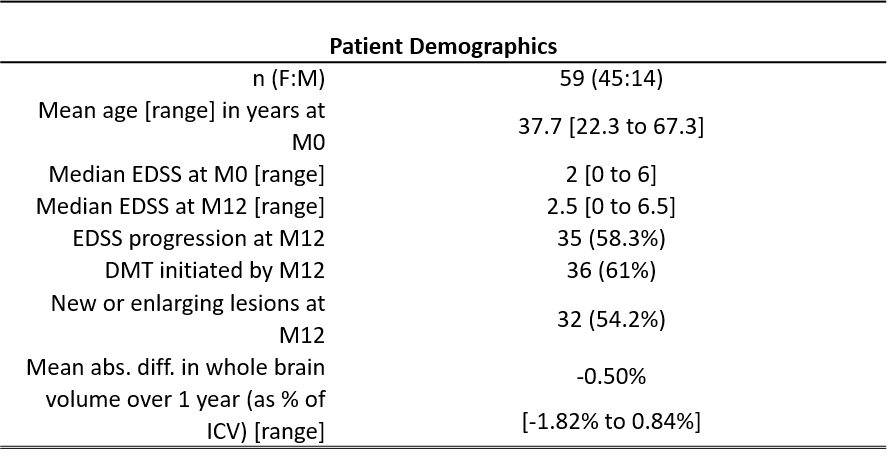
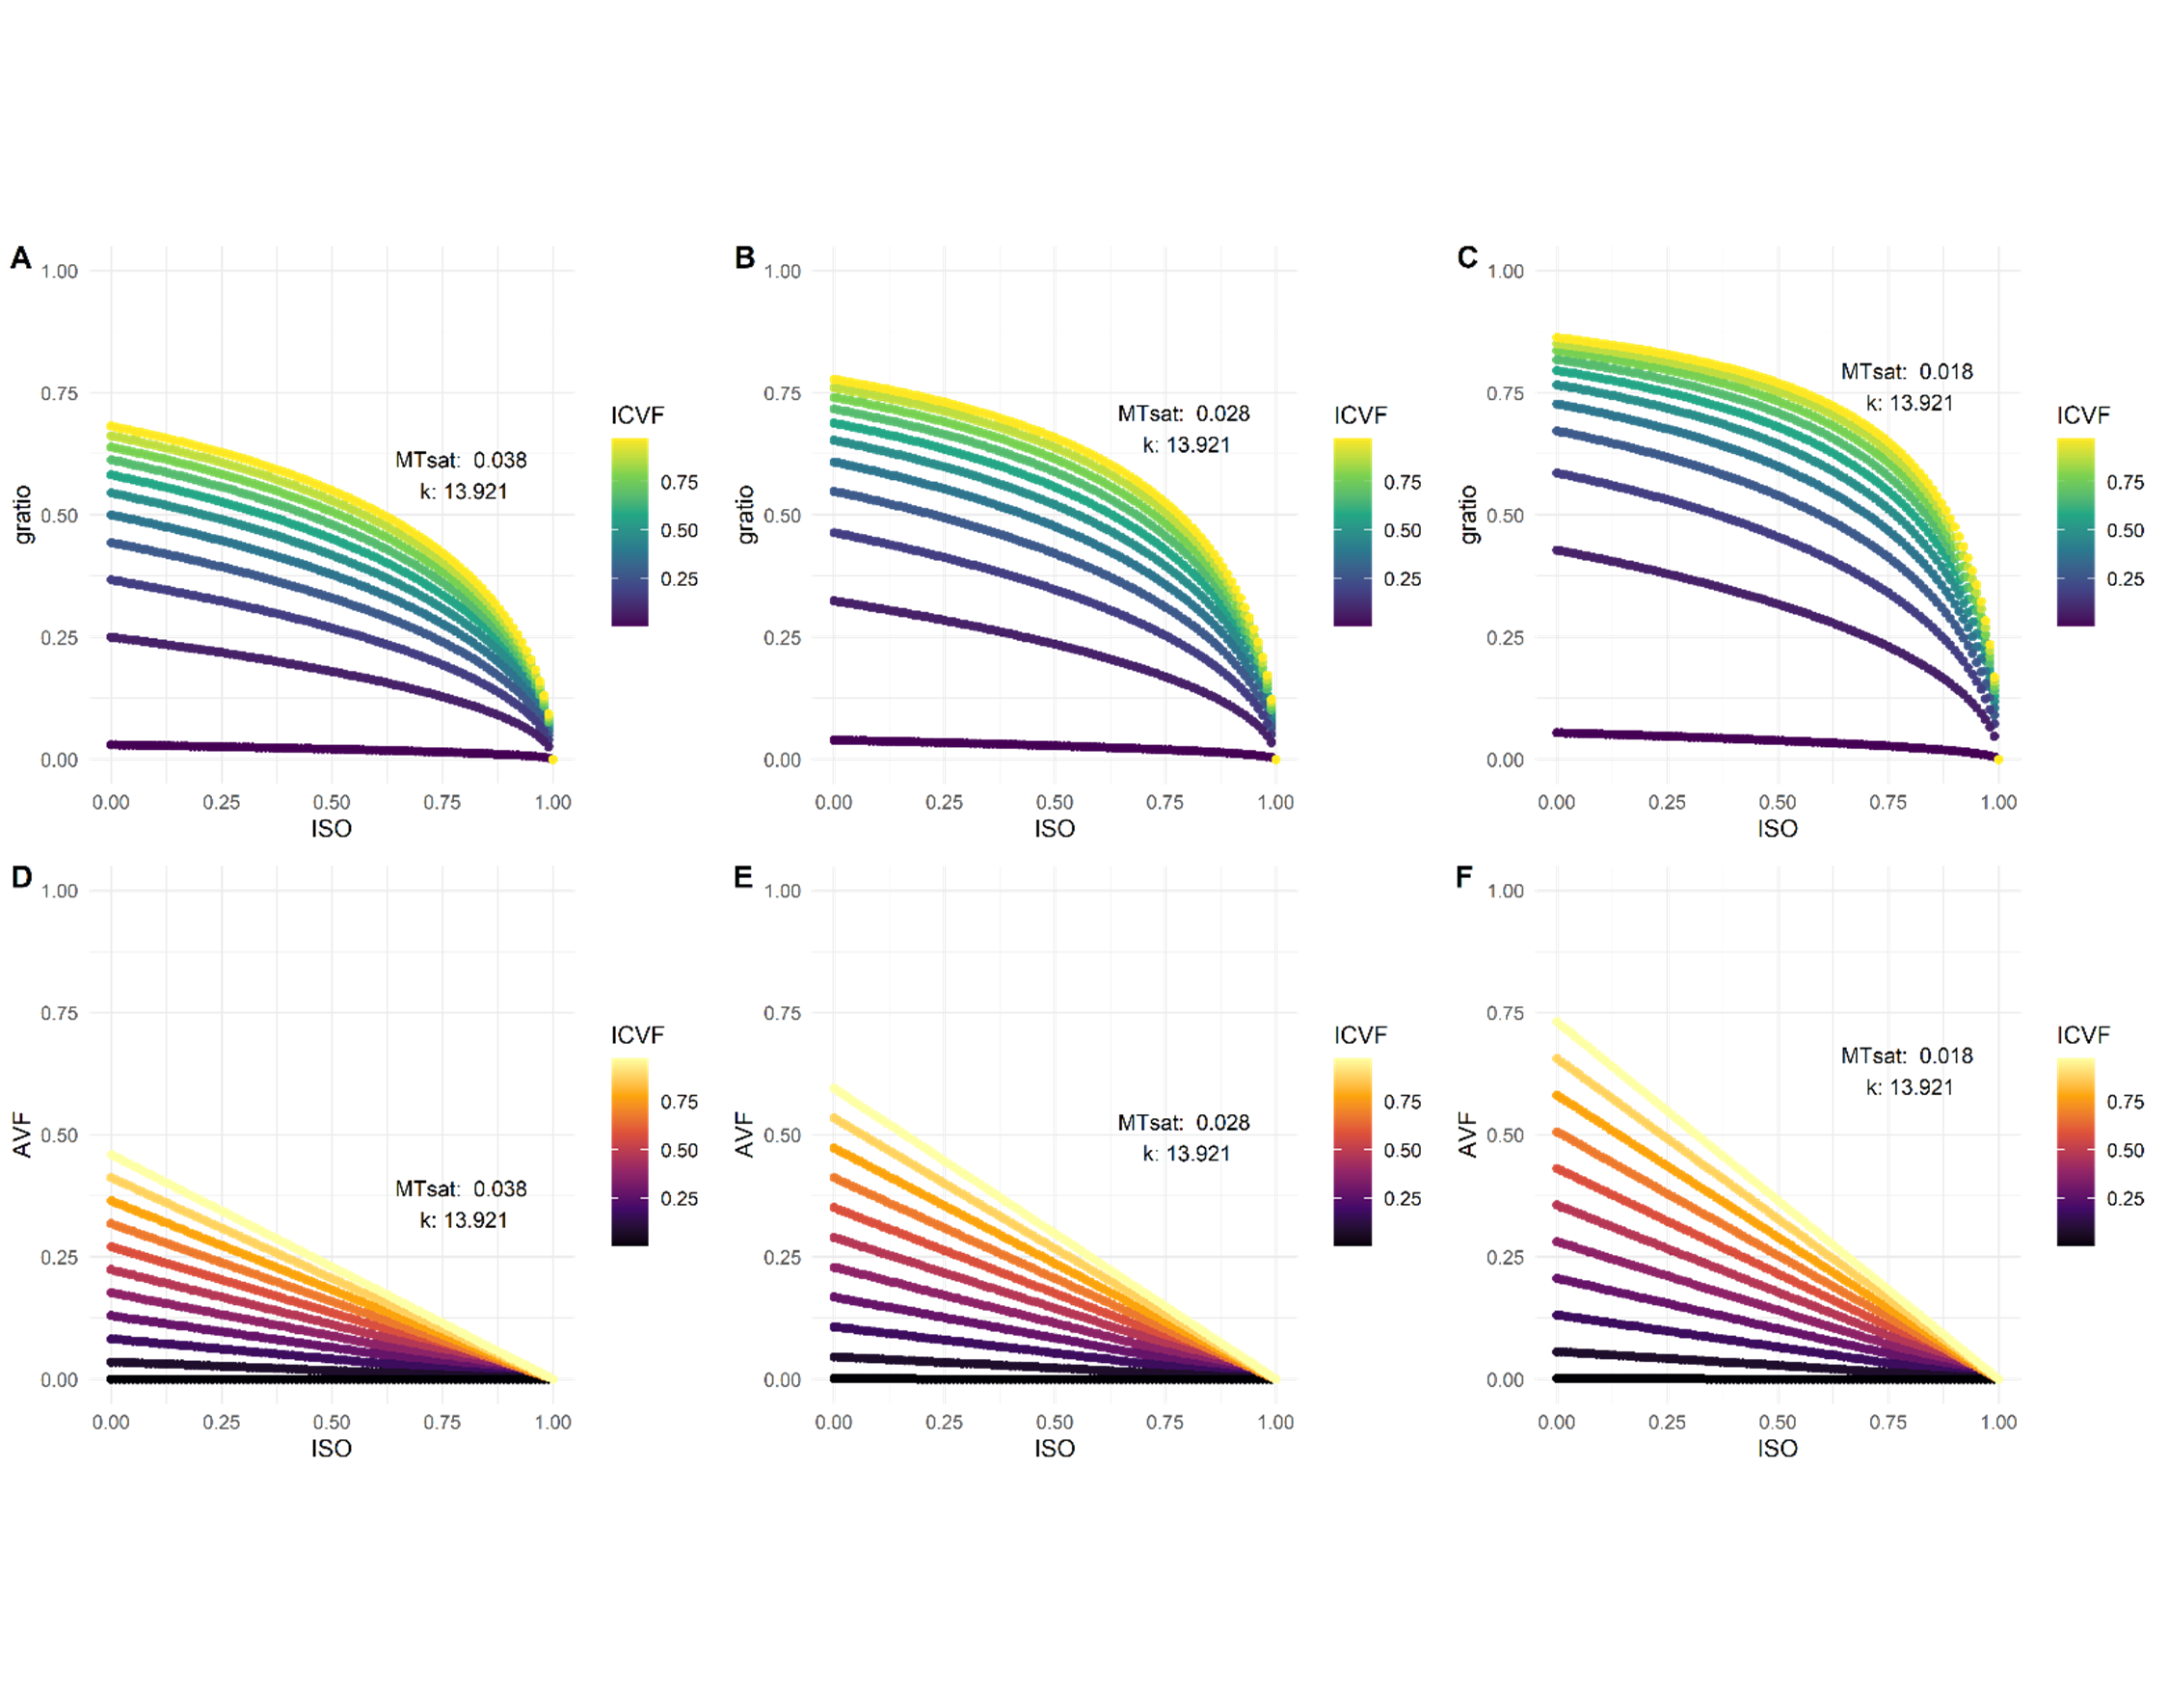
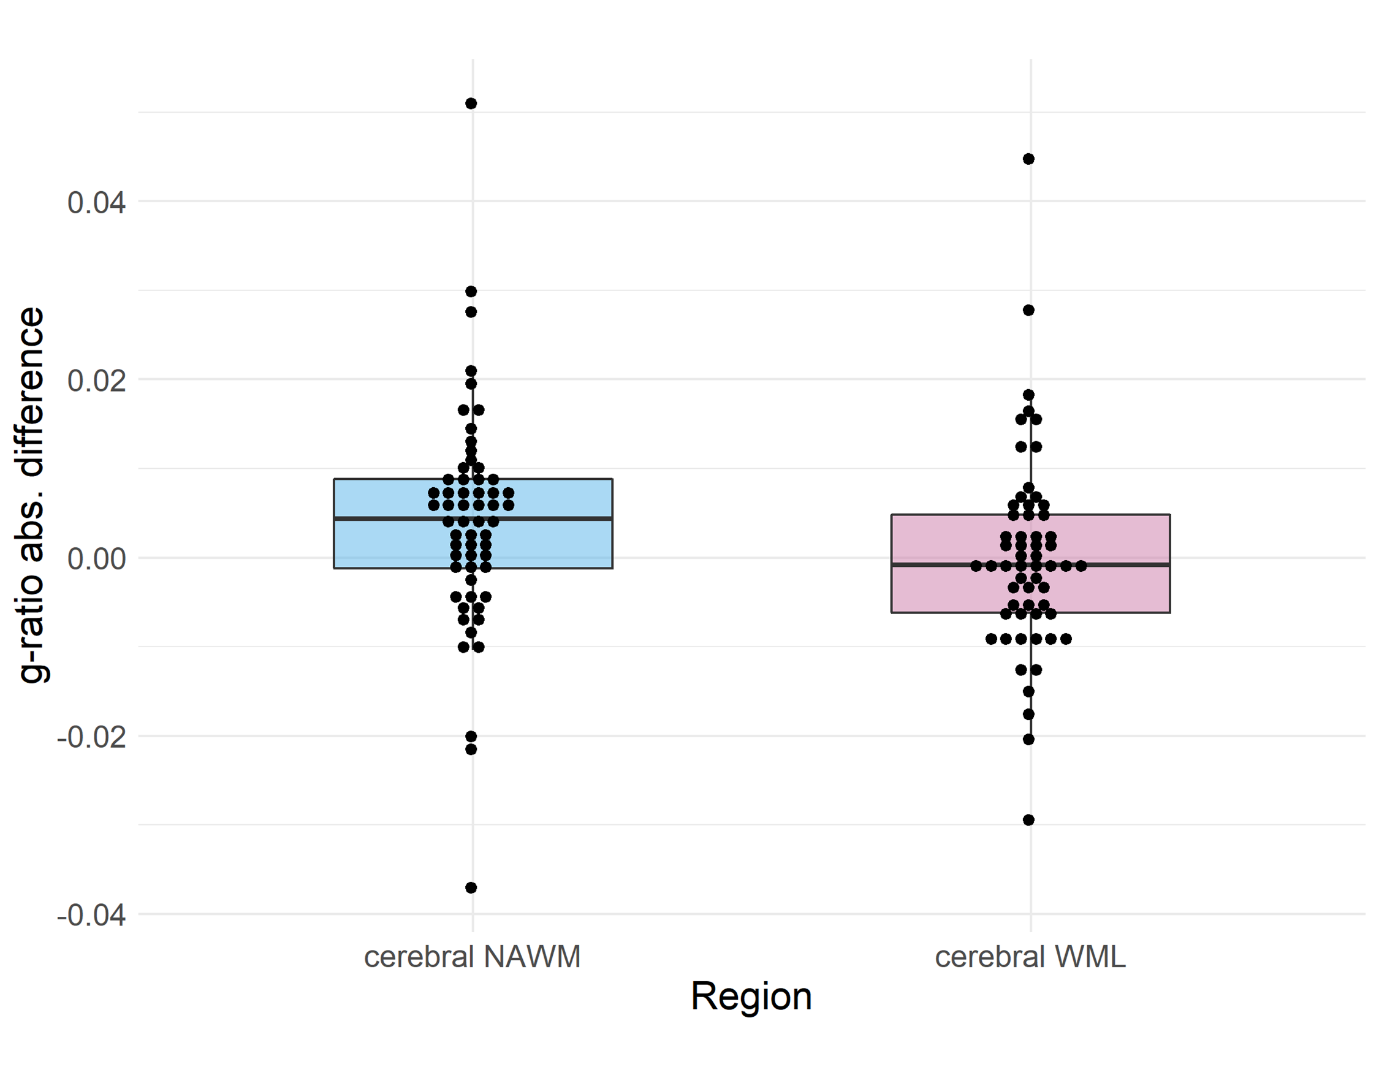
Simulations (Figure 3A-C) showed that a decrease in MTsat results in an increase in g-ratio when other parameters are held constant. A decrease in ICVF or an increase in ISO, however, results in a decrease in g-ratio. With a concomitant decrease in MTsat, as would be expected in RRMS pathology, these effects oppose each other to some degree due to the scaling factor in the AVF calculation (Figure 3D-F).Complete longitudinal MRI was available for fifty-nine patients (Table 1). Thirty-five patients showed worsening EDSS. NAWM g-ratio increased significantly over one year (mean difference = 0.004 [95% CI 0.001 to 0.007], paired t-test: t(58) = 2.53, p = 0.014) and survived correction for age, lesion load and initiation of DMTs (linear mixed model: β = 0.007, t(74.9) = 2.88, p = 0.005). There was no significant change in WML g-ratio over the same time period (paired t-test: t(58)=0.06, p=0.953, Figure 4).
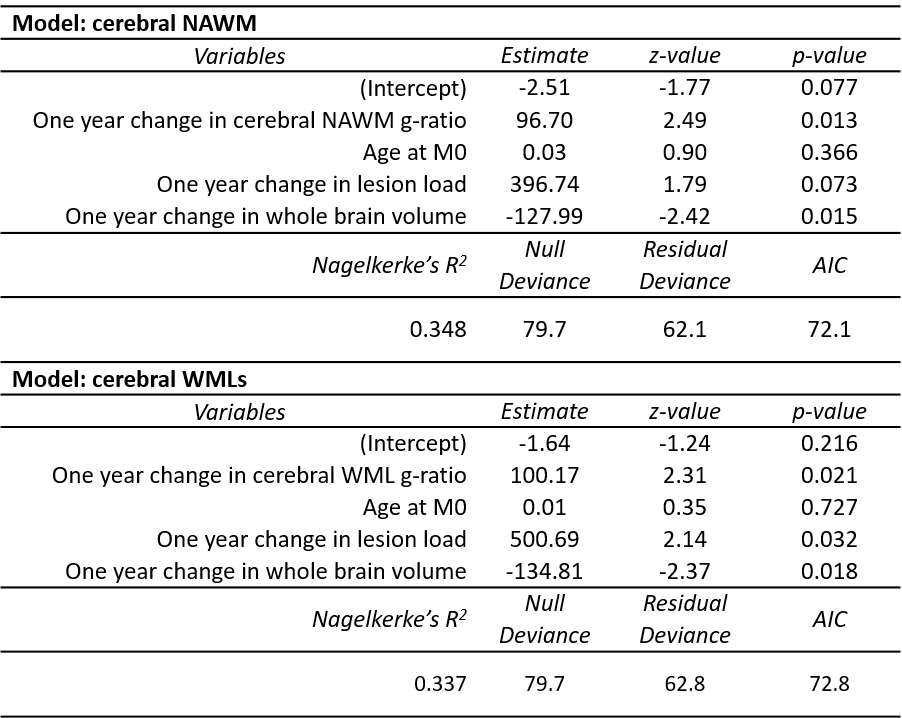
Logistic regression showed that one-year changes in g-ratio in NAWM and WMLs were independently associated with worsening EDSS (χ2(4) = 17.61, p = 0.002 and χ2(4) = 16.93, p = 0.002, respectively, Table 2). Models explained 33.7% (NAWM) and 34.8% (WMLs) of the variance in clinical disability progression.
Discussion
The observed significant increase in NAWM in patients with RRMS is indicative of subtle myelin loss in white matter without visible lesions. The association between longitudinal change in g-ratio in NAWM and WML and clinical disability, demonstrating that g-ratio may be clinically useful for patient stratification, is likely due to its specificity to heterogeneous RRMS pathology.WML g-ratio did not change over time. Simulation results suggest this may be due to a ‘ceiling effect’ in areas with already elevated g-ratio or breakdown of model assumptions in severely damaged tissue. Future research is warranted to broaden the applicability of the g-ratio model, and explore the link between g-ratio changes and neuronal conductivity.
Conclusion
G-ratio is a promising in vivo biomarker of myelin and axonal integrity; longitudinal change in NAWM and associations with disability progression in both WML and NAWM suggests a prognostic role in early disease. G-ratio applicability in the context of severe demyelination requires further exploration.Acknowledgements
We acknowledge support and funding from Chief Scientist Office Scottish PhD Research & Innovation Network Traineeships Motor Neuron Disease/Multiple Sclerosis Studentship (ENY), Wellcome Trust Senior Research Fellowship (215621/Z/19/Z, DPJH), NHS Lothian Research and Development Office (MJT), MS Society UK Centre of Excellence and the Anne Rowling Clinic. With thanks to Future-MS, hosted by Precision Medicine Scotland Innovation Centre (PMSIC) and funded by a grant from the Scottish Funding Council to PMS-IC and Biogen Idec Ltd Insurance (combined funding under reference Exemplar SMS_IC010). With special thanks to all Future-MS participants who have made this study possible.References
1. Stikov N, Campbell JS, Stroh T, Lavelée M, Frey S, Novek J, Nuara S, Ho MK, Bedell BJ, Dougherty RF, Leppert IR. In vivo histology of the myelin g-ratio with magnetic resonance imaging. Neuroimage. 2015 Sep 1;118:397-405.
2. Hagiwara A, Hori M, Yokoyama K, Nakazawa M, Ueda R, Horita M, Andica C, Abe O, Aoki S. Analysis of white matter damage in patients with multiple sclerosis via a novel in vivo MR method for measuring myelin, axons, and g-ratio. American Journal of Neuroradiology. 2017 Oct 1;38(10):1934-40.
3. Helms G, Dathe H, Kallenberg K, Dechent P. High‐resolution maps of magnetization transfer with inherent correction for RF inhomogeneity and T1 relaxation obtained from 3D FLASH MRI. Magnetic Resonance in Medicine: An Official Journal of the International Society for Magnetic Resonance in Medicine. 2008 Dec;60(6):1396-407.
4. Zhang H, Schneider T, Wheeler-Kingshott CA, Alexander DC. NODDI: practical in vivo neurite orientation dispersion and density imaging of the human brain. Neuroimage. 2012 Jul 16;61(4):1000-16.
5. Campbell JS, Leppert IR, Narayanan S, Boudreau M, Duval T, Cohen-Adad J, Pike GB, Stikov N. Promise and pitfalls of g-ratio estimation with MRI. Neuroimage. 2018 Nov 15;182:80-96.
6. York EN, Martin SJ, Meijboom R, Thrippleton MJ, Bastin ME, Carter E, Overell J, Connick P, Chandran S, Waldman AD, Hunt DP. MRI-derived g-ratio and lesion severity in newly diagnosed multiple sclerosis. Brain Communications. 2021 Nov 3.
7. Kearns PK, Martin SJ, Chang YT, Meijboom R, York EN, Chen Y, Weaver C, Stenson A, Freyer E, Hafezi K, Harroud A. FutureMS Cohort Profile: A Scottish Multi-Centre Inception Cohort Study of Relapsing-Remitting Multiple Sclerosis. medRxiv. 2021 Jan 1.
8. Meijboom R, Wiseman SJ, York EN, Bastin ME, Hernandez MD, Thrippleton MJ, Mollison D, White N, Kampaite A, Kwong KC, Gonzalez DR. Rationale and design of the brain magnetic resonance imaging protocol for FutureMS: a longitudinal multi-centre study of newly diagnosed patients with relapsing-remitting multiple sclerosis in Scotland. medRxiv. 2021 Jan 1.
Figures