0871
Quasi-Diffusion Imaging: A model-based alternative to Diffusional Kurtosis Imaging1St George's, University of London, London, United Kingdom, 2King's College London, London, United Kingdom, 3National Physical Laboratory, London, United Kingdom, 4University College London, London, United Kingdom
Synopsis
Quasi-Diffusion Imaging (QDI) is based on a model of diffusion dynamics that assumes diffusion is locally Gaussian within a heterogeneous tissue microstructural environment. We show here that QDI provides a compelling model-based alternative to Diffusional Kurtosis Imaging (DKI). Tensor measures determined by QDI are highly correlated with DKI, but exhibit greater parameter independence, indicating that DKI study results showing sensitivity and specificity to disease could be improved using QDI. As QDI also overcomes the limitations of DKI and can be acquired reproducibly in clinically feasible time it is a non-Gaussian diffusion imaging technique that overcomes barriers to clinical translation.
Introduction
Quasi-Diffusion Magnetic Resonance Imaging (QDI) is a novel quantitative non-Gaussian diffusion magnetic resonance imaging (dMRI) technique that provides high quality parameter maps within clinically acceptable acquisition times [1,2]. QDI overcomes the limitations of Diffusional Kurtosis Imaging (DKI, [3,4]) to provide: (i) a model-based approach, (ii) model-fitting within voxels with negative kurtosis, (iii) reliable analysis for b>3000 s mm-2.QDI is based on a special case of the Continuous Time Random Walk model of diffusion dynamics and assumes that diffusion is locally Gaussian within a heterogeneous tissue microstructural environment [1,2]. QDI parameterises the diffusion signal attenuation according to the rate of decay (diffusion coefficient, D1,2 in mm2s-1) and the shape of the power law tail (the fractional exponent, α). As QDI is model-based, it is possible to use the characteristic equation of the signal decay to obtain a distribution of Fickian diffusivities via the inverse Laplace transform, and the diffusion propagator via the inverse Fourier transform. Uniquely, QDI provides closed-form representations for both the Laplace transform and Green’s function [2].
Here we investigate the parameter space of Quasi-Diffusion Tensor Imaging (QDTI), and its relationship with DKI. We also describe a new technique for estimating the α tensor.
Methods
Participants: Eight healthy participants (age 29±8 years, 3 male, 5 female).Image acquisition: Whole brain axial dMRI (TE=90ms, TR=6000ms, δ=23.5ms, Δ=43.9ms, 22 slices, 1.5mm×1.5mm×5mm resolution) and 3D T1-weighted volume images (1mm×1mm×1.25mm resolution) were acquired. dMRI data included 8 b=0 s mm-2 images, and 15 diffusion gradient directions with b=0, 1100, and 5000 s mm-2 for QDTI, and b=0, 1100, and 3000 s mm-2 for DKI protocols (acquisition time 228 seconds).
Image analysis: dMRI were denoised [5] and corrected for motion and eddy current distortions [6]. No smoothing was performed. For QDI, the D1,2 and α parameters were estimated in each diffusion gradient direction on a voxel-by-voxel basis using, $$\frac{S_{b}}{S_{0}}=\sum_{k=0}^{\infty}{\frac{(-1)^k (D_{1,2}b)^{\alpha k}}{\Gamma(\alpha k + 1)}},$$ where S is the signal, Γ(x) is the gamma function, and α determines whether the diffusion is Gaussian (α=1), or non-Gaussian (0<α<1) [1,2]. Rotationally invariant quantitative mean and anisotropy maps were computed for D1,2 and α. The D1,2 tensor was computed as previously described [1,2,7]. A novel approach was used to calculate the α tensor, A, that uses directional residuals. Along a given diffusion gradient direction, g=(gx gy gz), we have,
$$y_{g}=(D_{1,2})_{g}^{\alpha_{g}},$$ and after rearranging,
$$\alpha^{g}=\frac{\ln(y_{g})}{\ln(D_{1,2})_{g}}. (1)$$ To allow estimation of the α tensor, A, using the general linear model, the matrix logarithm was used to provide a tensor version of eq.(1),
$$g^{T}Ag=\frac{\ln(D_{1,2})_{g}^{\alpha_{g}}}{g^{T}Q\ln(\Lambda)Q^{T}g},$$ where Q is the eigenvector matrix of the diffusion tensor and Λ is the matrix of eigenvalues. Mean and fractional anisotropy maps were calculated for D1,2 and α tensors.
DKI maps were computed for mean diffusivity, DK, kurtosis, K, and their anisotropies [8]. Only voxels with physical values (0<K≤3) were analysed.
Statistical analysis: Relationships between QDTI and DKI mean and anisotropy measures were investigated in physical kurtosis voxels across the whole brain using Spearman’s correlation. Cohort average and standard deviations for correlations are presented.
Results
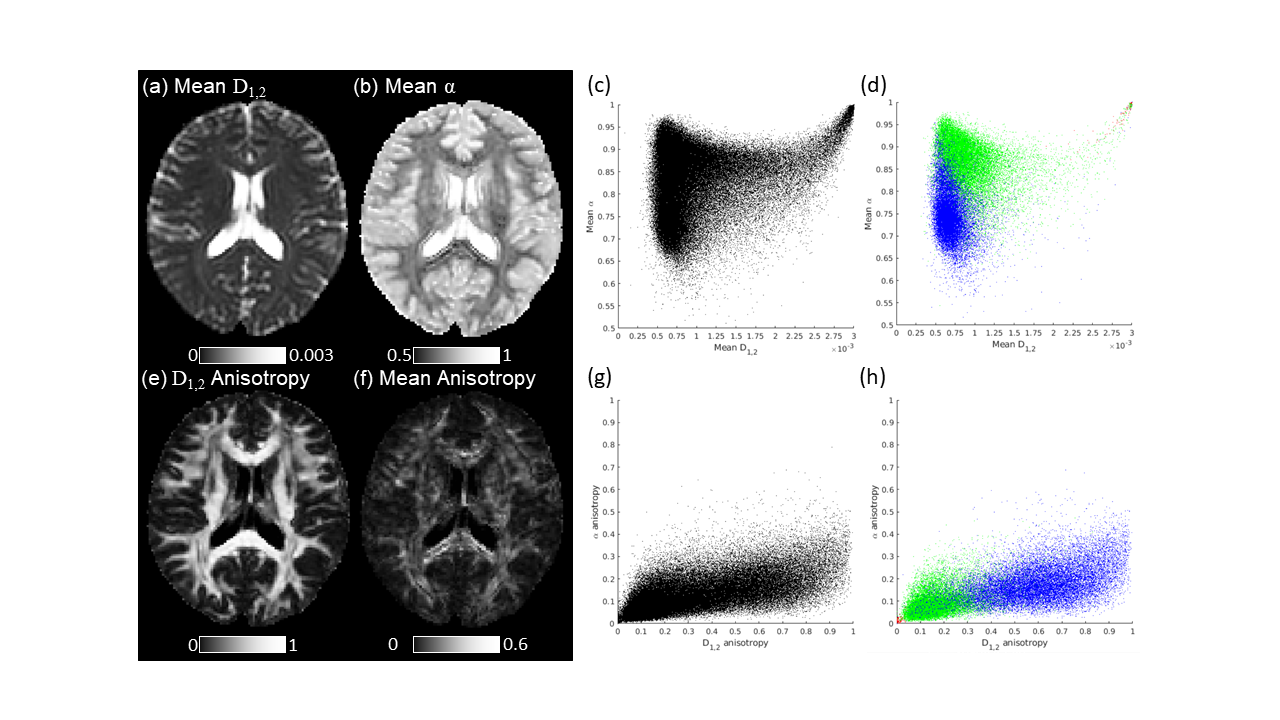
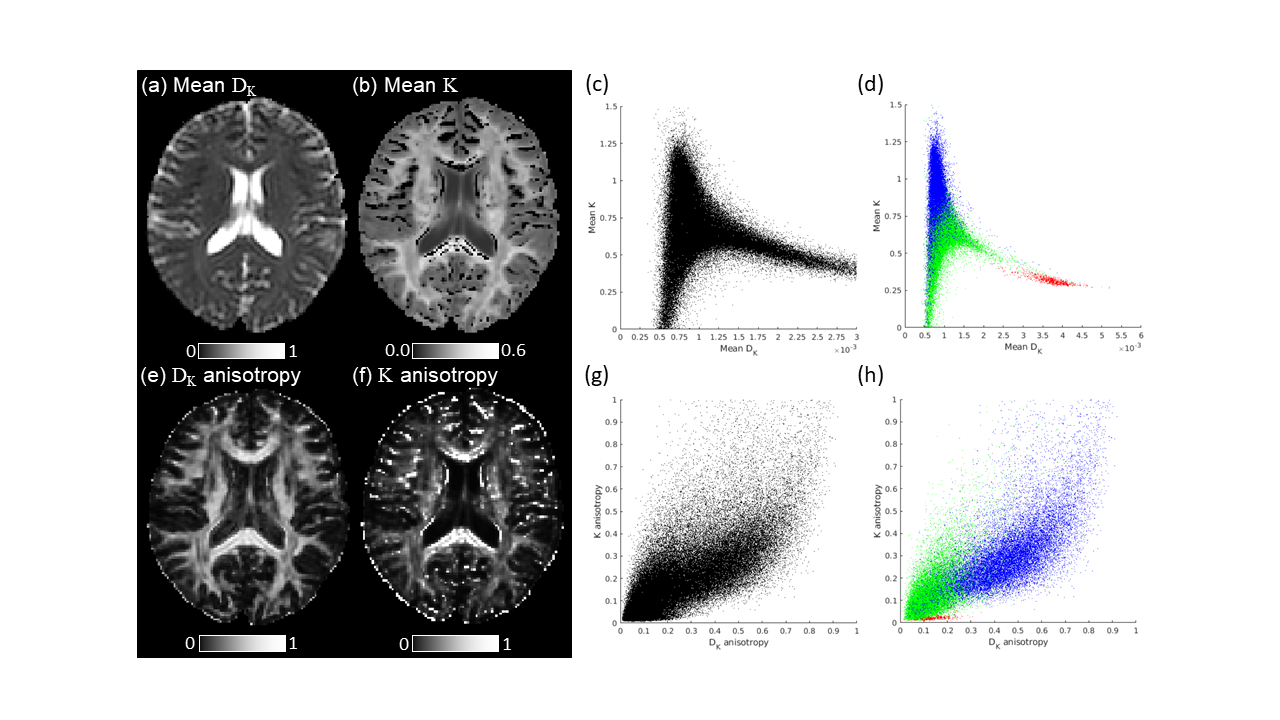
Figures 1 and 2 show QDTI and DKI mean and anisotropy maps and display the parameter space defined by voxels with physical kurtosis values, respectively.D1,2 and α demonstrate a characteristic distribution for healthy tissue with weak correlation between parameters (Fig.1c, ρ=0.271±0.072). The mean D1,2 and α distribution shows greater independence between parameters than the distribution of mean DK and K, which demonstrates the known deltoid shape [3], a compressed parameter space, and greater variability in correlation coefficients between participants (Fig.2c, ρ=-0.342±0.142).
The anisotropies of D1,2 and α demonstrate strong correlations for healthy tissue (Fig.1g, ρ=0.713±0.022). The D1,2 and α anisotropy distribution shows greater independence between measures than the distribution of DK and K anisotropy which demonstrates stronger correlation between parameters (Fig.2g, ρ=0.811±0.019).
Fig.3 shows scatter plots of the relationship between QDTI and DKI parameters. Mean D1,2 and DK hold the same information (ρ=0.990±0.003), with mean α and K strongly negatively correlated (ρ=-0.876±0.019). D1,2 and K anisotropy show strong positive correlation (ρ=0.890±0.026), whereas anisotropies of α and K are moderately correlated (ρ=0.559±0.025).
Discussion and Conclusions
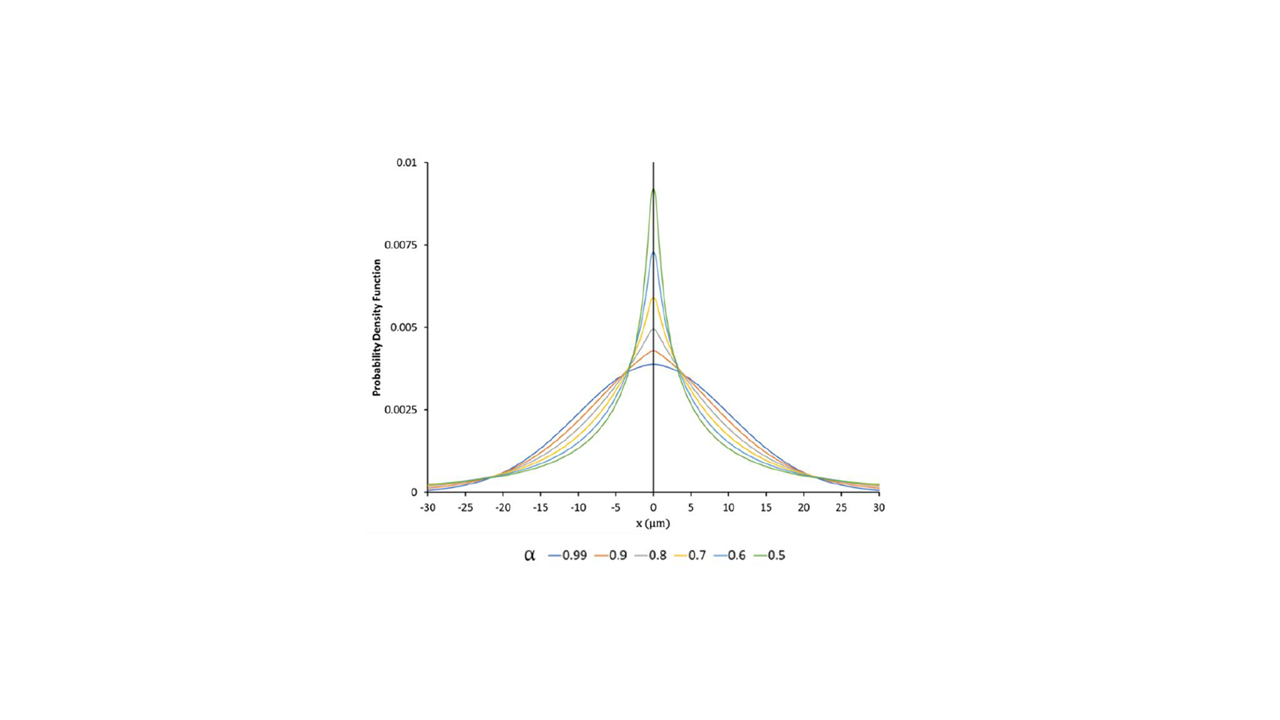
QDTI offers a compelling alternative to DKI. The QDI parameters of D1,2 and α are mathematically independent [1,2] and we have demonstrated here that D1,2 and α mean and anisotropy have greater independence in healthy brain tissue than DKI parameters. As QDTI and DKI parameters are highly related it is likely that DKI study results which show sensitivity and specificity to disease could be improved using QDI.QDI has several advantages over DKI. As QDI is model-based (unlike DKI) it can be mathematically shown that a decrease in α corresponds to an increase in kurtosis of the quasi-diffusion propagator [2] (Fig.4). QDI can also be used to perform Quasi-Diffusion Mean Apparent Propagator Imaging [2], or represent signal within a voxel as a distribution of Fickian diffusion coefficients [2]. Finally, QDI overcomes barriers to clinical translation as we have previously shown that an optimised whole brain acquisition protocol with 6 diffusion directions provides accurate and reliable mean and anisotropy measures of non-Gaussian diffusion in clinically feasible times (e.g. QDTI in 2 mins or less) [1,9].
Acknowledgements
Funding for this study was provided by a St George’s, University of London Innovation Award.
References
[1] Barrick, T.R. et al. (2020) ‘Quasi-diffusion magnetic resonance imaging (QDI): A fast, high b-value diffusion imaging technique’, NeuroImage, 211, p. 116606. doi:10.1016/j.neuroimage.2020.116606.
[2] Barrick, T.R. et al. (2021) ‘The Mathematics of Quasi-Diffusion Magnetic Resonance Imaging’, Mathematics, 9(15), p. 1763. doi:10.3390/math9151763.
[3] Jensen, J.H. et al. (2005) ‘Diffusional kurtosis imaging: The quantification of non-gaussian water diffusion by means of magnetic resonance imaging’, Magnetic Resonance in Medicine, 53(6), pp. 1432–1440. doi:https://doi.org/10.1002/mrm.20508.
[4] Jensen, J.H. and Helpern, J.A. (2010) ‘MRI quantification of non-Gaussian water diffusion by kurtosis analysis’, NMR in Biomedicine, 23(7), pp. 698–710. doi:https://doi.org/10.1002/nbm.1518.
[5] Veraart, J. et al. (2016) ‘Denoising of diffusion MRI using random matrix theory’, NeuroImage, 142, pp. 394–406. doi:10.1016/j.neuroimage.2016.08.016.
[6] Andersson, J.L.R. et al. (2016) ‘Incorporating outlier detection and replacement into a non-parametric framework for movement and distortion correction of diffusion MR images’, NeuroImage, 141, pp. 556–572. doi:10.1016/j.neuroimage.2016.06.058.
[7] Hall, M.G. and Barrick, T.R. (2012) ‘Two-step anomalous diffusion tensor imaging’, NMR in Biomedicine, 25(2), pp. 286–294. doi:https://doi.org/10.1002/nbm.1747.
[8] Tax, C.M., et al., (2019). ‘Cross-scanner and cross-protocol diffusion MRI data harmonisation: a benchmark database and evaluation of algorithms’, Neuroimage, 195, pp. 285-299, 10.1016/j.neuroimage.2019.01.077
[9] Spilling, C.A., Howe, F.A., Barrick, T.R., (2020) ‘Quasi-Diffusion Magnetic Resonance Imaging (QDI): Optimisation of acquisition protocol’, In proceedings of the International Society for Magnetic Resonance in Medicine Virtual Conference and Exhibition; p4391.
Figures