0870
Efficient Mapping of Diffusion Tensor Distribution in a Live Human Brain1Eunice Kennedy Shriver National Institute of Child Health and Human Development, National Institutes of Healt, Bethesda, MD, United States, 2The Henry M. Jackson Foundation for the Advancement of Military Medicine, Bethesda, MD, United States, 3Center for Neuroscience and Regenerative Medicine, Uniformed Services University of Health Sciences, Bethesda, MD, United States, 4University of Helsinki, Helsinki, Finland, 5Athinoula A. Martinos Center for Biomedical Imaging, Boston, MA, United States
Synopsis
Electron microscopy of nervous tissue reveals a multitude of compartments separated by plasma membranes where the diffusion of water may be hindered. Diffusion tensor distribution (DTD) MRI assumes each voxel consists of an ensemble of diffusion tensors described by a tensor variate probability distribution function in line with the EM observed microstructure. In this study, we show in vivo results obtained in the living human brain using a new DTD framework on the Connectome scanner using 300 mT/m gradients and a novel time efficient and concomitant field free pulse sequence which allowed shorter echo time for a given b-value.
Introduction
Diffusion tensor distribution (DTD) MRI has the potential to reveal sub-voxel microstructural features by modeling each voxel to be composed of an ensemble of diffusion tensors described by a tensor variate probability distribution function (i.e., DTD)1. We assume the DTD to be the maximum entropy normal tensor variate distribution (NTVD) whose samples are constrained to be positive definite (CNTVD)2. A family of metrics and glyphs which aim to disentangle the size, shape and orientation heterogeneities of diffusion processes present within a voxel is derived from the estimated DTD. In this study, we apply the CNTVD framework to measure, for the first time, in vivo DTDs in a human brain using the Connectome scanner with 300 mT/m gradients and a novel time efficient and concomitant-field compensating pulse sequence which admits shorter echo time for a given b-value.Methods
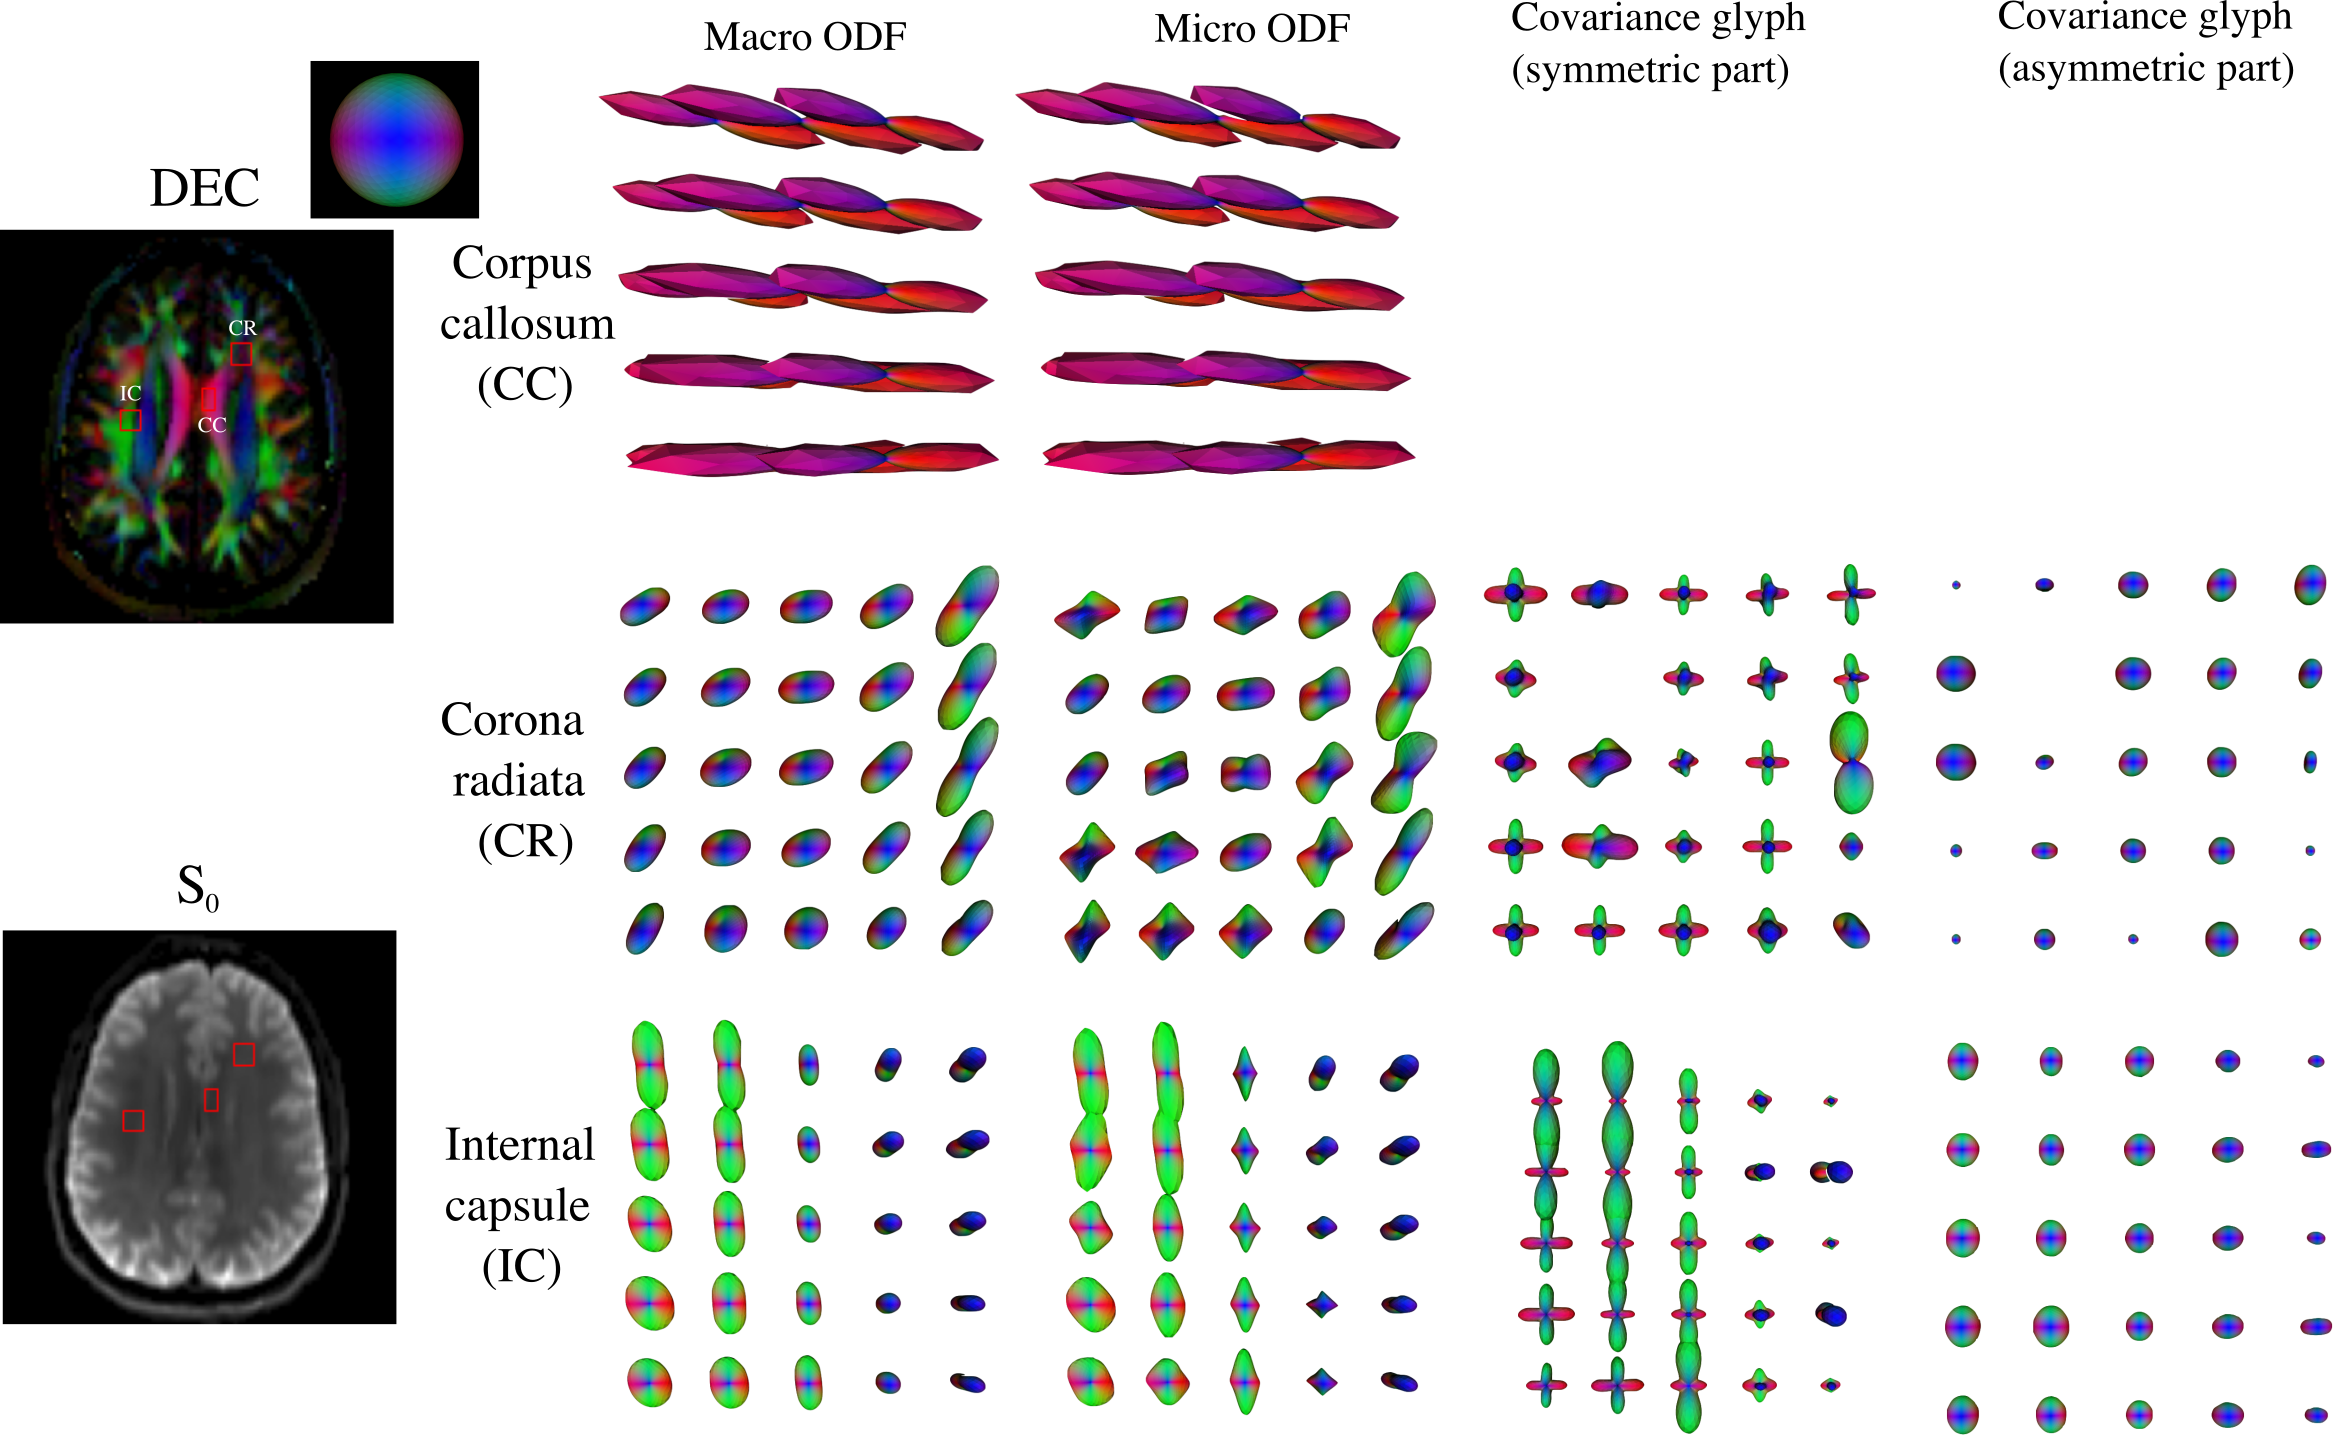
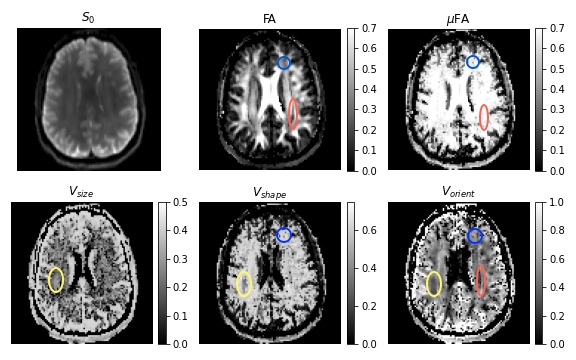
Assuming Gaussian diffusion in microscopic water pools within a voxel, the MR signal is given by the Laplace transform of DTD1 which is approximated using a Monte-Carlo method by drawing samples from CNTVD with a given second order mean and fourth-order covariance tensors2. This approximation is used to estimate the CNTVD moments by iteratively fitting the acquired data to a multitude of models in decreasing order of parsimony from DTI to DTD using a nonlinear least-squares routine2. The symmetric and asymmetric parts of the estimated CNTVD covariance tensor are visualized using glyphs to reveal the kurtosis and micro-structural information captured by higher rank b-tensors respectively.From the microscopic diffusion tensors sampled from the estimated CNVTD, microscopic fractional anisotropy (μFA) and micro-orientation distribution function (μODF) are defined as the ensemble average of the FA and ODF of individual micro-diffusion tensors. We also quantify the size (Vsize) and shape (Vshape) heterogeneity of micro-diffusion tensors within a voxel as the normalized median absolute deviation of their average trace and FA-weighted skewness of the eigenvalues respectively. The orientation heterogeneity (Vorient) is quantified as the extent of dispersion of the eigenvectors of the micro-diffusion tensors around the mean eigenvector2. These metrics were normalized between 0 and 1 and increase with the increasing amount of heterogeneity within the voxel. In addition, the distribution of apparent diffusion coefficient (ADC)3 is obtained from the histogram of average trace of micro-diffusion tensors whose moments are measured and mapped.
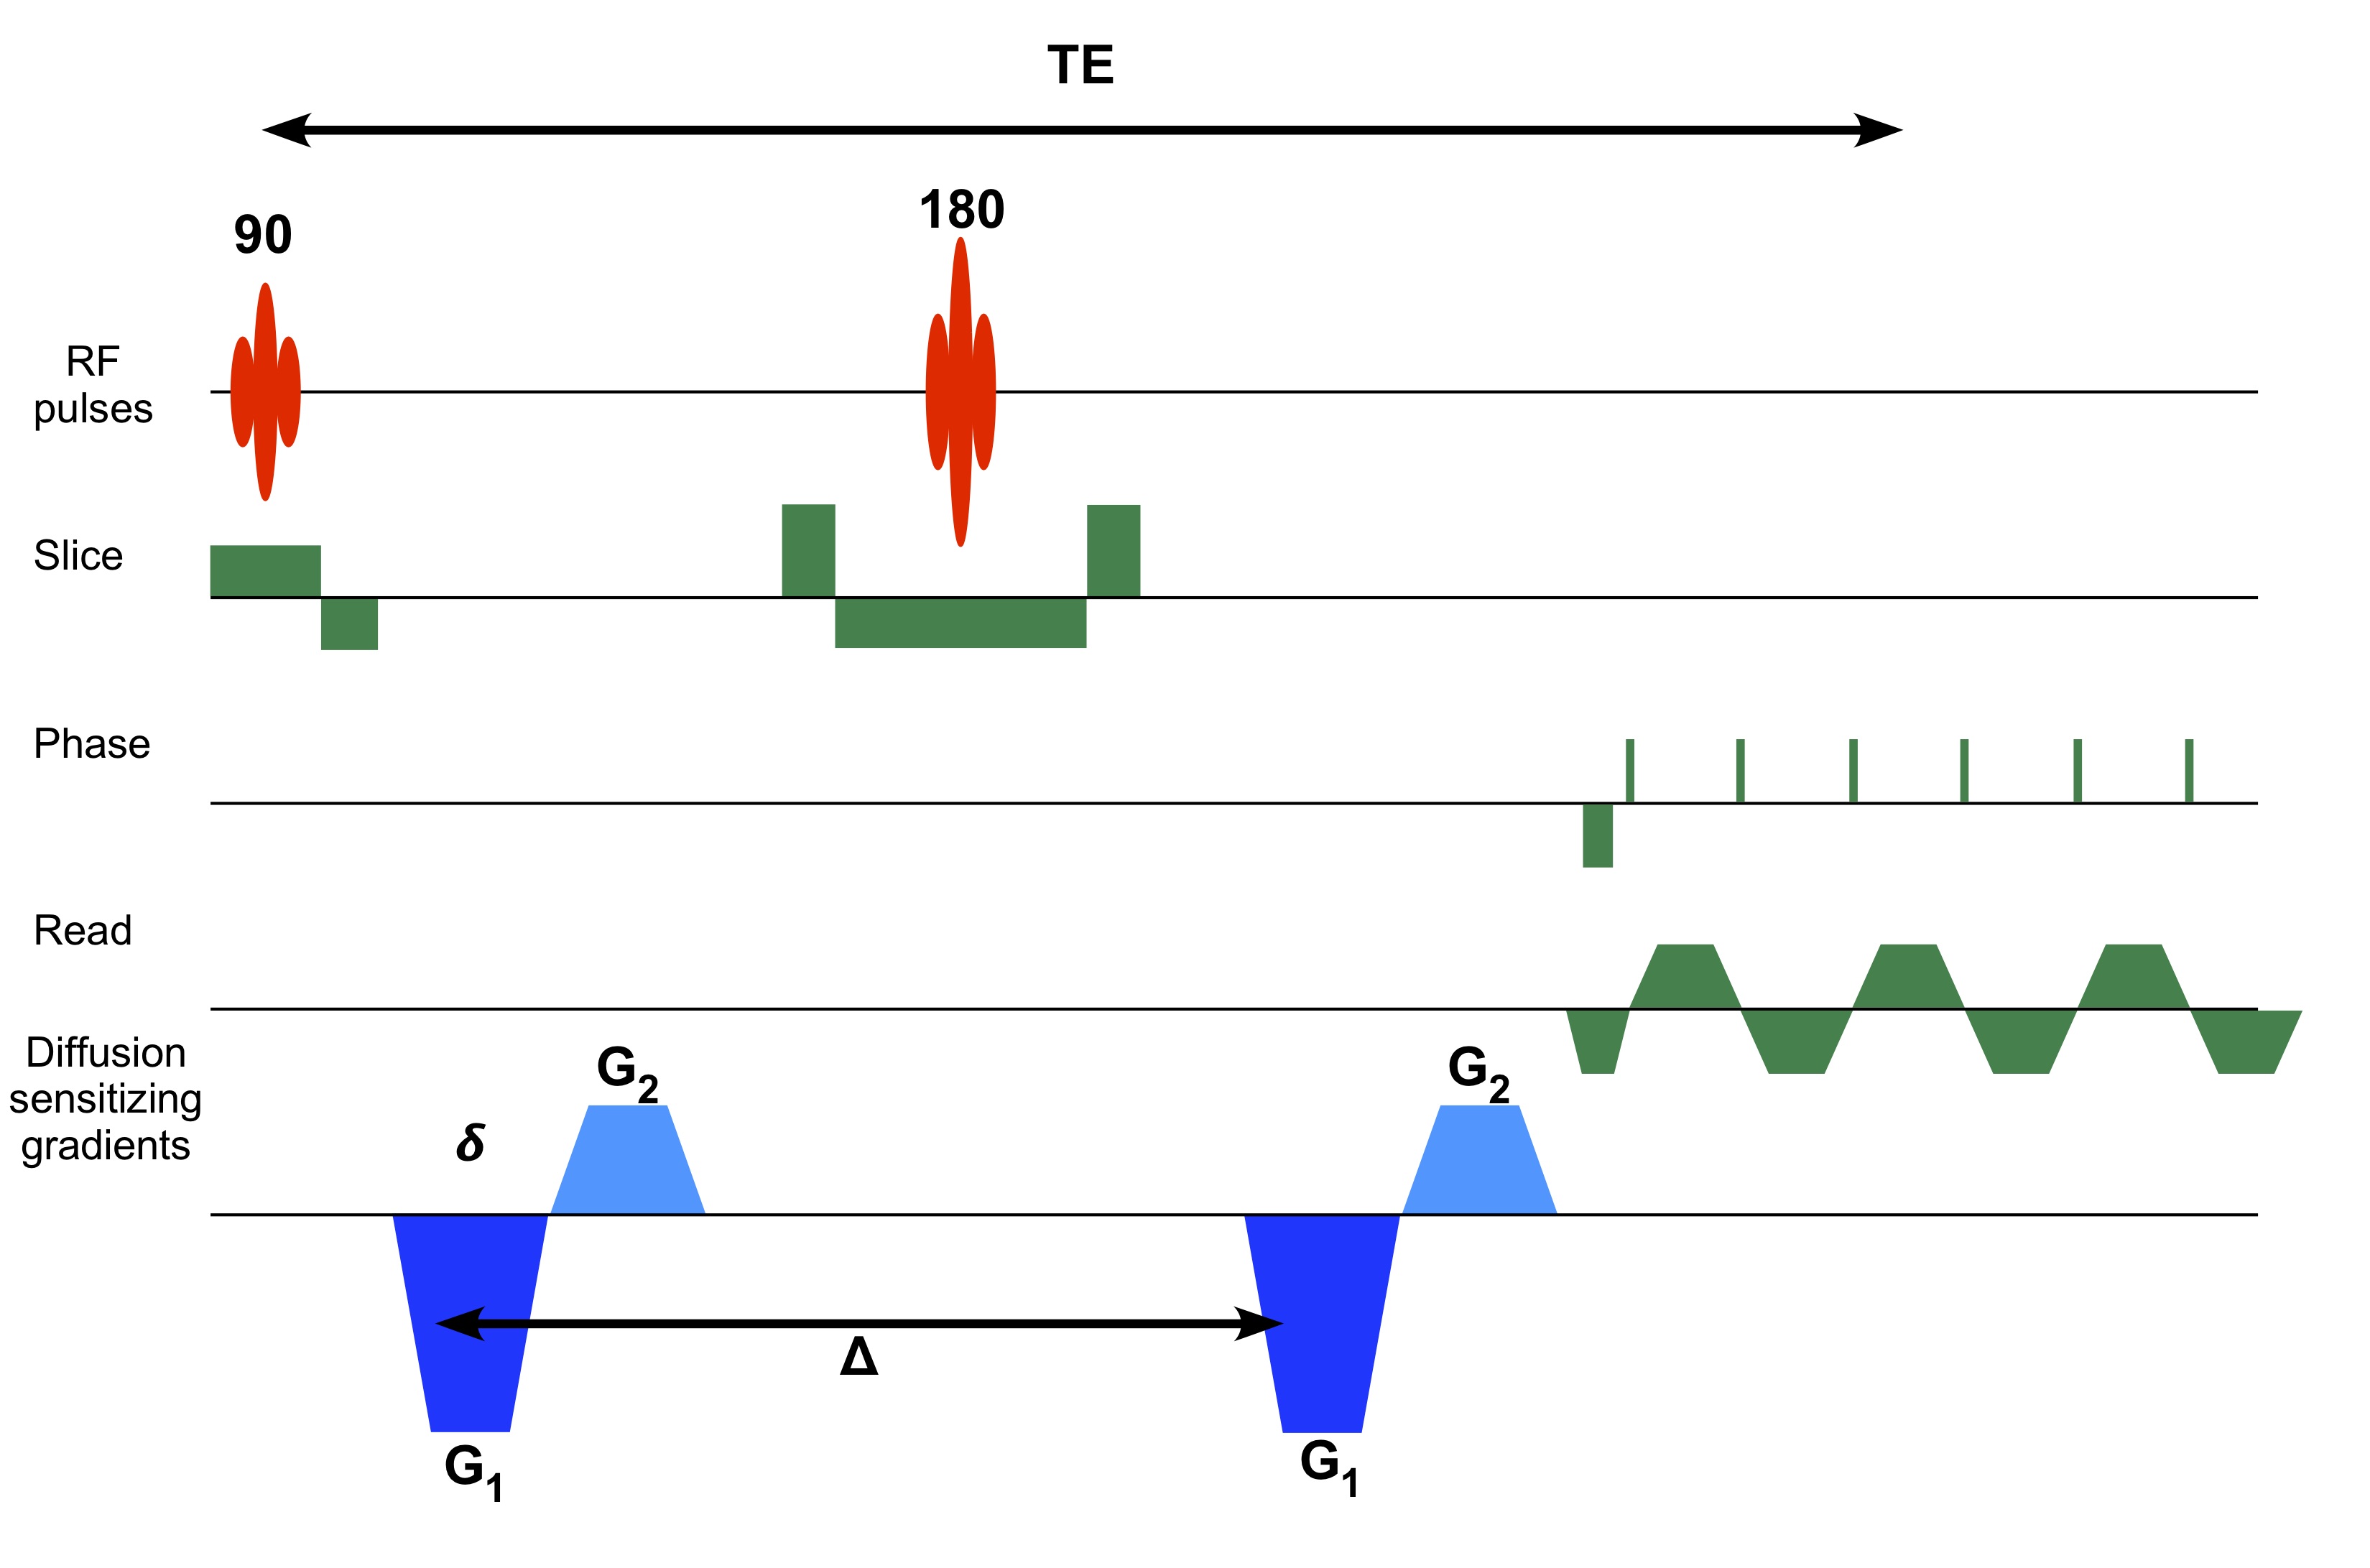
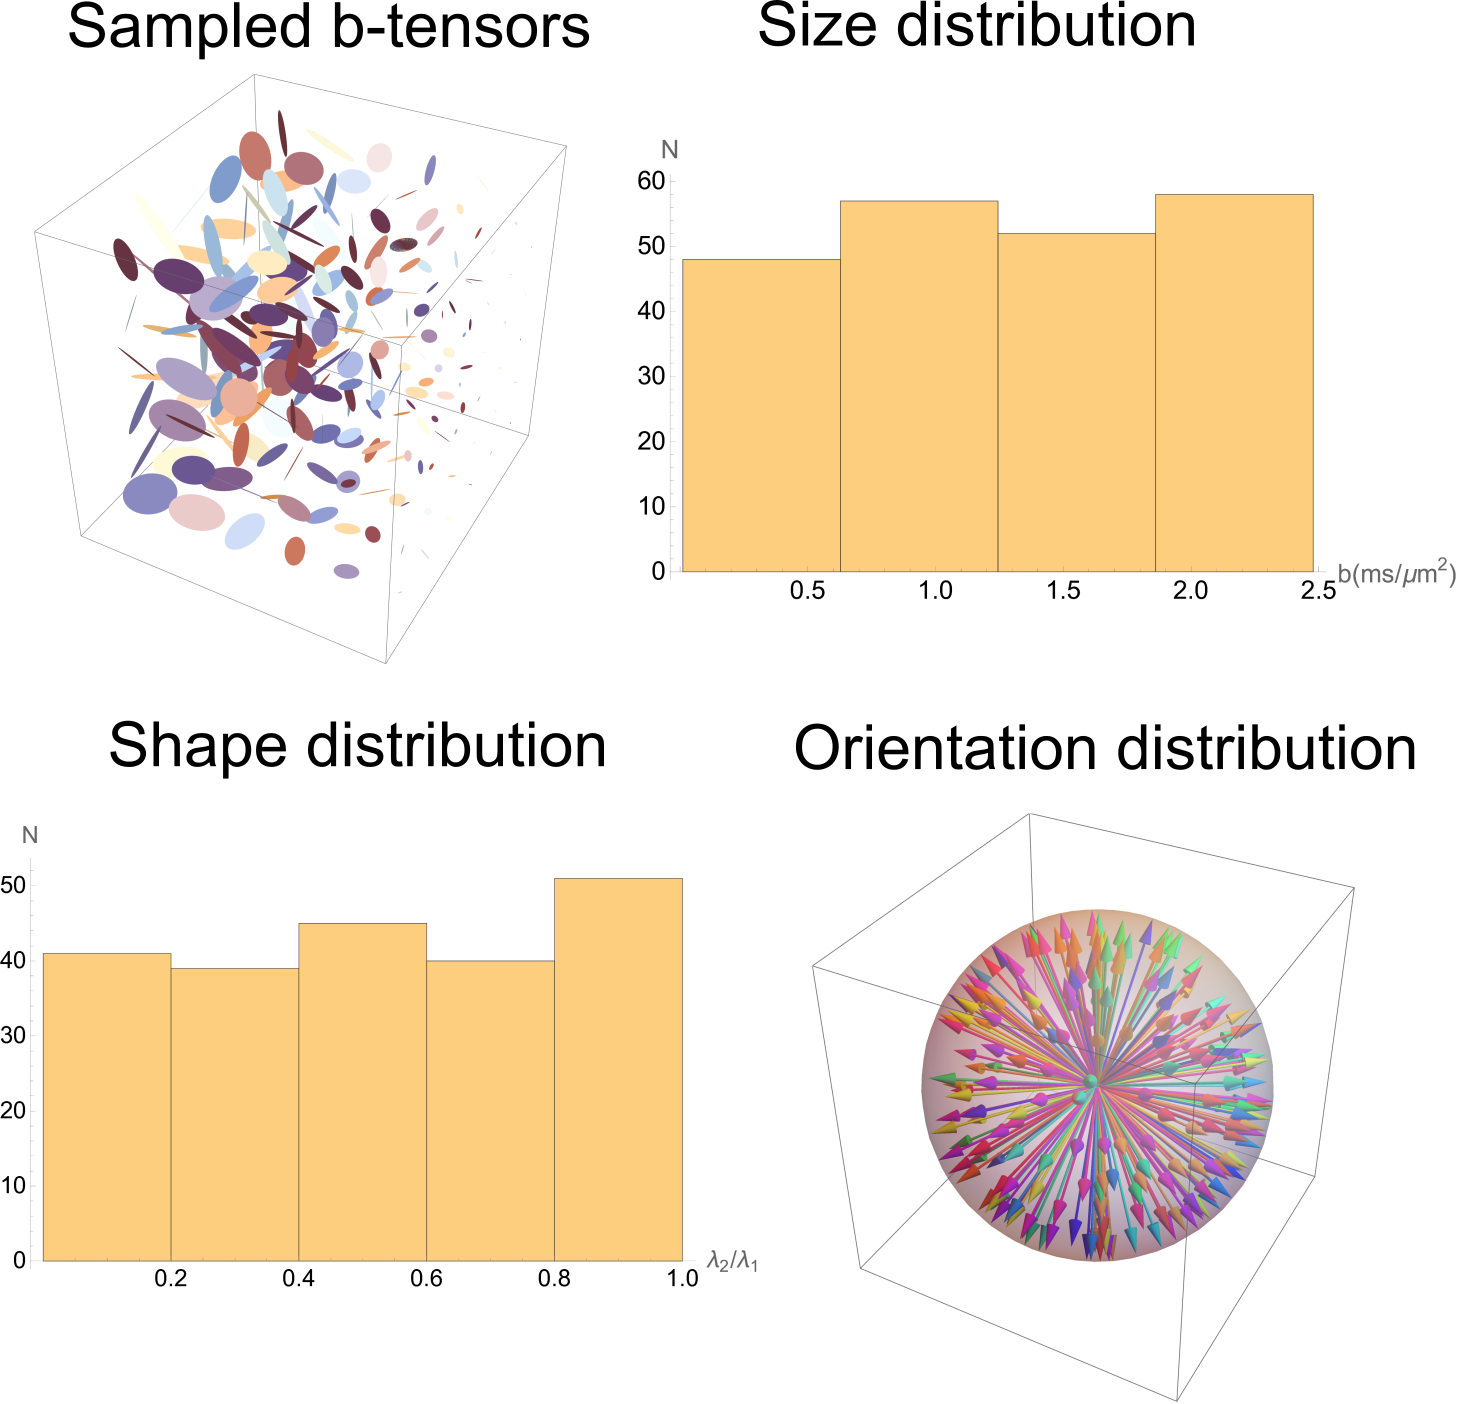
The diffusion measurements encoded with rank-1 and rank-2 b-tensors were acquired using a novel double PFG pulse sequence with EPI readout and multi-band (MB) slice excitation (Figure 1). The new pulse sequence uses efficient trapezoidal gradients with well-defined diffusion times needed for q-space analysis. The sequence is also immune to concomitant gradient field artifacts known to affect DTD results4. The two independent gradients in the diffusion block were estimated numerically to yield a set of 216 diffusion encoding b-tensors with uniform distribution of sizes (b = 0 – 2,500 s/mm2), shapes, and orientations, as shown in Figure 2 for an unbiased estimation of the DTD.
MRI data was acquired on a 3T system (MAGNETOM Connectome, Siemens Healthineers) capable of up to 300 mT/m gradient strength and 200 T/m/s slew rate. Whole-brain DTD MRI data was acquired using the following parameters: δ/Δ = 9/33 ms, FOV=192 x 192 mm, MB factor = 2, TR/TE = 5,100/79 ms, and a 2 mm isotropic spatial resolution. The b = 0 s/mm2 acquisition was repeated with reversed phase encoding to correct for susceptibility distortions. The background phase in the complex data was removed to yield real valued images5 which were corrected for gradient nonlinearities, denoised6, and registered using FSL7.
Results and Discussion
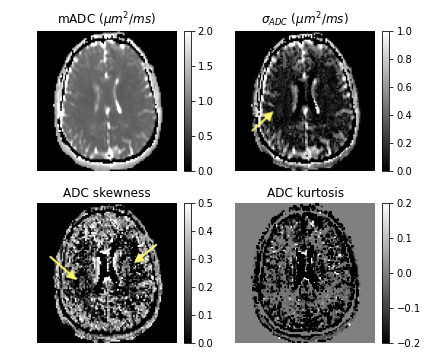
The μODF glyphs shown in Figure 3 accurately captures the splaying and crossing fibers of corona radiata and internal capsule, respectively. The reduction in FA caused by the complex fiber configurations in these and other regions are recovered in the μFA map and described using large orientation and shape heterogeneities in the Vshape and Vorient maps shown in Figure 4. The size differences within fiber tracts were revealed in the Vsize map which were also highlighted in the ADC skewness map in Figure 5. This may be reflective of a skewed axon diameter distribution (ADD) in white matter. The asymmetric part of the covariance tensor is non-vanishing in many parts of the brain highlighting the need for multiple diffusion encoding measurements to capture the microstructure beyond what diffusion kurtosis imaging (DKI) can provide.It should however be noted that the DTD model found no significant heterogeneity in the corpus callosum despite the axon diameter differences reported in other studies8. This is likely due to the microvoxel size in DTD set by the gradient strength (~ 12 μm) being about an order of magnitude larger than the diameters of axons being probed (< 1 μm).
Conclusion
A new experimental design and analysis technique is introduced to make an unbiased estimate of a DTD in each voxel, which is assumed to be the maximum entropy CNTVD. Various scalar parameters and glyphs are introduced to disentangle size, shape, and orientation heterogeneities within a voxel. This method was able to capture heterogeneity present within normal brain tissue and represents a significant advance in the study anisotropy and heterogeneity in brain microstructure.Acknowledgements
This work was funded by the Intramural Research Program of the Eunice Kennedy Shriver National Institute of Child Health and Human Development, and with some support from the NIH BRAIN Initiative: “Connectome 2.0: Developing the next generation human MRI scanner for bridging studies of the micro-, meso- and macro-connectome”, 1U01EB026996-01. The opinions expressed herein are those of the authors and are not necessarily representative of those of the Uniformed Services University of the Health Sciences (USUHS), the Department of Defense (DOD), the NIH or any other US government agency, or the Henry M. Jackson Foundation for the Advancement of Military Medicine, Inc.References
1. Jian, B., Vemuri, B. C., Ozarslan, E., Carney, P. R. & Mareci, T. H. A novel tensor distribution model for the diffusion-weighted MR signal. Neuroimage 37, 164–76 (2007).
2. Magdoom, K. N., Pajevic, S., Dario, G. & Basser, P. J. A new framework for MR diffusion tensor distribution. Sci. Rep. 11, 2766 (2021).
3. Avram, A. V., Sarlls, J. E. & Basser, P. J. Measuring non-parametric distributions of intravoxel mean diffusivities using a clinical MRI scanner. Neuroimage 185, 255–262 (2019).
4. Szczepankiewicz, F., Westin, C. & Nilsson, M. Maxwell‐compensated design of asymmetric gradient waveforms for tensor‐valued diffusion encoding. Magn. Reson. Med. 82, 1424–1437 (2019).
5. Fan, Q. et al. Axon diameter index estimation independent of fiber orientation distribution using high-gradient diffusion MRI. Neuroimage 222, 117197 (2020).
6. Veraart, J. et al. Denoising of diffusion MRI using random matrix theory. Neuroimage 142, 394–406 (2016).
7. Jenkinson, M., Beckmann, C. F., Behrens, T. E. J., Woolrich, M. W. & Smith, S. M. FSL. Neuroimage 62, 782–790 (2012).
8. Aboitiz, F., Scheibel, A. B., Fisher, R. S. & Zaidel, E. Fiber composition of the human corpus callosum. Brain Res. 598, 143–153 (1992).
Figures